


Abstract
Background: Rurality strongly correlates with higher pay-for-performance access bonuses, despite higher emergency department use and fewer primary care services than in urban settings. We sought to evaluate the relation between patient-reported access to primary care and access bonus payments in urban settings.
Methods: We conducted a cross-sectional, secondary data analysis using Ontario survey and health administrative data from 2013 to 2017. We used administrative data to calculate annual access bonuses for eligible urban family physicians. We linked this payment data to adult (≥ 16 yr) patient data from the Health Care Experiences Survey to examine the relation between access bonus achievement (in quintiles of the proportion of bonus achieved, from lowest [Q1, reference category] to highest [Q5]) and 4 patient-reported access outcomes. The average survey response rate to the patient survey during the study period was 51%. We stratified urban geography into large, medium and small settings. In a multilevel regression model, we adjusted for patient-, physician- and practice-level covariates. We tested linear trends, adjusted for clustering, for each outcome.
Results: We linked 18 893 respondents to 3940 physicians in 414 bonus-eligible practices. Physicians in small urban settings earned the highest proportion of their maximum potential access bonuses. Access bonus achievement was positively associated with telephone access (Q2 odds ratio [OR] 1.18, 95% confidence interval [CI] 0.98–1.42; Q3 OR 1.34, 95% CI 1.10–1.63; Q4 OR 1.46, 95% CI 1.19–1.79; Q5 OR 1.87, 95% CI 1.50–2.33), after hours access (Q2 OR 1.26, 95% CI 1.09–1.47; Q3 OR 1.46, 95% CI 1.23–1.74; Q4 OR 1.77, 95% CI 1.46–2.15; Q5 OR 1.88, 95% CI 1.52–2.32), wait time for care (Q2 OR 1.01, 95% CI 0.85–1.20; Q3 OR 1.17, 95% CI 0.97–1.41; Q4 OR 1.27, 95% CI 1.05–1.55; Q5 OR 1.63, 95% CI 1.32–2.00) and timeliness (Q2 OR 1.29, 95% CI 0.98–1.69; Q3 OR 1.29, 95% CI 0.94–1.77; Q4 OR 1.58, 95% CI 1.16–2.13; Q5 OR 1.98, 95% CI 1.38–2.82). When stratified by geography, we observed several of these associations in large urban settings, but not in small urban settings. Trend tests were statistically significant for all 4 outcomes.
Interpretation: Although the access bonus correlated with access in larger urban settings, it did not in smaller settings, aligning with previous research questioning its utility in smaller geographies. The access bonus may benefit from a redesign that considers geography and patient experience.
In the early 2000s, Canadians were having challenges accessing primary care.1–6 To address the problem, Ontario was among several provinces that implemented aggressive primary care reform,7–9 including the 2004 introduction of a pay-for-performance financial incentive, the access bonus, which can increase a family physician’s earnings by up to about 20% of their capitation payments.10 The access bonus is structured such that primary care practices earn bonuses when their patients do not seek external care (i.e., outside use) for core primary care services. The more outside use, the lower the bonus,11 though emergency department visits are not included in the calculation.
In 2019, our team published a study showing that rurality was strongly associated with high bonus achievement despite higher use of the emergency department, higher per capita costs and delivery of fewer primary care services, compared with urban settings.12 In the urban context, lower access bonus achievement appeared to reflect patient choice and the abundance of external sources of care (e.g., walk-in clinics) rather than accessibility of primary care practices.
Like many pay-for-performance studies, our 2019 study used health care utilization data as a proxy measure for access.12 This approach, however, may not capture other aspects of access,13,14 and therefore may not reflect the entire patient experience.15 Given the importance of the patient experience in evaluating health care quality,16 we sought to evaluate the relation between access to primary care, as reported by patients in Ontario, and the access bonus received by their family physicians. In view of our previous finding that rurality strongly predicts access bonus achievement, we focused specifically on the urban context, where more variability in bonus achievement exists and where the competition created by walk-in clinics may play a role in the incentive’s effectiveness.17 We evaluated the relation between patient-reported access and access bonus payments from 2013 to 2017. We hypothesized that the bonus amount should correlate with patient-reported access as physicians and practices with higher bonus achievement may organize their services to optimize access.
Methods
Design
We undertook a cross-sectional secondary data analysis using Ontario data from a patient experience survey linked with health administrative data.
Setting and context
The access bonus is available to Ontario family practices that operate within a blended capitation model of care. In this model, patients are enrolled to a family physician and most physician earnings come from an annual per-patient payment, adjusted for patient age and sex. These models can be team-based or not, with team-based models receiving additional support from government-funded allied health professionals.
Data sources and linkages
Patient experience data came from the Health Care Experiences Survey (HCES), a random telephone survey that asks patients aged 16 years and older about their experiences with health care. Funded by the Ontario government, the HCES was launched in October 2012 and is conducted quarterly by York University.18 The Ontario population is sampled using the Registered Persons Database, a provincial database containing personal and demographic data for all current and previous Ontario Health Insurance Plan (OHIP) registrants. The HCES includes questions on primary care access, which we used as the outcomes for our study.18 We also used HCES patient-reported data about education, primary language, immigration status and health status in the analyses.
As part of the consent process for the HCES, participants are asked for permission to link their responses to their health administrative data. We obtained health administrative data from ICES. ICES is an independent, nonprofit research institute whose legal status under Ontario’s health information privacy law allows it to collect and analyze health care and demographic data, without consent, for health system evaluation and improvement. Patient-level health administrative data came from the Registered Persons Database (age, sex) and census data holdings (income quintiles). Physician-level data came from the ICES Physician Database (age, sex, Canadian graduate, number of years in practice), the Primary Care Population Database (geographic location, roster size [number of enrolled patients]) and Architected Payments data (access bonus achievement). Practice-level data came from the Primary Care Population database (practice model, group size) and OHIP billings (after-hours services provided).
The HCES and ICES data sets were linked using unique encoded identifiers and analyzed at ICES.
Participants
More than 2000 adults (≥ 16 yr) are included in each quarterly wave of the HCES.19 We derived our study population from HCES participants from 2013 to 2017. The average survey response rate over the study period was 51%, ranging from 46% to 56%. Of those interviewed more than once, we included only the first interview in our sample. We restricted our sample to those who indicated they had a regular primary care source and who consented to have their survey data linked to health administrative data. We excluded patients belonging to practices not in blended capitation models and therefore ineligible for the access bonus. We excluded patients from practices exempted from providing a minimum level of weekly after-hours availability. We excluded patients in rural geographies using the Rurality Index of Ontario (RIO) scoring system, which is detailed below.20
Variable definitions
We stratified our urban sample into 3 geographies using the RIO scoring system. This system was developed by the Ontario Medical Association and is used by the Ontario government for planning purposes.20 Maps and the RIO methodology are described elsewhere.20 In summary, a RIO score for a community is determined using a calculation that considers population size and density, travel time to the nearest basic referral centre and travel time to the nearest advanced referral centre. Scores range from 0–100 and reflect a relative ranking of rurality. A higher score reflects a higher degree of rurality.
We used the same definition for “urban” (RIO 0–39) as was used previously,12 and stratified areas according to a priori categories based conceptually on the different ways in which health care services are organized and delivered across various urban communities. For example, a large tertiary care centre like Toronto was considered a different urban context than a smaller, more remote city like North Bay. We labelled our geographies as large urban (RIO 0; e.g., Toronto), medium urban (RIO 1–9; e.g., Burlington) and small urban (RIO 10–39; e.g., North Bay).
Outcomes
Patients’ experiences of access came from 4 measures in the HCES, namely telephone access, after-hours access, wait time for care and timeliness of wait for care. Table 1 describes the question stems, answer choices and the binary coding schemes (favourable or unfavourable) applied to each outcome variable. The measure of timeliness was added to the HCES in April 2016, meaning a smaller sample of respondents was available for that outcome than for the other 3 outcomes, which were in the survey from the beginning of the study period.
Patient-reported access variables and coding schemes from the Health Care Experiences Survey (HCES)
Exposure
Our main exposure of interest was access bonus achievement. The access bonus is deposited monthly into a practice group’s account for distribution to its physicians and represents a sum of each physician’s bonus attribution. Each physician receives a monthly report of their individual attribution and a list of their patients who sought outside use. Conceptually, both group- and physician-level factors can influence access bonus achievement. At the physician level, differences in individual roster management may reflect individual responses to the incentive. To account for these within-group variations, we therefore treated the bonus as a physician-level variable. We calculated access bonus achievement as the proportion of the maximum potential bonus that was achieved by the physician in the fiscal year closest to the HCES interview date. For example, if a physician was eligible for a maximum bonus of $10 000 and achieved $5000, the bonus achievement for that physician was calculated as 50%.
We did not want to force a linear relationship between access bonus achievement and the log odds of the binary outcome. Based on the pattern of distribution of the bonus in our data set, and in keeping with previous literature,12 we therefore classified the bonus into quintiles and treated these as categorical variables. Quintile 1 represented the lowest physician bonus achievement and quintile 5 represented the highest achievement. We used quintile 1 as the reference group in the analyses.
Covariates
We identified covariates by reviewing previous literature that evaluated factors related to primary care access.13,14,21–24 Patient-level covariates were age, sex, education, primary language, health status, income quintile, and immigration status. Physician-level covariates were age, sex, Canadian medical graduate (yes or no), years in practice and roster size. Practice-level covariates were group size, practice model and annual number of after-hours services. We reported patient emergency department use, primary care visits and walk-in clinic use as part of the descriptive analysis. We used a look-back period of 12 months before the HCES interview date to derive variables from health administrative data (e.g., physician- and practice-level variables).
Statistical analysis
We conducted a descriptive analysis of the total sample and the geographically stratified sample.
To evaluate the relationship between access bonus achievement and the 4 patient-reported access outcomes, we conducted univariate and multivariable logistic regression analyses for both the total sample and the geographically stratified sample. To account for nesting of patients within physicians and physicians within practices, we used multilevel modelling (patient-, physician- and practice-level). We tested linear trends, adjusted for clustering, for each outcome for the total sample and for each geographic stratum.
We used SAS Enterprise Guide version 7.1 (SAS Institute Inc.) for all analyses.
Ethics approval
The use of data in this project was authorized under section 45 of Ontario’s Personal Health Information Protection Act, which does not require review by a Research Ethics Board.
Results
We included 18 893 patients enrolled with 3940 physicians in 414 practices (Figure 1). Table 2, Table 3 and Table 4 report the descriptive analyses of patient, practice and physician characteristics, respectively. Mean patient age was 53.8 (standard deviation [SD] 17.05), years and 11 278 (59.7%) patients were female. Most patients had completed postsecondary education (n = 11 339, 60.6%), spoke English as their primary language (n = 17 294, 91.9%), were nonimmigrants (n = 14 726, 78.2%), and were in middle income quintiles (n = 11 379, 60.5%). Compared with patients in large and medium urban settings, patients in small urban settings had a lower mean number of primary care visits (small urban 3.00 [SD 3.33], medium urban 3.27 [SD 3.68], large urban 3.28 [SD 3.44]) and a higher number of emergency department visits (small urban 0.48 [SD 1.04], medium urban 0.36 [SD 1.23], large urban 0.36 [SD 1.03]) in the previous year.

Patient cohort flowchart. Note: HCES= Health Care Experiences Survey.
Patient characteristics
Practice characteristics
Physician characteristics
Most practices did not use team-based models. Most practices and physicians were in large urban settings. Mean physician age was 51.9 (SD 11.66) years, and 1872 (47.5%) physicians were female. The mean annual number of after-hours services provided was highest in large urban practices (3962.5 [SD 4760.1] services).
Table 4 includes description of the main exposure, access bonus, by geographic setting. The mean proportion of maximum potential access bonus achieved by physicians in our total sample was 40.26% (SD 30.67%). The mean was highest in small urban settings and lowest in large urban settings.
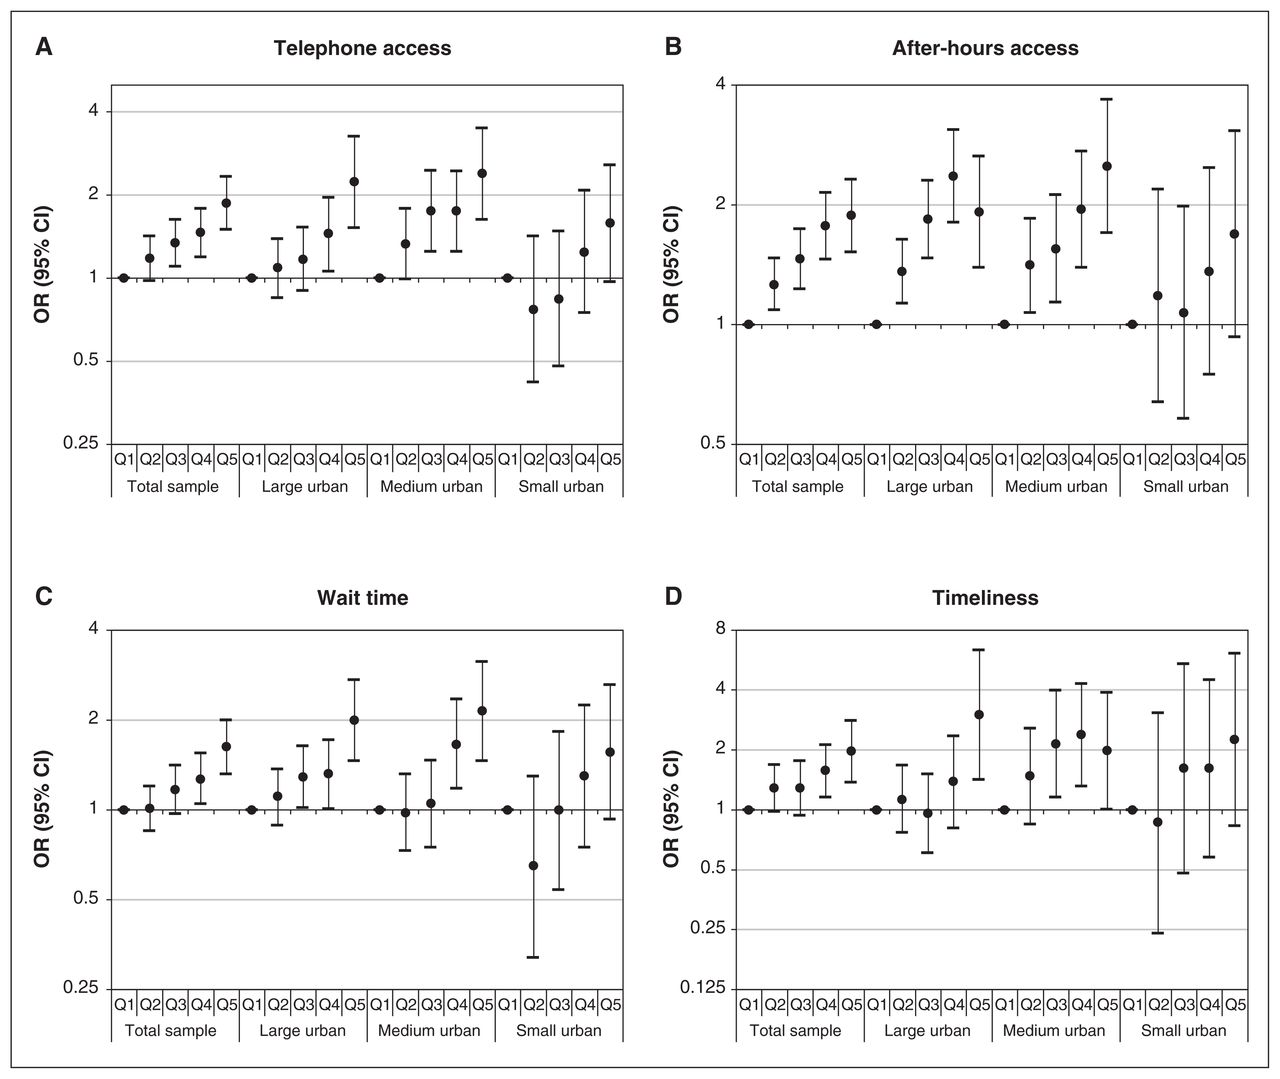
Figure 2 describes the 4 patient-reported access outcomes by geography. Figure 3 depicts the results of our univariate regression analyses. We found statistically significant, positive relationships between access bonus achievement and each access outcome.

Patient-reported access (2013 to 2017), namely (A) telephone access (n = 10 968), (B) after-hours access (n = 18 889), (C) wait time for care (n = 9485) and (D) timeliness of wait for care (n = 3048) from Health Care Experiences Survey. “Timeliness” reflects survey responses from April 2016 to 2017. Note: RIO = Rurality Index of Ontario.

Multilevel univariate regression analysis of the odds of the patient reporting favourable (A) telephone access, (B) after-hours access, (C) wait time for care and (D) timeliness of wait for care, by geography and physician bonus quintile (Q1 = reference [lowest] quintile). Note: CI = confidence interval, OR = odds ratio.
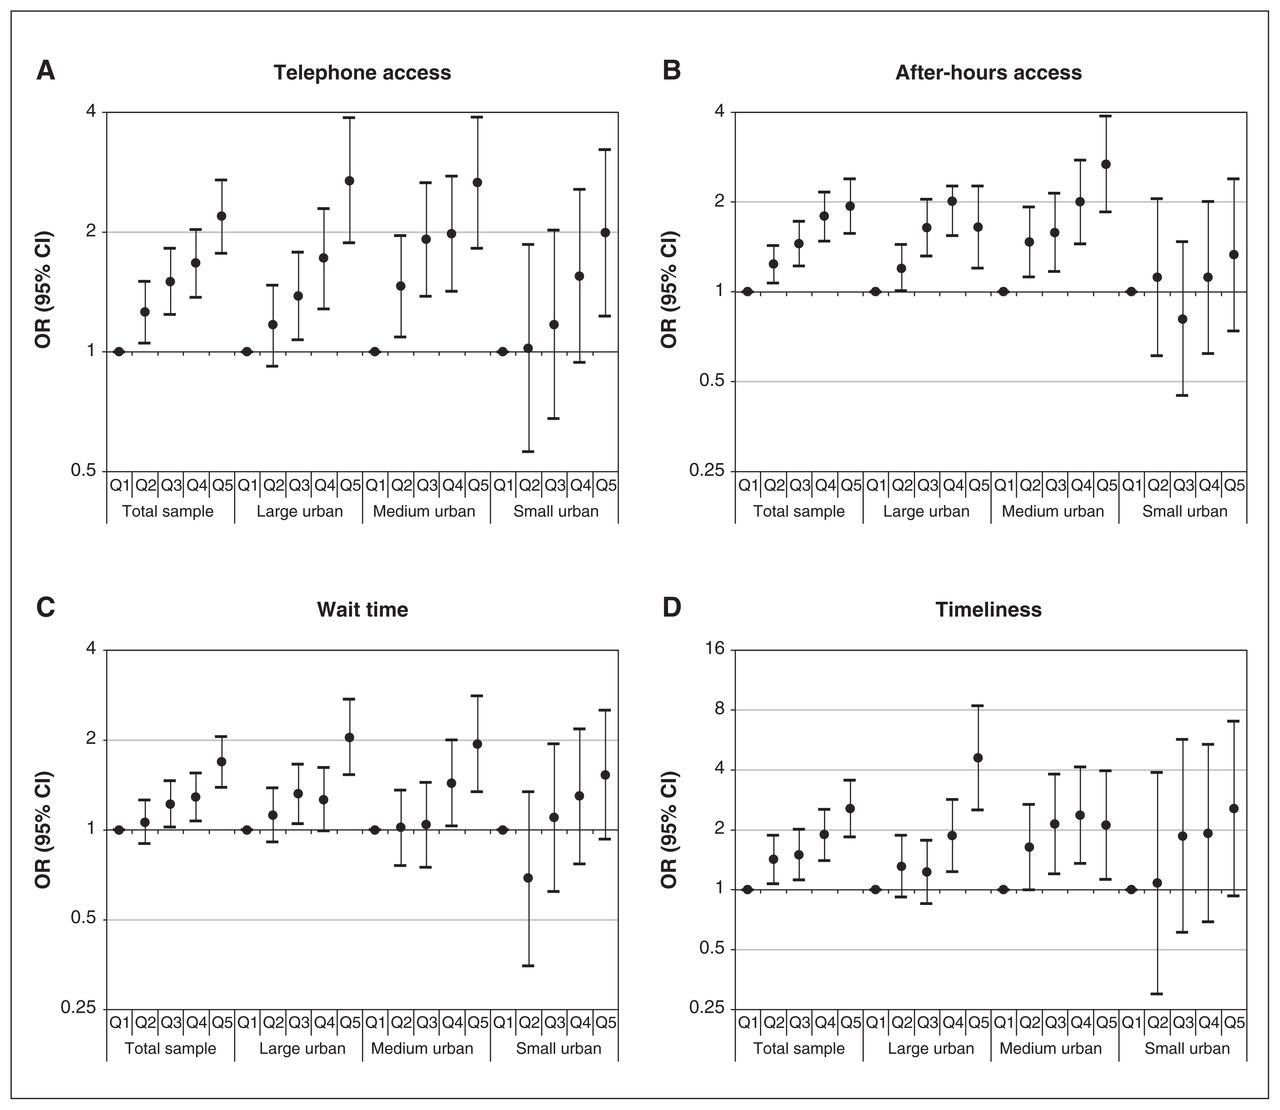
Our multivariable regression analysis also showed positive relationships between access bonus achievement and patient-reported access (p < 0.05, 95% CI) (Figure 4). Access bonus achievement was positively associated with telephone access (Q2 odds ratio [OR] 1.18, 95% confidence interval [CI] 0.98–1.42); Q3 OR 1.34, 95% CI 1.10–1.63; Q4 OR 1.46, 95% CI 1.19–1.79; Q5 OR 1.87, 95% CI 1.50–2.33), after-hours access (Q2 OR 1.26, 95% CI 1.09–1.47; Q3 OR 1.46, 95% CI 1.23–1.74; Q4 OR 1.77, 95% CI 1.46–2.15; Q5 OR 1.88, 95% CI 1.52–2.32), wait time for care (Q2 OR 1.01, 95% CI 0.85–1.20; Q3 OR 1.17, 95% CI 0.97–1.41; Q4 OR 1.27, 95% CI 1.05–1.55; Q5 OR 1.63, 95% CI 1.32–2.00) and timeliness (Q2 OR 1.29, 95% CI 0.98–1.69; Q3 OR 1.29, 95% CI 0.94–1.77; Q4 OR 1.58, 95% CI 1.16–2.13; Q5 OR 1.98, 95% CI 1.38–2.82).
Multilevel multivariable logistic regression analysis of the odds of the patient reporting favourable (A) telephone access, (B) after-hours access, (C) wait time for care and (D) timeliness of wait for care, by geography and physician bonus quintile (Q1 = reference [lowest] quintile). Note: CI = confidence interval, OR = odds ratio.
When stratified by geography, we observed several positive relations in large urban settings, a few positive relations in medium settings and no relations in small settings. Certain patient demographics (i.e., female sex, older age, higher education, nonimmigrant status, better self-reported health) also correlated with better access across several measures. Intraclass correlation coefficients showed that patient-level factors accounted for most of the variance in all 4 outcomes in the multivariate regression analyses. Tables 5⇓⇓–8 report the multivariable regression results for the main exposure, as well as patient-, physician- and practice-level covariates.
Multilevel multivariable logistic regression for patient-reported telephone access, by geography
Multilevel multivariable logistic regression for patient-reported after-hours access, by geography
Multilevel multivariable logistic regression for patient-reported wait time for care, by geography
Multilevel multivariable logistic regression for patient-reported timeliness of wait, by geography
Linear trend testing found statistically significant trends across quintiles in the total sample and in large and medium urban settings for all 4 outcomes. In small urban settings, we observed trends for telephone access and wait time for care. These results are summarized in Appendix 1, available at www.cmajopen.ca/content/9/4/E1080/suppl/DC1.
Interpretation
In this study, we evaluated the pay-for-performance access bonus through the lens of the patient experience, and with a deeper dive into the complex, competitive urban landscape. We looked at 4 patient-reported access measures from the large, multi-year HCES, and stratified urban Ontario into 3 distinct geographies. We found the access bonus correlates with better patient-reported access in large urban settings and, to some extent, in medium urban settings.
Our findings suggest that in the most competitive primary care markets, such as large cities with numerous walkin clinics, the bonus may motivate physicians and practices to organize and deliver services in ways that better meet patient needs. Although a cross-sectional study cannot confirm causality, the dose–response trends seen for 3 of the 4 outcomes (i.e., the higher the access bonus, the higher the odds for favourable telephone access, after-hours access and wait time) suggest the relationship may be causal.
These findings contrast with previous research measuring access using health care utilization data, which found no correlation between the bonus and patient access.12 A key reason for the difference in findings may be the different outcomes used to define access, highlighting the multidimensional nature of access13,14,25 and the need for policy-makers to depend on more than 1 measure. Moreover, the current study explored the relationship between the access bonus and patient-reported access at different levels of urban geography, and used a different conceptual approach to calculating the physician bonus to capture within-group variations.
In small urban settings, we did not see correlations between the access bonus and any of the patient-reported access measures. This suggests that the incentive may not be effective in geographies where competition is minimal, patient choice is limited and emergency departments (often staffed by family physicians) are the primary setting for time-sensitive care. This finding does align with the conclusion from previous research questioning the utility of the access bonus, particularly in smaller settings.12 In this context, the bonus does not appear to relate to the access provided to patients.
Our multilevel, multivariable regression analysis of the total sample found that certain patient demographics reported better access. Female sex, older age, higher education, nonimmigrant status and better self-reported health correlated with better access across several measures. Although these relations were less consistent when the sample was geographically stratified, they suggest alignment with previous research that found certain patients are more likely to enjoy better access.13,21 This finding reiterates the importance of designing services to meet the needs of more vulnerable populations. We further note, based on our intra-class correlation coefficients, that patient factors are more influential than physician or practice factors, which is consistent with previous research that found physician incentives may be of limited utility.26–29 These observations also raise interesting questions around the relation between access-oriented incentives and continuity of care.
Longitudinal and qualitative research would help to understand the nature and direction of causal relationships better. For example, a qualitative study exploring organizational factors may help us to understand why otherwise similar practices may differ in bonus achievement and patient-reported access, providing guidance for practices wishing to improve their services.
Limitations
A cross-sectional analysis cannot confirm causality; it is possible that better access was a pre-existing feature of large urban practices that opted into the blended capitation model.30 Smaller sample sizes in smaller geographies means any effects in these settings needed to be larger to be statistically significant. The same sample size limitation was seen for the timeliness outcome, which was only added to the HCES in April 2016. We did not include some forms of access, such as email, because of small sample size in the HCES for these questions. In the future, increases in email and other forms of virtual care may allow studies to evaluate these forms of access.
Like many surveys, the HCES is susceptible to sampling bias and recall bias,21 and the HCES’ low average response rate of 51% may amplify these biases. The nonlinearity of certain covariates, such as roster size and group size, mean that regression results for these covariates should be interpreted with caution. Finally, we did not adjust for multiple comparisons. Although we increased the chance of type 1 error by asking multiple questions, linear trend tests suggest the dose–response trends in our results are real.
Conclusion
This study adds to existing literature by evaluating the access bonus through a patient experience lens and within the complex urban context. Although the bonus did correlate with access in larger urban settings, this was not the case in small urban settings, aligning with previous research questioning its utility in smaller geographies. Limited evidence supports pay-for-performance in health care. The access bonus incentive may benefit from a redesign that considers geographic factors and the patient experience.
Footnotes
Competing interests: Kamila Premji is a junior clinical research chair in family medicine at the University of Ottawa, a board director with Canadian Women in Medicine, and a committee member with the Ontario Ministry of Health Primary Care Advisory Table and the Ontario Medical Association. She reports consulting fees and honoraria from the Ontario Ministry of Health and the Ontario Medical Association, and travel support from the University of Western Ontario. Tara Kiran reports grants and salary support from University of Toronto, St. Michael’s Hospital Foundation, St. Michael’s Hospital Staff Association, St. Michael’s Hospital Family Medicine Associates, Health Quality Ontario, Canadian Institutes of Health Research, Ontario Ministry of Health and Gilead Sciences Canada, and honoraria from the Ontario College of Family Physicians, Nova Scotia Health Authority, Ontario Medical Association, Alliance for Healthier Communities, McMaster Program for Faculty Development, Vancouver Physician Staff Association and Osgoode Hall Law School. She reports participation on the data safety monitoring board of the CHOICES study. No other competing interests were declared.
This article has been peer reviewed.
Contributors: Kamila Premji conceived the study. Kamila Premji, Ewa Sucha, Richard Glazier, Michael Green, Walter Wodchis, William Hogg, Tara Kiran and Bridget Ryan contributed to the study design. Ewa Sucha conducted the analysis. All authors interpreted the data. Kamila Premji drafted the manuscript and all authors revised it critically for important intellectual content, gave final approval of the version to be published and agreed to be accountable for all aspects of the work.
Funding: Funding for this study was received from the Physicians Services Incorporated Research Trainee Fellowship (to Kamila Premji), and from the INSPIRE-PHC2 study, which is funded by the Ontario Ministry of Health (MOH) and the Ontario Ministry of Long-Term Care (MLTC). This study was supported by ICES, which is funded by an annual grant from the Ontario MOH and the MLTC. The opinions, results, and conclusions reported in this paper are those of the authors and are independent from the funding sources. No endorsement by ICES, the MOH or MLTC is intended or should be inferred.
Data sharing: The data set from this study is held securely in coded form at ICES. Although data sharing agreements prohibit ICES from making the data set publicly available, access may be granted to those who meet prespecified criteria for confidential access, available at www.ices.on.ca/DAS. The full data set creation plan and underlying analytic code are available from the authors upon request, understanding that the computer programs may rely upon coding templates or macros that are unique to ICES and are therefore either inaccessible or may require modification.
Supplemental information: For reviewer comments and the original submission of this manuscript, please see www.cmajopen.ca/content/9/4/E1080/suppl/DC1
Disclaimer: This study was supported by ICES, which is funded by an annual grant from the Ontario Ministry of Health (MOH). The analyses, conclusions, opinions and statements expressed herein are solely those of the authors and do not reflect those of the funding or data sources; no endorsement is intended or should be inferred.
This is an Open Access article distributed in accordance with the terms of the Creative Commons Attribution (CC BY-NC-ND 4.0) licence, which permits use, distribution and reproduction in any medium, provided that the original publication is properly cited, the use is noncommercial (i.e., research or educational use), and no modifications or adaptations are made. See: https://creativecommons.org/licenses/by-nc-nd/4.0/
References
- © 2021 CMA Joule Inc. or its licensors
In this issue

Article tools


