


Abstract
Background: Sufficient fruit and vegetable consumption (≥ 5 servings/d) has been associated with a probable decreased risk for cancers of the oral cavity, pharynx, larynx, esophagus, stomach and lung (fruit only). The purpose of this study was to estimate the proportion and absolute number of cancer cases in Alberta in 2012 that were attributable to insufficient fruit and vegetable consumption.
Methods: The numbers and proportions of cancers attributable to insufficient fruit and vegetable consumption were estimated using the population attributable risk. Relative risks were obtained from international collaborative panels and peer-reviewed literature. Prevalence data for insufficient fruit and vegetable consumption in Alberta were obtained from the Canadian Community Health Survey (2003, 2004, 2005, 2007/08). Age-, site- and sex-specific cancer incidence data for 2012 were obtained from the Alberta Cancer Registry.
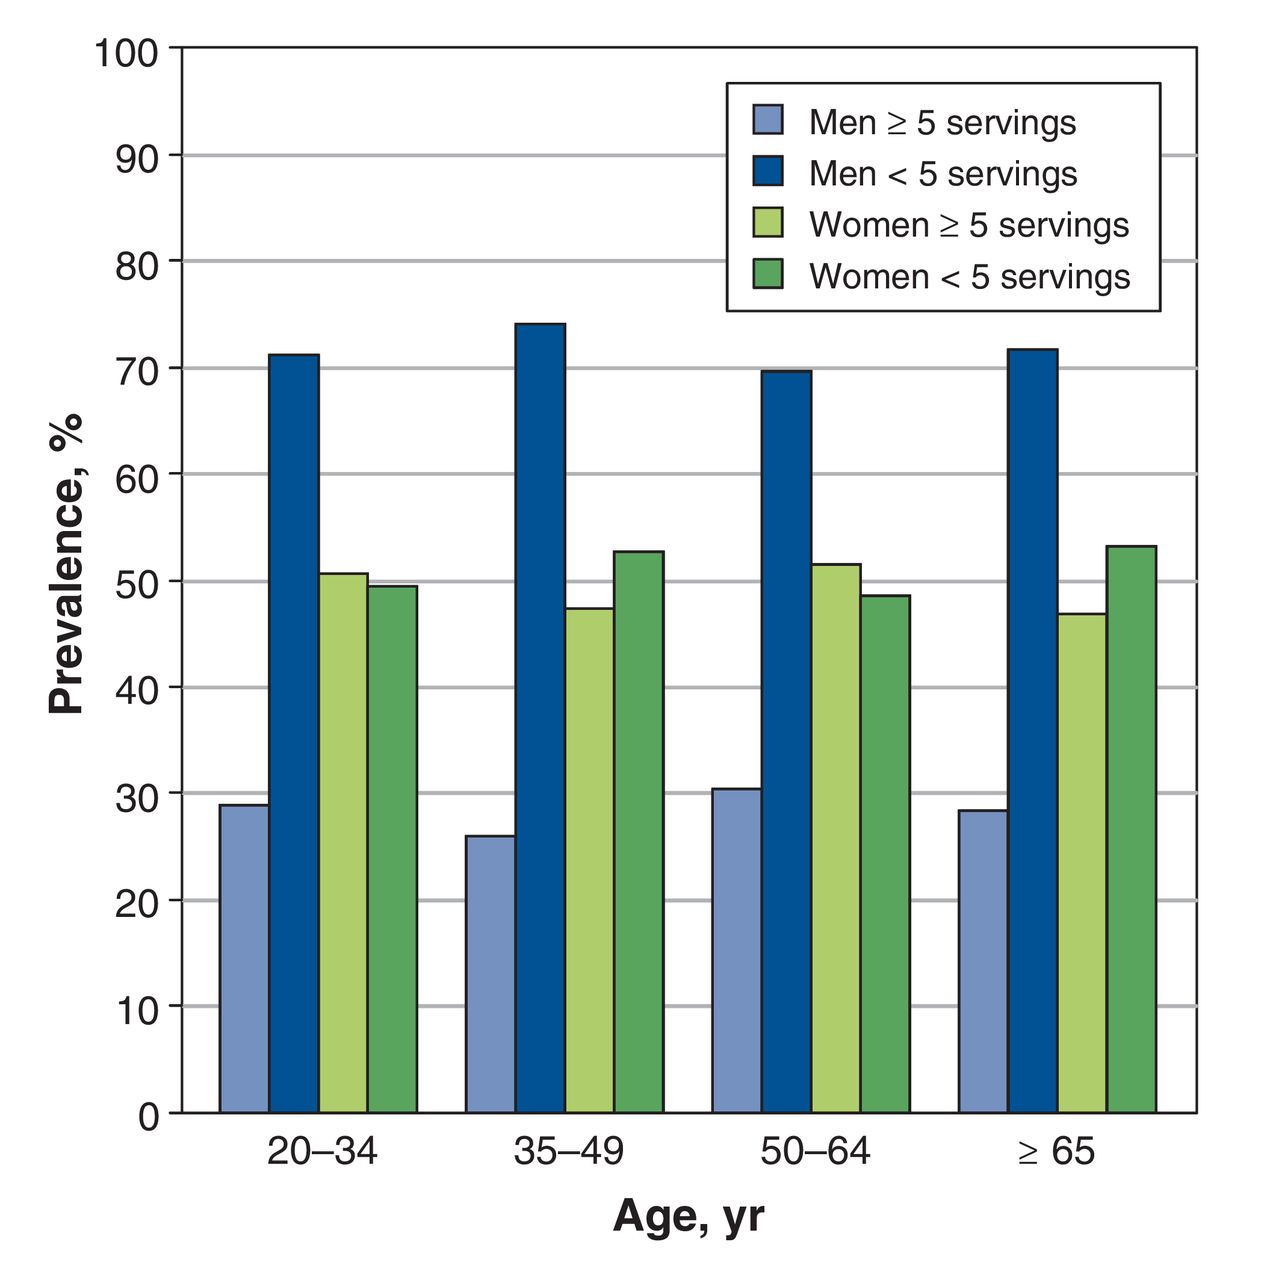
Results: The proportion of men consuming 5 or more servings of fruits and vegetables per day ranged from 25.9%-30.4% across age groups; the range among women was 46.8%-51.5% across age groups. The proportion of cancers attributable to insufficient fruit and vegetable consumption in Alberta was highest for esophageal cancer (40.0%) and lowest for lung cancer (3.3%). Overall, 290 cancer cases (1.8%) in Alberta in 2012 were attributable to insufficient fruit and vegetable consumption.
Interpretation: Almost 2% of cancers in Alberta can be attributed to insufficient fruit and vegetable consumption. A diet rich in fruits and vegetables has benefits for the prevention of cancer and other chronic diseases; thus, increasing the proportion of Albertans who meet cancer prevention guidelines for fruit and vegetable consumption is a priority.
In 2007, the World Cancer Research Fund classified fruits and vegetables as associated with a "probable decreased risk" for cancers of the oral cavity, pharynx, larynx, esophagus, stomach and lung (fruit only), and a "limited-suggestive decreased risk" for colorectal cancer.1 As described in a more recent review, these classifications were based primarily on the observation that the reduced cancer risks associated with fruit and vegetable consumption previously seen in case-control studies were not entirely replicated in large prospective studies, particularly for colorectal cancer.2 Consequently, when estimating potential population attributable risks of cancer associated with fruit and vegetable consumption, only cancer sites included in the "probable decreased risk" category were considered. These cancers represent less than 18% of all cancers diagnosed in Alberta in 2012.3
Population attributable risks for cancer associated with insufficient fruit and vegetable intake have previously been estimated for the United Kingdom4 and Australia.5 Given that fruit and vegetable consumption has benefits related to chronic disease risk beyond cancer and that it represents a modifiable risk factor, identifying the proportion of cancers in Alberta that are attributable to insufficient fruit and vegetable consumption could have important implications for cancer prevention initiatives. Thus, the purpose of this study was to estimate the proportion and absolute number of cancers in Alberta in 2012 that were attributable to insufficient fruit and vegetable consumption.
Methods
This manuscript is part of a series of exposure-specific manuscripts concerning the proportion of cancer attributable to modifiable lifestyle and environmental risk factors in the general population of Alberta. The methodologic framework for this series of manuscripts has been previously described.6
An adaptation of the method used by Parkin and Boyd4 was used to quantify the proportion of cancer in Alberta that can be attributed to insufficient consumption of fruits and vegetables. Details of this adaptation are described below. The 2007 report by the World Cancer Research Fund advises that a minimum of 5 servings (400 g) of nonstarchy fruits and vegetables should be consumed each day to protect against cancer.1 The 2007 guideline was used to estimate population attributable risks for Alberta.
Source of relative risk data
Using the method described by Parkin and Boyd,4 the excess relative risk (RR) for a decrease in 1 g of vegetable or fruit consumed was estimated by assuming a log-linear relationship in equation 1:
Equation 1: Risk per gram per day = ln(1/RRx)/x
where x is the exposure level (in grams per day) and RRx the RR for x grams per day. We selected RRs from published reports by international collaborative panels where available and from the peer-reviewed literature (Appendix 1, Supplementary Figure 1, available at www.cmajopen.ca/content/4/4/E760/suppl/DC1).
As has been previously described,6 the theoretical latency period was conceptualized as the time between the start of exposure and cancer diagnosis, and the measured latency period was conceptualized as the time between exposure measurement and cancer diagnosis. For the analyses related to fruit and vegetable consumption described here, we conceptualize this latency period as the time between a measurement of the prevalence of insufficient fruit and vegetable consumption and cancer diagnoses that could theoretically be attributable to low fruit and vegetable intake. We endeavoured to quantify the measured latency period for each individual cancer site on the basis of follow-up periods from high quality cohort studies1,7-22 and refer to this simply as the latency period for simplicity. As previously described,6 the midpoint of the latency period suggested by cohort studies was chosen.
Assessment of fruit and vegetable intake
Fruit and vegetable consumption in Alberta was estimated from data from the Alberta sampling portion of the Canadian Community Health Survey (CCHS), a population survey conducted by Statistics Canada. In Alberta, the CCHS is considered representative of the general Canadian population excluding people living on reserves or other Aboriginal settlements, full-time members of the Canadian Forces and people in institutions. Total vegetable consumption was estimated by combining the number of times respondents reported consuming green salad, carrots, and other vegetables not including salad, carrots or potatoes. Total fruit consumption was estimated as the number of times respondents reported consuming fruit and fruit juice. For juice specifically, any reported frequency of consumption of fruit juice was equivalent to one serving of fruit, as suggested in previous work.1,23 Specific questions from the CCHS used to assess fruit and vegetable consumption are shown in Appendix 1, Supplementary Table 1. For both fruit and vegetable consumption, each reported "time" of consumption in the CCHS data was estimated as 1 serving.
The deficit in fruit and vegetable consumption relative to the 5 servings (400 g) per day recommended by the World Cancer Research Fund was calculated using a similar method to that used by Parkin and Boyd.4 First, the mean number of servings of fruits and vegetables consumed by men and women in each of 4 age groups (20-34, 35-49, 50-64, 65+) was estimated for each year of survey data used in this analysis. The ratio between fruit and vegetable consumption in these groups was then used to partition the 5 servings suggested as necessary for cancer prevention by the World Cancer Research Fund guideline to preserve the vegetable:fruit ratios seen in the prevalence data. The ratio between the World Cancer Research Fund guideline of 5 servings of fruits and vegetables and the total number of servings of fruits and vegetables consumed within each age group and sex (calculated by summing the mean totals for fruits and vegetables) was calculated. The mean consumption for fruits and vegetables was then multiplied by this ratio to calculate the level of consumption of each that would be consistent with the guideline level. These values were converted into grams by multiplying the number of servings by 80 g per serving, consistent with the guideline, where 5 servings is equivalent to 400 g.
Combined fruit and vegetable consumption was then classified into 7 categories based on the total number of servings reported to be consumed per day (0, < 1, < 2, < 3, < 4, < 5, ≥ 5). The proportion of the population in each category within each age and sex group was estimated, and the deficit in grams from the level of consumption for each of fruits and vegetables was estimated by subtracting the mean level of consumption in grams within each consumption category from the guideline amount.
Statistical analyses
Population attributable risks associated with fruit and vegetable consumption were estimated individually for each of the following cancers using the method described by Parkin and Boyd4: oral cavity and pharynx, esophagus, stomach, larynx and lung (fruit only). Relative risks were calculated for fruit and vegetable consumption separately using equation 2:
Equation 2: RR = exp(Rg × Gx)
where Rg represents the RR for a deficit of 1 g per day of fruit or vegetable consumption and Gx represents the deficit in consumption for consumption category x. The benefits of fruit and vegetable consumption were considered multiplicative so that:
Equation 3: RR(f and v) = RR(f) × RR(v)
These combined RR estimates were then used to estimate population attributable risks according to the formula:
Equation 4: PAR = [(p1 × ERR1) + (p2 × ERR2) + (p3 × ERR3) + (p4 × ERR4) + (p5 × ERR5) + (p6 × ERR6) + (p7 × ERR7)] / {1 + [(p1 × ERR1) + (p2 × ERR2) + (p3 × ERR3) + (p4 × ERR4) + (p5 × ERR5) + (p6 × ERR6) + (p7 × ERR7)]}
where px is the proportion of the population within consumption category x and ERRx is the excess RR, calculated as 1 - RR(f and v), within consumption category x. To estimate the total number of cancers at each site overall and by age-group and sex that were attributable to insufficient fruit and vegetable consumption, population attributable risks were applied to cancer incidence data obtained from the Alberta Cancer Registry for 2012. The total proportion of cancer attributable to insufficient fruit and vegetable intake at each individual cancer site was estimated as the total number of excess attributable cases for that cancer across all age groups divided by the total number of observed cancers at that site for both men and women, individually and combined.
Monte Carlo methods were used to estimate 95% confidence intervals (CIs) around point estimates of population attributable risk.24 Prevalence and risk estimates and their associated confidence intervals were used to parameterize a probability distribution from which 10 000 random samples were drawn. A binomial probability distribution was assumed for the prevalence exposure, a lognormal distribution for risk, and a Poisson distribution for cancer incidence. The 95% CIs were then determined by the 2.5th and 97.5th percentiles of the distribution of simulated population attributable risk and estimates of excess attributable cases. Similar techniques were used by 2 previous studies that estimated population attributable risk.24,25 All analyses were conducted using RStudio (version 0.98.1080, R Studio, Inc.).
Results
The RRs and their original units, in addition to the source, estimated risk per gram per day and chosen latency period, are summarized in Table 1.1,20,26 The mean number of servings of fruits and vegetables consumed by men and women in each of 4 age groups (20-34, 35-49, 50-64, 65+) was estimated for each year of survey data used in this analysis is shown in Table 2. The guideline levels of fruit and vegetable consumption in grams are shown in Table 3. The full set of tables for all years of CCHS data used in this analysis is shown in Appendix 1.
Prevalence of insufficient fruit and vegetable consumption
In the 2007/2008 CCHS data, the proportion of men who reported insufficient fruit and vegetable consumption (< 5 servings per day) ranged from 69.6% to 74.1%; among women, these proportions were lower, ranging from 48.5% to 53.2% (Figure 1). The proportions of participants who did not meet the cancer prevention guidelines for fruit and vegetable intake for all survey years are shown in Appendix 1. The 2007/2008 proportions are somewhat lower than in the 2003 CCHS data (the other most commonly used survey year), where the proportions of respondents not meeting the fruit and vegetable intake guideline were 68.0%-80.3% among men and 52.0%-60.5% among women. Proportions for other CCHS years are also within these ranges (Appendix 1).

Prevalence of sufficient (> 5 servings) and insufficient (≤ 5 servings) fruit and vegetable consumption in Alberta in 2007, by age and sex.
Estimated population attributable risk of cancer
Estimated population attributable risks of cancer due to insufficient fruit and vegetable consumption and corresponding 95% CIs are shown in Table 4 for each cancer site. When comparing across cancer sites, population attributable risks were estimated to be highest for esophageal cancer for both men and women (men, 39.4%-48.2%, < 67 cases overall; women, 29%- 33.9%, < 15 cases overall) and lowest for lung cancer (men, 3.1%-5.6%, 39 cases overall; women, 2.5%-3.1%, 25 cases overall). For the most part, estimates decreased slightly with age and were generally lower among women than among men. Overall, 290 cases of cancer in Alberta in 2012 were estimated to be attributable to insufficient consumption of fruits and vegetables (Table 5).
Interpretation
In Alberta, 290 cases of cancer diagnosed in 2012 were estimated to be attributable to insufficient fruit and vegetable consumption. This translates to about 10% of cancers at associated sites and just under 2% of all cancers diagnosed in the province in 2012.
Similar to our analyses, using data from a population-based survey to characterize fruit and vegetable intake, Parkin and Boyd estimated that 4.7% of all cancers in the UK in 2010 were attributable to insufficient fruit and vegetable intake.4 However, the prevalence of insufficient consumption (< 5 servings/d) in the UK was substantially higher than in Alberta (e.g., UK men aged 50-64 years 76%, women 88%; Alberta men aged 50-64 70%, women 50%).4 These differences could be due to real differences in dietary patterns, but could also be partially attributable to the method used by the CCHS to measure fruit and vegetable consumption. The CCHS asks participants how many "times" per day they consume each type of fruit and vegetable, whereas the UK's survey data quantified consumption in grams per week and the number of "portions" consumed per day.4 If the reported number of times per day a person consumes fruits and vegetables is a poor estimate of the number of servings (i.e., if 1 occurrence is less than 1 serving), then the CCHS data could have overestimated fruit and vegetable consumption in Alberta, which could partially explain why our estimates of the proportion of cancers attributable to insufficient fruit and vegetable consumption are lower.4 There were also slight differences in the RR estimates used in our analysis compared with those used by Parkin and Boyd,4 which may have also contributed to differences in population attributable risks.
Recent Australian analyses, which used similar methods but different estimates of RR, estimated population attributable risks for insufficient fruit and nonstarchy vegetable consumption separately.5 Insufficient fruit intake was found to account for 1.6% of all cancers and insufficient vegetable consumption for 0.3% of all cancers in Australia. Together, these results are similar to those we found for Alberta, with just under 2% of cancers in Australia estimated to be attributable to insufficient fruit and vegetable consumption combined. In addition, in an analysis conducted as part of the 2000 Global Burden of Disease project, the potential reductions in disease attributable to stomach and esophageal cancer were 19% and 20%, respectively, whereas the reductions for lung and colorectal cancer were 12% and 2%.27 Although these estimates are similar to our estimate for stomach cancer, our estimate for is much lower for lung cancer (3.3%) and much higher for esophageal cancer (40.0%). However, our analysis was specifically focused on the burden of cancer incidence, whereas the Global Burden of Disease analysis quantified the population attributable fractions as a percentage of disability-adjusted life years for each cause.27
Limitations
Although a strength of our analysis was the use of 95% CIs to quantify the precision of population attributable risk estimates, the width of these CIs suggests that our results are somewhat limited by a lack of precision. We estimate an excess 290 cancer cases are attributable to insufficient fruit and vegetable consumption, but this estimate could be as low as 98 excess cases or as high as 503.
Furthermore, our estimate that 1.8% of cancers in Alberta could be attributed to insufficient fruit and vegetable consumption assumes that the association between fruit and vegetable consumption and cancer risk represents a causal relationship. As noted in the introduction, evidence for the protective effect of fruit and vegetable consumption related to cancers of the oral cavity and pharynx, larnynx, esophagus, lung (fruit only) and stomach has been classified as "probable.1" Several potential anticancer mechanisms for fruit and vegetable consumption have been suggested, including antioxidant effects, increasing the activity of enzymes that can detoxify carcinogens, actions of micronutrients, preventing nutrient deficiencies and overall stimulation of the immune system.1,2,28 However, recent reviews suggest that the evidence of this protective effect is stronger in case-control than in cohort studies.1,2 Thus, the observed relationship could be due to residual confounding by other established risk factors, such as smoking and alcohol consumption.2 Therefore, our estimates should be interpreted with caution because, if the true size of associations between fruit and vegetable consumption and individual cancer sites has been overestimated, our population attributable risk estimates would be similarly overestimated.
Conclusion
Consumption of fruits and vegetables represents a modifiable risk factor, and increased consumption has the potential to affect a number of health conditions in addition to cancer. Because this study estimates that close to 2% of cancers in Alberta can be attributed to insufficient fruit and vegetable intake, strategies aimed at increasing levels of consumption have the potential to both reduce Alberta's cancer burden and to improve overall population health.
Supplemental information
For reviewer comments and the original submission of this manuscript, please see www.cmajopen.ca/content/4/4/E760/suppl/DC1. See also www.cmajopen.ca/lookup/doi/10.9778/cmajo.20150068
Figures and Tables
Acknowledgements
This project was funded by the Alberta Cancer Prevention Legacy Fund. Dr Christine Friedenreich is supported by an Alberta Innovates-Health Solutions Health Senior Scholar Award and the Alberta Cancer Foundation Weekend to End Women's Cancers Breast Cancer Chair at the University of Calgary. Dr. Darren Brenner is supported by a Capacity Development Award in Cancer Prevention (703917) from the Canadian Cancer Society Research Institute. The authors gratefully acknowledge Dr. Laura McDougall from the Alberta Cancer Prevention Legacy Fund for her support and guidance. The authors also thank Bethany Kaposhi and Lorraine Shack from the Alberta Cancer Registry for providing cancer incidence data, the department of Data Integration, Measurement and Reporting at Alberta Health Services for access to CCHS data.
Footnotes
Competing interests: None declared.
Contributors: Christine Friedenreich and Darren Brenner were responsible for the study conception. Anne Grundy, Christine Friedenreich, Darren Brenner, Farah Khandwala and Abbey Poirier contributed substantially to the study design and interpretation of the data. Farah Khandwala completed the analysis. Alison McFadden and Anne Grundy were responsible for acquisition of the data Abbey Poirier, Anne Grundy, Christine Friedenreich, Farah Khandwala, Alison McFadden and Darren Brenner prepared the manuscript, gave final approval of this version to be published and agreed to be guarantors of the work.
References
- Copyright 2016, Joule Inc. or its licensors
In this issue

Article tools


Related Articles
Cited By...
- No citing articles found.