


Abstract
Background: The mix of care provided by family physicians, specialists and palliative care physicians can vary by the illnesses leading to death, which may result in disruptions of continuity of care at the end of life. We measured continuity of outpatient physician care in the last year of life across differing causes of death and assessed factors associated with higher continuity.
Methods: We conducted a retrospective descriptive study of adults who died in Ontario between 2013 and 2018, using linked provincial health administrative data. We calculated 3 measures of continuity (usual provider, Bice–Boxerman and sequential continuity), which range from 0 to 1, from outpatient physician visits over the last year of life for terminal illness, organ failure, frailty, sudden death and other causes of death. We used multivariable logistic regression models to evaluate associations between characteristics and a continuity score of 0.5 or greater.
Results: Among the 417 628 decedents, we found that mean usual provider, Bice–Boxerman and sequential continuity indices were 0.37, 0.30 and 0.37, respectively, with continuity being the lowest for those with terminal illness (0.27, 0.23 and 0.33, respectively). Higher number of comorbidities, higher neighbourhood income quintile and all non-sudden death categories were associated with lower continuity.
Interpretation: We found that continuity of physician care in the last year of life was low, especially in those with cancer. Further research is needed to validate measures of continuity against end-of-life health care outcomes.
The population in many countries is aging and increasing numbers of people require health care for at least 1 progressive life-limiting illness, with needs escalating in the last year of life.1–4 Despite having more frequent transitions between settings,5–7 most people spend most of their time at home or in a home-like setting, receiving health care primarily as outpatients.7,8 Good care in the community near the end of life might include involvement of specialist physicians to care for specific diseases (e.g., oncologists for cancer, respirologists for complex chronic obstructive pulmonary disease or cardiologists for heart failure) alongside a family physician or palliative care specialist, to address symptoms and quality of life.9,10
High-quality end-of-life care has been prioritized in Canada,9,11 necessitating the investigation of health care measures that are useful as performance indicators.
Continuity of care is 1 aspect of quality and has been defined as “the degree to which a series of discrete health care events is experienced as coherent and connected and consistent with the patient’s medical needs and personal context.”12 Some studies have found that in patients with cancer, continuity with the usual primary care provider is associated with reductions in acute care near the end of life.13–15 Several physicians may be involved in care near the end of life (e.g., palliative care physicians to treat symptoms, disease specialists to treat the life-limiting illness(es) and primary care to manage comorbidities).16–18 Beyond the usual provider relationship,19 there are other measures that reflect concentration of care among providers (e.g., Bice–Boxerman continuity of care [CoC] index20) and alternation between providers (e.g., sequential continuity index21). We sought to understand the extent of continuity of care received by patients near the end of life and whether continuity differs between cancer and other causes of death. We aimed to describe continuity of outpatient physician care in the last year of life for differing causes of death and assess factors associated with higher continuity for the usual provider continuity (UPC) index,19 a Bice–Boxerman continuity index20 and the sequential continuity index.21
Methods
Study design and setting
We conducted a population-level retrospective descriptive study using data from linked health administrative databases in Ontario that are held at ICES (formerly known as the Institute for Clinical Evaluative Sciences) from 2013 to 2018. ICES is an independent, nonprofit research institute whose legal status under Ontario’s health information privacy law allows it to collect and analyze health care and demographic data, without consent, for health system evaluation and improvement. Data holdings at ICES include a comprehensive set of health care sectors in Ontario, which has a population of more than 14 million residents with mostly universal health care coverage for physician and hospital services.
Data sources
We used the following data sources: physician billing claims to the Ontario Health Insurance Plan (OHIP), the Ontario Registered Persons Database (RPDB), the Ontario Registrar General — Deaths database (ORGD), the Client Agency Program Enrolment (CAPE) data and validated disease-specific cohorts derived by ICES (Appendix 1, available at www.cmajopen.ca/content/10/4/E971/suppl/DC1, provides a description of the databases). Data sets were linked using unique encoded identifiers and analyzed at ICES.
Study cohort
The cohort comprised all patients 19 years of age or older who died between Jan. 1, 2013, and Dec. 31, 2018. We excluded patients who were older than 105 years at death (in case of administrative error), who were ineligible for insured health services at any point in the last year of life, who had an address outside of Ontario at the time of death or who had no administrative data (i.e., no health care use) in the 5 years before death. Other exclusion criteria were living in a long-term care home at any time in the last year of life, having fewer than 2 outpatient physician encounters in the last year of life (to enable calculation of continuity) or having no cause of death listed (to determine patients’ cause-of-death category).
Outcomes
Continuity of care measures typically apply to physician care because it can be measured using routinely collected health administrative data.22,23 We used outpatient physician encounters from physician billing claims to the OHIP database over the last 12 months of life, which included unique identifiers for the physician and their specialty, to calculate 3 indices (formulas for calculations can be found in Appendix 2, available at www.cmajopen.ca/content/10/4/E971/suppl/DC1). Physicians paid through alternative funding arrangements, such as capitation, submit “shadow billings” to the provincial governments. Shadow billings use the same physician billing claims from the OHIP for the purpose of documenting health services provided throughout the province.
The UPC index is a measure of the proportion of ambulatory physician encounters (between 0% and 100%) that occur with the usual provider, among all ambulatory physician visits in a given time period.19,24 The index reaches a maximum value of 1 when all encounters are with the usual provider and a minimum value of 0 when all encounters are with different providers. To determine the usual provider physician, we first identified the patients’ rostered primary care physician in the CAPE data set. For patients who were not rostered, the usual provider was the physician with the highest proportion of encounters in the last year of life.
The Bice–Boxerman CoC index measures the extent of dispersion of care across different health care providers. The index reaches a maximum value of 1 when all encounters are with the same provider and a minimum value of 0 when all encounters are to different providers.20 It accounts for the increasing number of visits with increasing numbers of physicians. It can be used to measure continuity within a specific specialty (e.g., usual family physician among all family physicians involved) or across different specialties.
The sequential continuity (SECON) index is the fraction of sequential encounter pairs at which the same provider is seen.21 It ranges from 0 to 1.0. The index considers both the number of providers and the number of consecutive encounters with each provider. A patient who has all encounters with the same provider will have a score of 1.
We identified sociodemographic characteristics and comorbidities for included patients. We obtained age at time of death and sex from the RPDB. We assigned neighbourhood-level income and rurality based on the patient’s postal code from the RPDB at 1 year before death, linked through a Postal Code Conversion File to 2011 Canadian Census data. We looked back 5 years from the date of death to determine prevalent comorbidities, using previously developed algorithms that use diagnosis codes and medication data to assign conditions.25–34
We assigned the cause of death category (also known as dying trajectories in past literature)35 to each patient who had died according to major categories of functional decline at the end of life. They were defined by main cause of death as per previous research1,36,37 and validated in Canada.2,38 These categories included terminal illness (e.g., cancer), organ failure (e.g., chronic heart failure), frailty (e.g., Alzheimer disease), sudden death (i.e., unanticipated events such as accidents) and other causes. Codes for cause-of-death information used in the algorithm was captured through the ORGD, which includes the exclusive primary cause of death documented on the death certificate.
Statistical analysis
We presented descriptive results as percentages for categorical variables, and as mean and standard deviation (SD) or median (with interquartile range [IQR] for variables with skewed distribution) for continuous variables. For sociodemographic and health-related factors, we evaluated age category, sex, rural residence, terciles of the number of prevalent conditions and quintiles of the number of outpatient physician encounters in the last 12 months of life.
We created histograms of indices and calculated means, SDs, medians and IQRs for the overall cohort and each cause-of-death category. We conducted a multivariable logistic regression to evaluate decedent and contextual factors associated with having greater than 0.50 continuity of care. We included all prespecified variables in the model and excluded anyone with missing data. We chose this cut-off because it represents moderate continuity and is based on the distribution of the indices in our study, which indicated that few decedents had higher continuity, based on previous research for the context of routine primary care.39–43 We calculated odds ratios (ORs) and 95% confidence intervals (CIs) for the odds of the index score being 0.5 or higher.
As a sensitivity analysis, we also conducted linear regressions using the full scale. Variables evaluated for association with continuity included age group (reference group 19–44 yr), sex (reference group female), rural versus urban residence (reference group urban), neighbourhood income quintile (reference group lowest quintile), cause-of-death category (reference group frailty), comorbidity status (reference group lowest empirical tercile) and quintile of the volume of physician outpatient encounters (reference group lowest quintile). Parameter estimates and robust standard errors were produced for the sensitivity analyses.
We considered a p value of less than 0.05 as statistically significant (2-tailed). We conducted our analysis using SAS Enterprise Guide version 7.15.
Ethics approval
The use of data in this project were authorized under section 45 of Ontario’s Personal Health Information Protection Act, which does not require review by a research ethics board.
Results
From Jan. 1, 2013, to Dec. 31, 2018, there were 589 977 patients who died; we included 417 628 in the cohort for analysis after applying exclusion criteria (Figure 1). The mean age of these patients was 74.9 (SD 14.7) years and 46.1% were female (Table 1). We found that about one-third of the patients who died were in the terminal illness (36.0%) or organ failure (33.1%) categories of causes of death, followed by frailty (19.8%), sudden death (5.2%) and other (5.9%) categories.

Flow chart for the creation of the cohort. Note: OHIP = Ontario Health Insurance Plan, ORGD = Ontario Registrar General — Deaths database.
Profile of patients aged 19 years or older who died between Jan. 1, 2013, and Dec. 31, 2018, in Ontario (excluding residents in long-term care and patients with less than the 2 outpatient encounters in the last year of life required to calculate continuity-of-care indices)
Patients who died had a mean of 17.6 (median 14) outpatient physician encounters in the last year of life. The 3 most common diagnosis codes for encounters were bronchus, lung (435 244 encounters), female breast (166 000 encounters) and other malignant neoplasms (159 445 encounters). The list of the top 20 most common diagnosis codes for physician encounters by cause-of-death category is found in Appendix 3, available at www.cmajopen.ca/content/10/4/E971/suppl/DC1. Figure 2 shows the means and distributions of each CoC measure for each cause-of-death category. The overall mean UPC, CoC and SECON indices were 0.37, 0.30 and 0.37 (median 0.32), respectively (Figure 2). Those patients with frailty (mean 0.44, 0.37 and 0.40, respectively) or sudden death (mean 0.44, 0.37 and 0.41, respectively) causes of death experienced higher continuity. Patients in the terminal illness category experienced the lowest continuity for UPC, CoC and SECON (mean 0.22, 0.23 and 0.33, respectively).
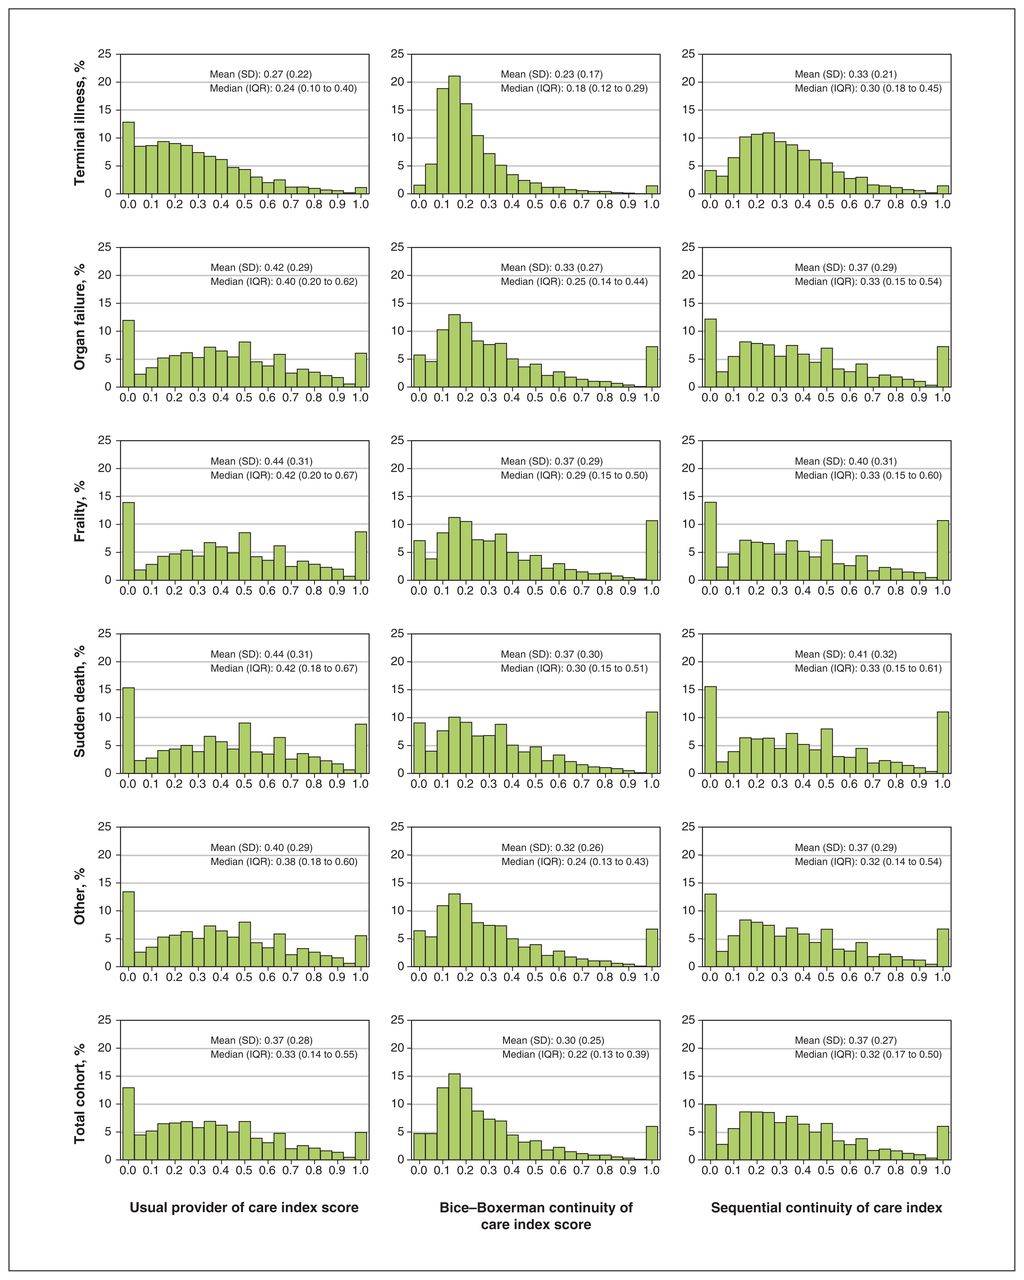
Distribution of outpatient physician continuity of care in the last 12 months of life among patients who died in Ontario from 2013 to 2018 (n = 417 627).
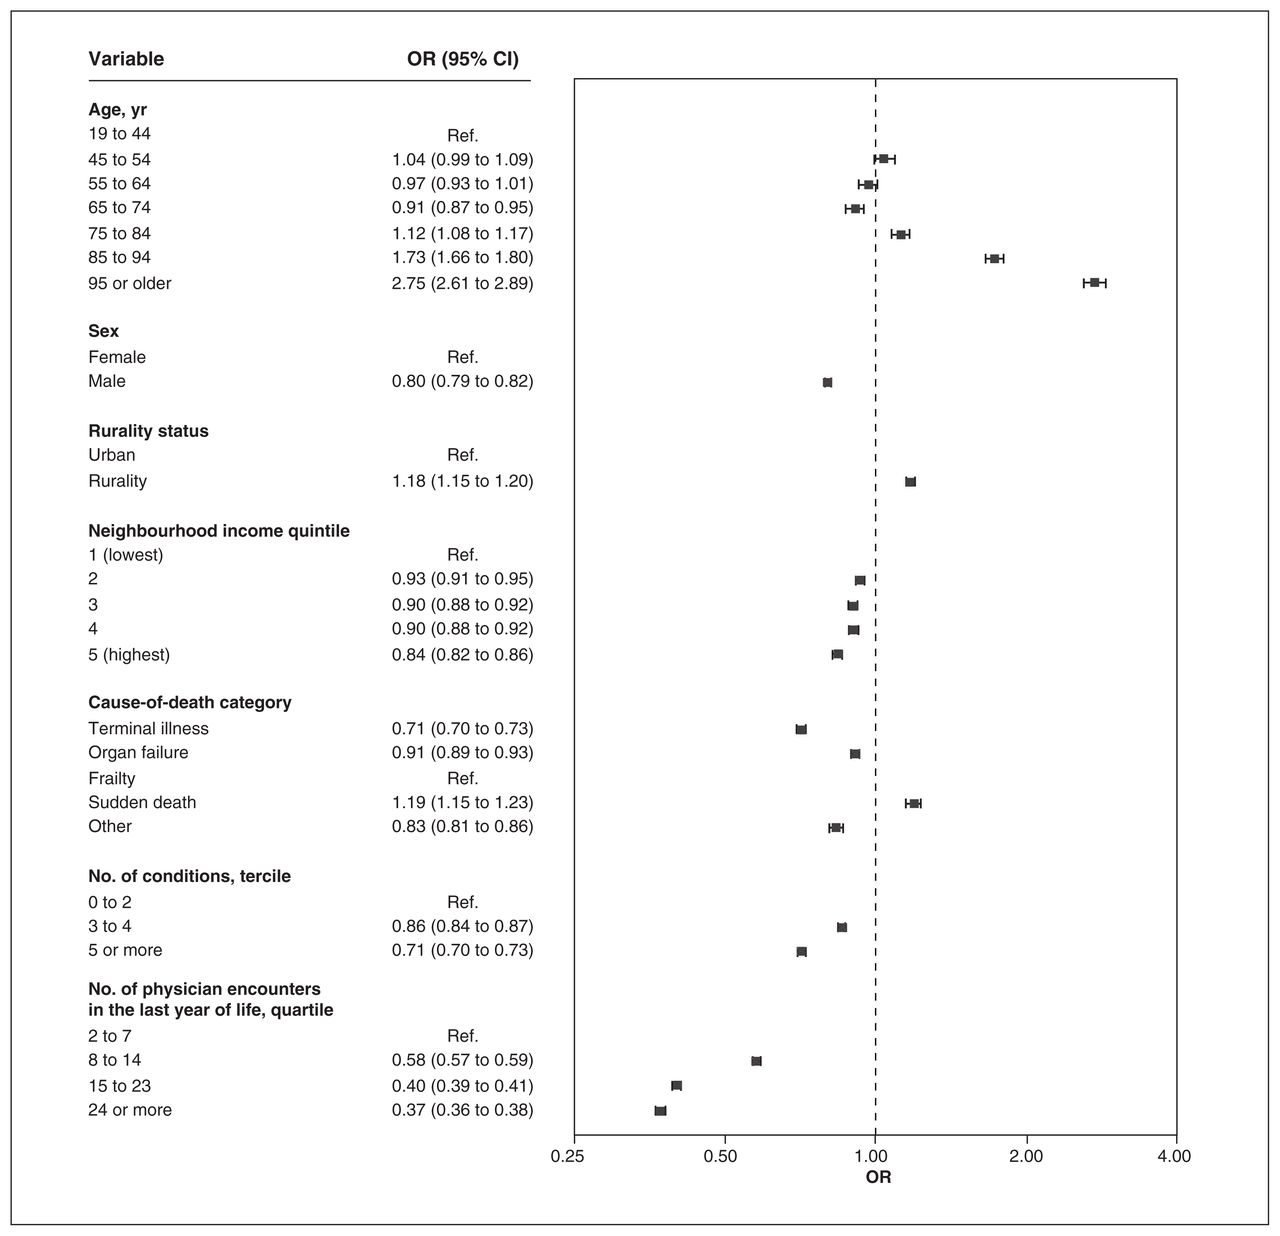
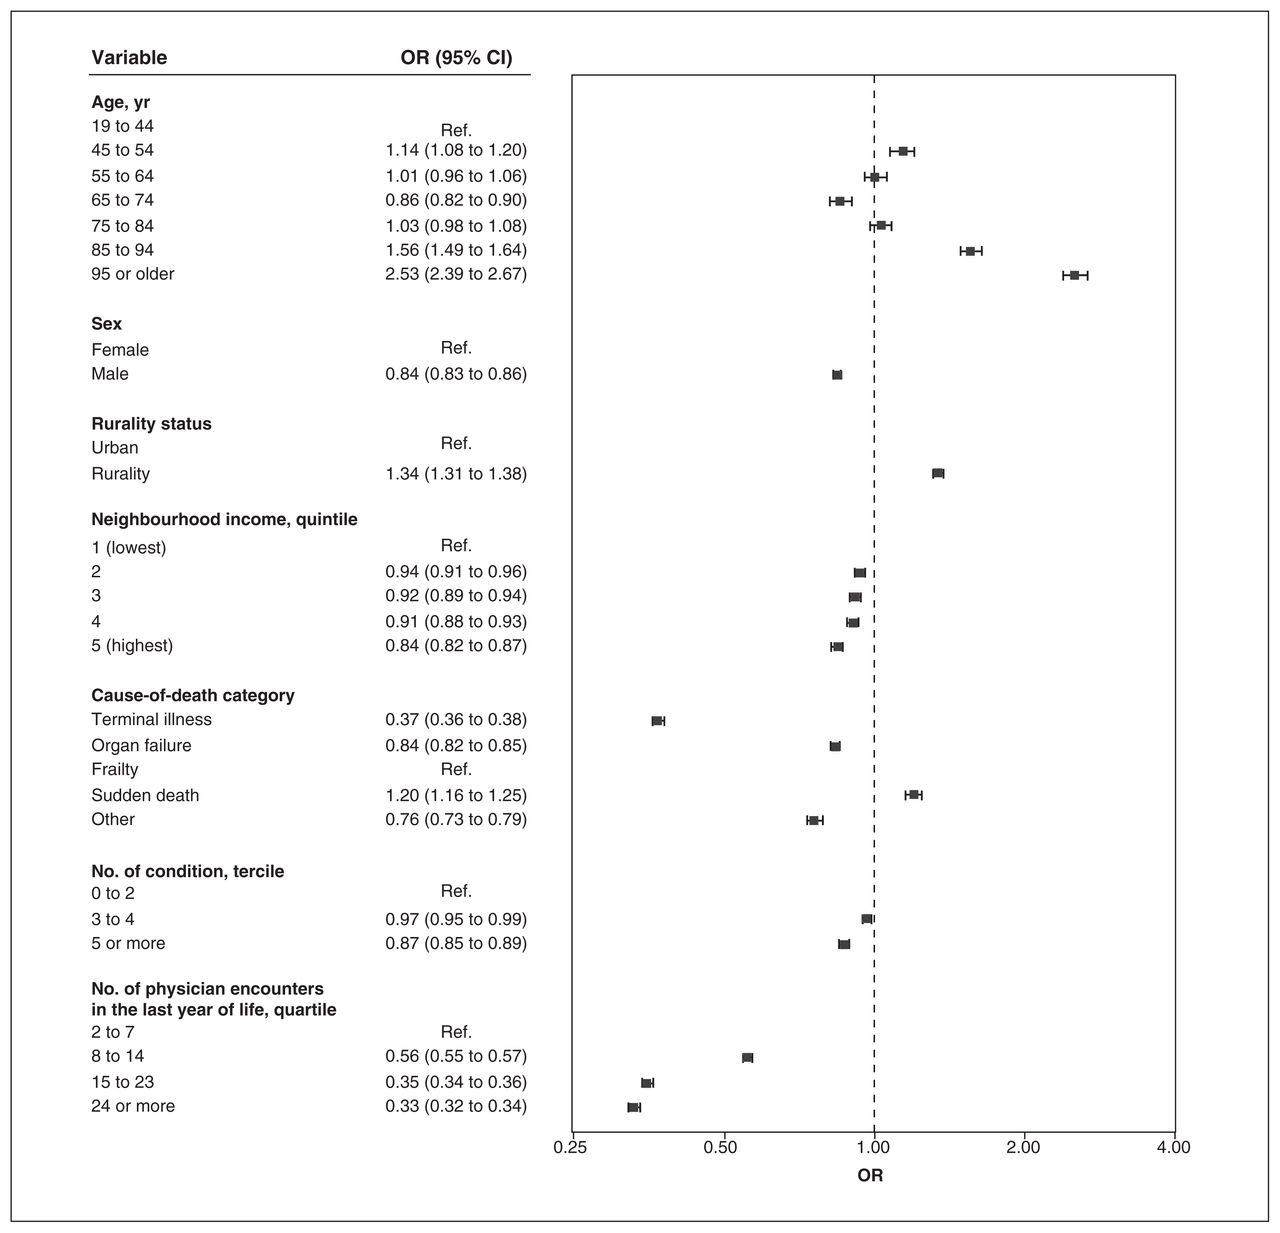
The proportion of patients who died with continuity of 0.50 or more was 33.1%, 17.5% and 29.6% for UPC, CoC and SECON, respectively. For all indices, we found that there was a negative association between the cause-of-death categories cancer and organ failure and higher continuity than with the frailty category, and a positive association for sudden death causes, after controlling for the number of encounters (Figure 3, Figure 4, Figure 5). Odds ratios were the lowest for the terminal illness category for UPC (OR 0.45, 95% CI 0.44 to 0.46), CoC (OR 0.37, 95% CI 0.36 to 0.38) and SECON (OR 0.71, 95% CI 0.70 to 0.73) indices. There was a significant association between having 5 or more prevalent conditions and lower continuity for the CoC (OR 0.87, 95% CI 0.85 to 0.89) and SECON (OR 0.71, 95% CI 0.70 to 0.73) indices but not for UPC (OR 1.00, 95% CI 0.98 to 1.02). For each age category above 64 years, we found that the ORs were greater than 1 and increased consistently for all indices. Rural residence was associated with higher continuity for all indices.

Multivariable associations between characteristics of patients who died in Ontario from 2013 to 2018 and higher scores of usual provider continuity of care (≥ 0.50) (n = 416 026). Note: CI = confidence interval, OR = odds ratio, Ref. = reference category.

Multivariable associations between characteristics of patients who died in Ontario from 2013 to 2018 and higher scores of Bice–Boxerman continuity of care (≥ 0.50) (n = 416 026). Note: CI = confidence interval, OR = odds ratio, Ref. = reference category.
Multivariable associations between characteristics of patients who died in Ontario from 2013 to 2018 and higher scores of sequential continuity of care (≥ 0.50) (n = 416 026). Note: CI = confidence interval, OR = odds ratio, Ref. = reference category.
The results of the linear regression models (coefficients on the scale of 0 to 1) aligned with the logistic regression models. When compared with the frailty category, terminal illness was negatively associated with UPC (−0.096, 95% CI −0.099 to −0.094), CoC (−0.087, 95% CI −0.089 to −0.084) and SECON (−0.035, 95% CI −0.038 to −0.033). Having more prevalent conditions continued to be negatively associated with continuity, whereas rural residence and older age categories continued to be positively associated with continuity (Appendix 4, available at www.cmajopen.ca/content/10/4/E971/suppl/DC1).
Interpretation
In our assessment of continuity of care using outpatient physician encounters in the last year of life, mean continuity was low. We found that the 3 measures of continuity were generally similar, with sequential continuity being slightly lower on average than the usual provider continuity and the Bice–Boxerman continuity indices. The lower sequential continuity may reflect a tendency for alternating encounters between specialists managing the terminal illness and ongoing primary care. Continuity varied by cause of death and was lowest for patients in the terminal illness cause-of-death category across all 3 continuity measures. Those who were 85 years of age and older and those with a rural residence were more likely to have higher continuity as measured by all 3 indices.
The result of low continuity may not be surprising, given that closer to the end of life, patients may have exacerbations of the diseases contributing to their death. Only one-third of patients who died had more than half of their physician encounters with their usual family physician in the last year of life. More physicians may become involved in managing the disease itself, whereas palliative care or family physician encounters are driven by symptom management. It is well documented that active disease management often continues until close to the end of life in patients with progressive life-limiting illnesses.44–46
High-quality palliative care in Canada has been developed largely in response to the end-of-life trajectory of cancer. 35,47,48 Therefore, it was surprising to find that continuity, considered an indicator of quality care, was lowest among those with a cancer cause of death. High-quality palliative care may not be contingent on care being provided by the same person, and other important aspects of continuity, such as information and management related, may be achieved through a team approach to palliative care that is not reflected in current continuity indices.
In addition to the association between continuity and a cancer cause of death, continuity was also associated with demographic characteristics. We found that living in a rural area and older age were associated with higher continuity. Compared with the Ontario population in 2019,49 our study population had a higher percentage who were male (53.9% v. 49.1%), higher percentages in lower neighbourhood income quintiles (lowest to highest: 24.9%, 22.1%, 19.2%, 17.0%, 16.5% v. 19.6%, 19.6%, 20.1%, 20.2%, 20.2%) and more patients who were from a rural region (13.1% v. 8.2%). The relative lack of access to palliative care physicians and other specialists such as geriatricians in rural areas than in urban areas50–52 may decrease the likelihood of receiving care from different physicians in outpatient settings. Previous research has shown care by family physicians increases relative to specialists with advancing age and comorbidities,25 and family physicians may also implement a palliative approach themselves rather than referring to a palliative care specialist, which may partially explain the greater continuity in older patients who died.
Limitations
We did not account for disruptions in continuity caused by transitioning in and out of hospital, which may lead to new consultations in outpatient settings. The health administrative data included only encounters with physicians and, therefore, we could not identify models of team care at the end of life that included key roles for other professionals such as nurses and personal support workers, as continuity with these providers has been identified as an important factor in patients’ end-of-life experiences.5,18,53 We included only patients who died and who were never admitted to a long-term care home in the last year of life, because access to different physicians and, therefore, continuity, are determined mainly by the institution that contracts the physicians. Continuity may be higher in this group after entry to a long-term care home. We used data from Ontario (representing about 40% of the population of Canada) and health care systems are organized provincially; therefore, our results may not be generalizable in regions with different population demographics and health systems.
Conclusion
We found low continuity of care, especially for patients with a cancer cause of death, across 3 measures that capture different aspects of encounter patterns with physicians. Further research is needed to validate continuity-of-care measures within the end-of-life period, supporting their validity as indicators of system performance.
Acknowledgement
The authors thank IQVIA Solutions Canada Inc. for the use of its Drug Information File.
Footnotes
Competing interests: Peter Tanuseputro is supported by a PSI Graham Farquharson Knowledge Translation Fellowship. No other competing interests were declared.
This article has been peer reviewed.
Contributors: Michelle Howard, Sarina Isenberg, Peter Tanuseputro and Amy Tsu conceived the study. Ana Gayowsky analyzed the data. Michelle Howard wrote the manuscript. All of the authors designed the study, interpreted the results, revised the manuscript critically for important intellectual content, gave final approval of the version to be published and agreed to be accountable for all aspects of the work.
Funding: This study was funded by a grant from the Canadian Institutes of Health Research project no. 159771. This study was supported by ICES, which is funded by an annual grant from the Ontario Ministry of Health and Ministry of Long-Term Care. Peter Tanuseputro is supported by a PSI Graham Farquharson Knowledge Translation Fellowship. The funders had no role in study design, data collection and analysis, decision to publish or preparation of the manuscript.
Data sharing: The data set from this study is held securely in coded form at ICES. Although data-sharing agreements prohibit ICES from making the data set publicly available, access may be granted to those who meet prespecified criteria for confidential access, available at https://www.ices.on.ca/DAS. The full data set creation plan and underlying analytic code are available from the authors upon request, with the understanding that the computer programs may rely upon coding templates or macros that are unique to ICES and are therefore either inaccessible or may require modification.
Disclaimer: This study was supported by ICES, which is funded by an annual grant from the Ontario Ministry of Health (MOH) and Ministry of Long-Term Care (MLTC). Parts of this material are based on data and information compiled and provided by the Canadian Institute for Health Information, MOH and MLTC. The analyses, conclusions, opinions and statements expressed herein are solely those of the authors and do not reflect those of the funding or data sources; no endorsement is intended or should be inferred. Parts of this material are based on Ontario Registrar General information on deaths, the original source of which is Service Ontario. The views expressed therein are those of the authors and do not necessarily reflect those of Ontario Registrar General or Ministry of Government Services. Parts of this material are based on the Ontario Drug Benefit claims database.
Supplemental information: For reviewer comments and the original submission of this manuscript, please see www.cmajopen.ca/content/10/4/E971/suppl/DC1.
This is an Open Access article distributed in accordance with the terms of the Creative Commons Attribution (CC BY-NC-ND 4.0) licence, which permits use, distribution and reproduction in any medium, provided that the original publication is properly cited, the use is noncommercial (i.e., research or educational use), and no modifications or adaptations are made. See: https://creativecommons.org/licenses/by-nc-nd/4.0/
References
- © 2022 CMA Impact Inc. or its licensors
In this issue

Article tools


