
Main menu

  • Home
  • Content
    • Current issue
    • Past issues
    • Collections
  • Authors & Reviewers
    • Overview for Authors
    • Preparing manuscripts
    • Submission Checklist
    • Publication Fees
    • Forms
    • Editorial Policies
    • Editorial Process
    • Patient-Oriented Research
    • Submit a manuscript
    • Manuscript Progress
    • Submitting a letter
    • Information for Reviewers
    • Open access
  • Alerts
    • Email alerts
    • RSS
  • About
    • General information
    • Staff
    • Editorial board
    • Contact
  • CMAJ JOURNALS
    • CMAJ
    • CJS
    • JAMC
    • JPN

User menu

Search

  • Advanced search
CMAJ Open
  • CMAJ JOURNALS
    • CMAJ
    • CJS
    • JAMC
    • JPN
CMAJ Open

Advanced Search

  • Home
  • Content
    • Current issue
    • Past issues
    • Collections
  • Authors & Reviewers
    • Overview for Authors
    • Preparing manuscripts
    • Submission Checklist
    • Publication Fees
    • Forms
    • Editorial Policies
    • Editorial Process
    • Patient-Oriented Research
    • Submit a manuscript
    • Manuscript Progress
    • Submitting a letter
    • Information for Reviewers
    • Open access
  • Alerts
    • Email alerts
    • RSS
  • About
    • General information
    • Staff
    • Editorial board
    • Contact
  • Subscribe to our alerts
  • RSS feeds
  • Follow CMAJ Open on Twitter
Research
Open Access

Efficacy of a “stay-at-home” policy on SARS-CoV-2 transmission in Toronto, Canada: a mathematical modelling study

Pei Yuan, Juan Li, Elena Aruffo, Evgenia Gatov, Qi Li, Tingting Zheng, Nicholas H. Ogden, Beate Sander, Jane Heffernan, Sarah Collier, Yi Tan, Jun Li, Julien Arino, Jacques Bélair, James Watmough, Jude Dzevela Kong, Iain Moyles and Huaiping Zhu
April 19, 2022 10 (2) E367-E378; DOI: https://doi.org/10.9778/cmajo.20200242
Pei Yuan
Canadian Centre for Disease Modeling (Yuan, Juan Li, Aruffo, Q. Li, Zheng, Heffernan, Tan, Jun Li, Arino, Bélair, Watmough, Kong, Moyles, Zhu), and Department of Mathematics and Statistics (Yuan, Aruffo, Heffernan, Tan, Kong, Moyles, Zhu), York University, Toronto, Ont.; Complex Systems Research Center (Juan Li), Shanxi University, Taiyuan, Shanxi, China; Toronto Public Health (Gatov, Collier), City of Toronto, Toronto, Ont.; Department of Mathematics (Q. Li), Shanghai Normal University, Shanghai, China; College of Mathematics and System Science (Zheng), Xinjiang University, Urumqi, Xinjiang, China; Public Health Risk Sciences Division (Ogden), National Microbiology Laboratory, Public Health Agency of Canada, Sainte-Hyacinthe, Que.; Toronto Health Economics and Technology Assessment (THETA) Collaborative (Sander), University Health Network; Dalla Lana School of Public Health (Sander), University of Toronto, Toronto, Ont.; School of Mathematics and Statistics (Jun Li), Xidian University, Xi’an, Shaanxi, China; Department of Mathematics (Arino), University of Manitoba, Winnipeg, Man.; Département de mathématiques et de statistique (Bélair), Université de Montréal, Montréal, Que.; Department of Mathematics and Statistics (Watmough), University of New Brunswick, Fredericton, NB
  • Find this author on Google Scholar
  • Find this author on PubMed
  • Search for this author on this site
Juan Li
Canadian Centre for Disease Modeling (Yuan, Juan Li, Aruffo, Q. Li, Zheng, Heffernan, Tan, Jun Li, Arino, Bélair, Watmough, Kong, Moyles, Zhu), and Department of Mathematics and Statistics (Yuan, Aruffo, Heffernan, Tan, Kong, Moyles, Zhu), York University, Toronto, Ont.; Complex Systems Research Center (Juan Li), Shanxi University, Taiyuan, Shanxi, China; Toronto Public Health (Gatov, Collier), City of Toronto, Toronto, Ont.; Department of Mathematics (Q. Li), Shanghai Normal University, Shanghai, China; College of Mathematics and System Science (Zheng), Xinjiang University, Urumqi, Xinjiang, China; Public Health Risk Sciences Division (Ogden), National Microbiology Laboratory, Public Health Agency of Canada, Sainte-Hyacinthe, Que.; Toronto Health Economics and Technology Assessment (THETA) Collaborative (Sander), University Health Network; Dalla Lana School of Public Health (Sander), University of Toronto, Toronto, Ont.; School of Mathematics and Statistics (Jun Li), Xidian University, Xi’an, Shaanxi, China; Department of Mathematics (Arino), University of Manitoba, Winnipeg, Man.; Département de mathématiques et de statistique (Bélair), Université de Montréal, Montréal, Que.; Department of Mathematics and Statistics (Watmough), University of New Brunswick, Fredericton, NB
  • Find this author on Google Scholar
  • Find this author on PubMed
  • Search for this author on this site
Elena Aruffo
Canadian Centre for Disease Modeling (Yuan, Juan Li, Aruffo, Q. Li, Zheng, Heffernan, Tan, Jun Li, Arino, Bélair, Watmough, Kong, Moyles, Zhu), and Department of Mathematics and Statistics (Yuan, Aruffo, Heffernan, Tan, Kong, Moyles, Zhu), York University, Toronto, Ont.; Complex Systems Research Center (Juan Li), Shanxi University, Taiyuan, Shanxi, China; Toronto Public Health (Gatov, Collier), City of Toronto, Toronto, Ont.; Department of Mathematics (Q. Li), Shanghai Normal University, Shanghai, China; College of Mathematics and System Science (Zheng), Xinjiang University, Urumqi, Xinjiang, China; Public Health Risk Sciences Division (Ogden), National Microbiology Laboratory, Public Health Agency of Canada, Sainte-Hyacinthe, Que.; Toronto Health Economics and Technology Assessment (THETA) Collaborative (Sander), University Health Network; Dalla Lana School of Public Health (Sander), University of Toronto, Toronto, Ont.; School of Mathematics and Statistics (Jun Li), Xidian University, Xi’an, Shaanxi, China; Department of Mathematics (Arino), University of Manitoba, Winnipeg, Man.; Département de mathématiques et de statistique (Bélair), Université de Montréal, Montréal, Que.; Department of Mathematics and Statistics (Watmough), University of New Brunswick, Fredericton, NB
  • Find this author on Google Scholar
  • Find this author on PubMed
  • Search for this author on this site
Evgenia Gatov
Canadian Centre for Disease Modeling (Yuan, Juan Li, Aruffo, Q. Li, Zheng, Heffernan, Tan, Jun Li, Arino, Bélair, Watmough, Kong, Moyles, Zhu), and Department of Mathematics and Statistics (Yuan, Aruffo, Heffernan, Tan, Kong, Moyles, Zhu), York University, Toronto, Ont.; Complex Systems Research Center (Juan Li), Shanxi University, Taiyuan, Shanxi, China; Toronto Public Health (Gatov, Collier), City of Toronto, Toronto, Ont.; Department of Mathematics (Q. Li), Shanghai Normal University, Shanghai, China; College of Mathematics and System Science (Zheng), Xinjiang University, Urumqi, Xinjiang, China; Public Health Risk Sciences Division (Ogden), National Microbiology Laboratory, Public Health Agency of Canada, Sainte-Hyacinthe, Que.; Toronto Health Economics and Technology Assessment (THETA) Collaborative (Sander), University Health Network; Dalla Lana School of Public Health (Sander), University of Toronto, Toronto, Ont.; School of Mathematics and Statistics (Jun Li), Xidian University, Xi’an, Shaanxi, China; Department of Mathematics (Arino), University of Manitoba, Winnipeg, Man.; Département de mathématiques et de statistique (Bélair), Université de Montréal, Montréal, Que.; Department of Mathematics and Statistics (Watmough), University of New Brunswick, Fredericton, NB
  • Find this author on Google Scholar
  • Find this author on PubMed
  • Search for this author on this site
Qi Li
Canadian Centre for Disease Modeling (Yuan, Juan Li, Aruffo, Q. Li, Zheng, Heffernan, Tan, Jun Li, Arino, Bélair, Watmough, Kong, Moyles, Zhu), and Department of Mathematics and Statistics (Yuan, Aruffo, Heffernan, Tan, Kong, Moyles, Zhu), York University, Toronto, Ont.; Complex Systems Research Center (Juan Li), Shanxi University, Taiyuan, Shanxi, China; Toronto Public Health (Gatov, Collier), City of Toronto, Toronto, Ont.; Department of Mathematics (Q. Li), Shanghai Normal University, Shanghai, China; College of Mathematics and System Science (Zheng), Xinjiang University, Urumqi, Xinjiang, China; Public Health Risk Sciences Division (Ogden), National Microbiology Laboratory, Public Health Agency of Canada, Sainte-Hyacinthe, Que.; Toronto Health Economics and Technology Assessment (THETA) Collaborative (Sander), University Health Network; Dalla Lana School of Public Health (Sander), University of Toronto, Toronto, Ont.; School of Mathematics and Statistics (Jun Li), Xidian University, Xi’an, Shaanxi, China; Department of Mathematics (Arino), University of Manitoba, Winnipeg, Man.; Département de mathématiques et de statistique (Bélair), Université de Montréal, Montréal, Que.; Department of Mathematics and Statistics (Watmough), University of New Brunswick, Fredericton, NB
  • Find this author on Google Scholar
  • Find this author on PubMed
  • Search for this author on this site
Tingting Zheng
Canadian Centre for Disease Modeling (Yuan, Juan Li, Aruffo, Q. Li, Zheng, Heffernan, Tan, Jun Li, Arino, Bélair, Watmough, Kong, Moyles, Zhu), and Department of Mathematics and Statistics (Yuan, Aruffo, Heffernan, Tan, Kong, Moyles, Zhu), York University, Toronto, Ont.; Complex Systems Research Center (Juan Li), Shanxi University, Taiyuan, Shanxi, China; Toronto Public Health (Gatov, Collier), City of Toronto, Toronto, Ont.; Department of Mathematics (Q. Li), Shanghai Normal University, Shanghai, China; College of Mathematics and System Science (Zheng), Xinjiang University, Urumqi, Xinjiang, China; Public Health Risk Sciences Division (Ogden), National Microbiology Laboratory, Public Health Agency of Canada, Sainte-Hyacinthe, Que.; Toronto Health Economics and Technology Assessment (THETA) Collaborative (Sander), University Health Network; Dalla Lana School of Public Health (Sander), University of Toronto, Toronto, Ont.; School of Mathematics and Statistics (Jun Li), Xidian University, Xi’an, Shaanxi, China; Department of Mathematics (Arino), University of Manitoba, Winnipeg, Man.; Département de mathématiques et de statistique (Bélair), Université de Montréal, Montréal, Que.; Department of Mathematics and Statistics (Watmough), University of New Brunswick, Fredericton, NB
  • Find this author on Google Scholar
  • Find this author on PubMed
  • Search for this author on this site
Nicholas H. Ogden
Canadian Centre for Disease Modeling (Yuan, Juan Li, Aruffo, Q. Li, Zheng, Heffernan, Tan, Jun Li, Arino, Bélair, Watmough, Kong, Moyles, Zhu), and Department of Mathematics and Statistics (Yuan, Aruffo, Heffernan, Tan, Kong, Moyles, Zhu), York University, Toronto, Ont.; Complex Systems Research Center (Juan Li), Shanxi University, Taiyuan, Shanxi, China; Toronto Public Health (Gatov, Collier), City of Toronto, Toronto, Ont.; Department of Mathematics (Q. Li), Shanghai Normal University, Shanghai, China; College of Mathematics and System Science (Zheng), Xinjiang University, Urumqi, Xinjiang, China; Public Health Risk Sciences Division (Ogden), National Microbiology Laboratory, Public Health Agency of Canada, Sainte-Hyacinthe, Que.; Toronto Health Economics and Technology Assessment (THETA) Collaborative (Sander), University Health Network; Dalla Lana School of Public Health (Sander), University of Toronto, Toronto, Ont.; School of Mathematics and Statistics (Jun Li), Xidian University, Xi’an, Shaanxi, China; Department of Mathematics (Arino), University of Manitoba, Winnipeg, Man.; Département de mathématiques et de statistique (Bélair), Université de Montréal, Montréal, Que.; Department of Mathematics and Statistics (Watmough), University of New Brunswick, Fredericton, NB
  • Find this author on Google Scholar
  • Find this author on PubMed
  • Search for this author on this site
Beate Sander
Canadian Centre for Disease Modeling (Yuan, Juan Li, Aruffo, Q. Li, Zheng, Heffernan, Tan, Jun Li, Arino, Bélair, Watmough, Kong, Moyles, Zhu), and Department of Mathematics and Statistics (Yuan, Aruffo, Heffernan, Tan, Kong, Moyles, Zhu), York University, Toronto, Ont.; Complex Systems Research Center (Juan Li), Shanxi University, Taiyuan, Shanxi, China; Toronto Public Health (Gatov, Collier), City of Toronto, Toronto, Ont.; Department of Mathematics (Q. Li), Shanghai Normal University, Shanghai, China; College of Mathematics and System Science (Zheng), Xinjiang University, Urumqi, Xinjiang, China; Public Health Risk Sciences Division (Ogden), National Microbiology Laboratory, Public Health Agency of Canada, Sainte-Hyacinthe, Que.; Toronto Health Economics and Technology Assessment (THETA) Collaborative (Sander), University Health Network; Dalla Lana School of Public Health (Sander), University of Toronto, Toronto, Ont.; School of Mathematics and Statistics (Jun Li), Xidian University, Xi’an, Shaanxi, China; Department of Mathematics (Arino), University of Manitoba, Winnipeg, Man.; Département de mathématiques et de statistique (Bélair), Université de Montréal, Montréal, Que.; Department of Mathematics and Statistics (Watmough), University of New Brunswick, Fredericton, NB
  • Find this author on Google Scholar
  • Find this author on PubMed
  • Search for this author on this site
Jane Heffernan
Canadian Centre for Disease Modeling (Yuan, Juan Li, Aruffo, Q. Li, Zheng, Heffernan, Tan, Jun Li, Arino, Bélair, Watmough, Kong, Moyles, Zhu), and Department of Mathematics and Statistics (Yuan, Aruffo, Heffernan, Tan, Kong, Moyles, Zhu), York University, Toronto, Ont.; Complex Systems Research Center (Juan Li), Shanxi University, Taiyuan, Shanxi, China; Toronto Public Health (Gatov, Collier), City of Toronto, Toronto, Ont.; Department of Mathematics (Q. Li), Shanghai Normal University, Shanghai, China; College of Mathematics and System Science (Zheng), Xinjiang University, Urumqi, Xinjiang, China; Public Health Risk Sciences Division (Ogden), National Microbiology Laboratory, Public Health Agency of Canada, Sainte-Hyacinthe, Que.; Toronto Health Economics and Technology Assessment (THETA) Collaborative (Sander), University Health Network; Dalla Lana School of Public Health (Sander), University of Toronto, Toronto, Ont.; School of Mathematics and Statistics (Jun Li), Xidian University, Xi’an, Shaanxi, China; Department of Mathematics (Arino), University of Manitoba, Winnipeg, Man.; Département de mathématiques et de statistique (Bélair), Université de Montréal, Montréal, Que.; Department of Mathematics and Statistics (Watmough), University of New Brunswick, Fredericton, NB
  • Find this author on Google Scholar
  • Find this author on PubMed
  • Search for this author on this site
Sarah Collier
Canadian Centre for Disease Modeling (Yuan, Juan Li, Aruffo, Q. Li, Zheng, Heffernan, Tan, Jun Li, Arino, Bélair, Watmough, Kong, Moyles, Zhu), and Department of Mathematics and Statistics (Yuan, Aruffo, Heffernan, Tan, Kong, Moyles, Zhu), York University, Toronto, Ont.; Complex Systems Research Center (Juan Li), Shanxi University, Taiyuan, Shanxi, China; Toronto Public Health (Gatov, Collier), City of Toronto, Toronto, Ont.; Department of Mathematics (Q. Li), Shanghai Normal University, Shanghai, China; College of Mathematics and System Science (Zheng), Xinjiang University, Urumqi, Xinjiang, China; Public Health Risk Sciences Division (Ogden), National Microbiology Laboratory, Public Health Agency of Canada, Sainte-Hyacinthe, Que.; Toronto Health Economics and Technology Assessment (THETA) Collaborative (Sander), University Health Network; Dalla Lana School of Public Health (Sander), University of Toronto, Toronto, Ont.; School of Mathematics and Statistics (Jun Li), Xidian University, Xi’an, Shaanxi, China; Department of Mathematics (Arino), University of Manitoba, Winnipeg, Man.; Département de mathématiques et de statistique (Bélair), Université de Montréal, Montréal, Que.; Department of Mathematics and Statistics (Watmough), University of New Brunswick, Fredericton, NB
  • Find this author on Google Scholar
  • Find this author on PubMed
  • Search for this author on this site
Yi Tan
Canadian Centre for Disease Modeling (Yuan, Juan Li, Aruffo, Q. Li, Zheng, Heffernan, Tan, Jun Li, Arino, Bélair, Watmough, Kong, Moyles, Zhu), and Department of Mathematics and Statistics (Yuan, Aruffo, Heffernan, Tan, Kong, Moyles, Zhu), York University, Toronto, Ont.; Complex Systems Research Center (Juan Li), Shanxi University, Taiyuan, Shanxi, China; Toronto Public Health (Gatov, Collier), City of Toronto, Toronto, Ont.; Department of Mathematics (Q. Li), Shanghai Normal University, Shanghai, China; College of Mathematics and System Science (Zheng), Xinjiang University, Urumqi, Xinjiang, China; Public Health Risk Sciences Division (Ogden), National Microbiology Laboratory, Public Health Agency of Canada, Sainte-Hyacinthe, Que.; Toronto Health Economics and Technology Assessment (THETA) Collaborative (Sander), University Health Network; Dalla Lana School of Public Health (Sander), University of Toronto, Toronto, Ont.; School of Mathematics and Statistics (Jun Li), Xidian University, Xi’an, Shaanxi, China; Department of Mathematics (Arino), University of Manitoba, Winnipeg, Man.; Département de mathématiques et de statistique (Bélair), Université de Montréal, Montréal, Que.; Department of Mathematics and Statistics (Watmough), University of New Brunswick, Fredericton, NB
  • Find this author on Google Scholar
  • Find this author on PubMed
  • Search for this author on this site
Jun Li
Canadian Centre for Disease Modeling (Yuan, Juan Li, Aruffo, Q. Li, Zheng, Heffernan, Tan, Jun Li, Arino, Bélair, Watmough, Kong, Moyles, Zhu), and Department of Mathematics and Statistics (Yuan, Aruffo, Heffernan, Tan, Kong, Moyles, Zhu), York University, Toronto, Ont.; Complex Systems Research Center (Juan Li), Shanxi University, Taiyuan, Shanxi, China; Toronto Public Health (Gatov, Collier), City of Toronto, Toronto, Ont.; Department of Mathematics (Q. Li), Shanghai Normal University, Shanghai, China; College of Mathematics and System Science (Zheng), Xinjiang University, Urumqi, Xinjiang, China; Public Health Risk Sciences Division (Ogden), National Microbiology Laboratory, Public Health Agency of Canada, Sainte-Hyacinthe, Que.; Toronto Health Economics and Technology Assessment (THETA) Collaborative (Sander), University Health Network; Dalla Lana School of Public Health (Sander), University of Toronto, Toronto, Ont.; School of Mathematics and Statistics (Jun Li), Xidian University, Xi’an, Shaanxi, China; Department of Mathematics (Arino), University of Manitoba, Winnipeg, Man.; Département de mathématiques et de statistique (Bélair), Université de Montréal, Montréal, Que.; Department of Mathematics and Statistics (Watmough), University of New Brunswick, Fredericton, NB
  • Find this author on Google Scholar
  • Find this author on PubMed
  • Search for this author on this site
Julien Arino
Canadian Centre for Disease Modeling (Yuan, Juan Li, Aruffo, Q. Li, Zheng, Heffernan, Tan, Jun Li, Arino, Bélair, Watmough, Kong, Moyles, Zhu), and Department of Mathematics and Statistics (Yuan, Aruffo, Heffernan, Tan, Kong, Moyles, Zhu), York University, Toronto, Ont.; Complex Systems Research Center (Juan Li), Shanxi University, Taiyuan, Shanxi, China; Toronto Public Health (Gatov, Collier), City of Toronto, Toronto, Ont.; Department of Mathematics (Q. Li), Shanghai Normal University, Shanghai, China; College of Mathematics and System Science (Zheng), Xinjiang University, Urumqi, Xinjiang, China; Public Health Risk Sciences Division (Ogden), National Microbiology Laboratory, Public Health Agency of Canada, Sainte-Hyacinthe, Que.; Toronto Health Economics and Technology Assessment (THETA) Collaborative (Sander), University Health Network; Dalla Lana School of Public Health (Sander), University of Toronto, Toronto, Ont.; School of Mathematics and Statistics (Jun Li), Xidian University, Xi’an, Shaanxi, China; Department of Mathematics (Arino), University of Manitoba, Winnipeg, Man.; Département de mathématiques et de statistique (Bélair), Université de Montréal, Montréal, Que.; Department of Mathematics and Statistics (Watmough), University of New Brunswick, Fredericton, NB
  • Find this author on Google Scholar
  • Find this author on PubMed
  • Search for this author on this site
Jacques Bélair
Canadian Centre for Disease Modeling (Yuan, Juan Li, Aruffo, Q. Li, Zheng, Heffernan, Tan, Jun Li, Arino, Bélair, Watmough, Kong, Moyles, Zhu), and Department of Mathematics and Statistics (Yuan, Aruffo, Heffernan, Tan, Kong, Moyles, Zhu), York University, Toronto, Ont.; Complex Systems Research Center (Juan Li), Shanxi University, Taiyuan, Shanxi, China; Toronto Public Health (Gatov, Collier), City of Toronto, Toronto, Ont.; Department of Mathematics (Q. Li), Shanghai Normal University, Shanghai, China; College of Mathematics and System Science (Zheng), Xinjiang University, Urumqi, Xinjiang, China; Public Health Risk Sciences Division (Ogden), National Microbiology Laboratory, Public Health Agency of Canada, Sainte-Hyacinthe, Que.; Toronto Health Economics and Technology Assessment (THETA) Collaborative (Sander), University Health Network; Dalla Lana School of Public Health (Sander), University of Toronto, Toronto, Ont.; School of Mathematics and Statistics (Jun Li), Xidian University, Xi’an, Shaanxi, China; Department of Mathematics (Arino), University of Manitoba, Winnipeg, Man.; Département de mathématiques et de statistique (Bélair), Université de Montréal, Montréal, Que.; Department of Mathematics and Statistics (Watmough), University of New Brunswick, Fredericton, NB
  • Find this author on Google Scholar
  • Find this author on PubMed
  • Search for this author on this site
James Watmough
Canadian Centre for Disease Modeling (Yuan, Juan Li, Aruffo, Q. Li, Zheng, Heffernan, Tan, Jun Li, Arino, Bélair, Watmough, Kong, Moyles, Zhu), and Department of Mathematics and Statistics (Yuan, Aruffo, Heffernan, Tan, Kong, Moyles, Zhu), York University, Toronto, Ont.; Complex Systems Research Center (Juan Li), Shanxi University, Taiyuan, Shanxi, China; Toronto Public Health (Gatov, Collier), City of Toronto, Toronto, Ont.; Department of Mathematics (Q. Li), Shanghai Normal University, Shanghai, China; College of Mathematics and System Science (Zheng), Xinjiang University, Urumqi, Xinjiang, China; Public Health Risk Sciences Division (Ogden), National Microbiology Laboratory, Public Health Agency of Canada, Sainte-Hyacinthe, Que.; Toronto Health Economics and Technology Assessment (THETA) Collaborative (Sander), University Health Network; Dalla Lana School of Public Health (Sander), University of Toronto, Toronto, Ont.; School of Mathematics and Statistics (Jun Li), Xidian University, Xi’an, Shaanxi, China; Department of Mathematics (Arino), University of Manitoba, Winnipeg, Man.; Département de mathématiques et de statistique (Bélair), Université de Montréal, Montréal, Que.; Department of Mathematics and Statistics (Watmough), University of New Brunswick, Fredericton, NB
  • Find this author on Google Scholar
  • Find this author on PubMed
  • Search for this author on this site
Jude Dzevela Kong
Canadian Centre for Disease Modeling (Yuan, Juan Li, Aruffo, Q. Li, Zheng, Heffernan, Tan, Jun Li, Arino, Bélair, Watmough, Kong, Moyles, Zhu), and Department of Mathematics and Statistics (Yuan, Aruffo, Heffernan, Tan, Kong, Moyles, Zhu), York University, Toronto, Ont.; Complex Systems Research Center (Juan Li), Shanxi University, Taiyuan, Shanxi, China; Toronto Public Health (Gatov, Collier), City of Toronto, Toronto, Ont.; Department of Mathematics (Q. Li), Shanghai Normal University, Shanghai, China; College of Mathematics and System Science (Zheng), Xinjiang University, Urumqi, Xinjiang, China; Public Health Risk Sciences Division (Ogden), National Microbiology Laboratory, Public Health Agency of Canada, Sainte-Hyacinthe, Que.; Toronto Health Economics and Technology Assessment (THETA) Collaborative (Sander), University Health Network; Dalla Lana School of Public Health (Sander), University of Toronto, Toronto, Ont.; School of Mathematics and Statistics (Jun Li), Xidian University, Xi’an, Shaanxi, China; Department of Mathematics (Arino), University of Manitoba, Winnipeg, Man.; Département de mathématiques et de statistique (Bélair), Université de Montréal, Montréal, Que.; Department of Mathematics and Statistics (Watmough), University of New Brunswick, Fredericton, NB
  • Find this author on Google Scholar
  • Find this author on PubMed
  • Search for this author on this site
Iain Moyles
Canadian Centre for Disease Modeling (Yuan, Juan Li, Aruffo, Q. Li, Zheng, Heffernan, Tan, Jun Li, Arino, Bélair, Watmough, Kong, Moyles, Zhu), and Department of Mathematics and Statistics (Yuan, Aruffo, Heffernan, Tan, Kong, Moyles, Zhu), York University, Toronto, Ont.; Complex Systems Research Center (Juan Li), Shanxi University, Taiyuan, Shanxi, China; Toronto Public Health (Gatov, Collier), City of Toronto, Toronto, Ont.; Department of Mathematics (Q. Li), Shanghai Normal University, Shanghai, China; College of Mathematics and System Science (Zheng), Xinjiang University, Urumqi, Xinjiang, China; Public Health Risk Sciences Division (Ogden), National Microbiology Laboratory, Public Health Agency of Canada, Sainte-Hyacinthe, Que.; Toronto Health Economics and Technology Assessment (THETA) Collaborative (Sander), University Health Network; Dalla Lana School of Public Health (Sander), University of Toronto, Toronto, Ont.; School of Mathematics and Statistics (Jun Li), Xidian University, Xi’an, Shaanxi, China; Department of Mathematics (Arino), University of Manitoba, Winnipeg, Man.; Département de mathématiques et de statistique (Bélair), Université de Montréal, Montréal, Que.; Department of Mathematics and Statistics (Watmough), University of New Brunswick, Fredericton, NB
  • Find this author on Google Scholar
  • Find this author on PubMed
  • Search for this author on this site
Huaiping Zhu
Canadian Centre for Disease Modeling (Yuan, Juan Li, Aruffo, Q. Li, Zheng, Heffernan, Tan, Jun Li, Arino, Bélair, Watmough, Kong, Moyles, Zhu), and Department of Mathematics and Statistics (Yuan, Aruffo, Heffernan, Tan, Kong, Moyles, Zhu), York University, Toronto, Ont.; Complex Systems Research Center (Juan Li), Shanxi University, Taiyuan, Shanxi, China; Toronto Public Health (Gatov, Collier), City of Toronto, Toronto, Ont.; Department of Mathematics (Q. Li), Shanghai Normal University, Shanghai, China; College of Mathematics and System Science (Zheng), Xinjiang University, Urumqi, Xinjiang, China; Public Health Risk Sciences Division (Ogden), National Microbiology Laboratory, Public Health Agency of Canada, Sainte-Hyacinthe, Que.; Toronto Health Economics and Technology Assessment (THETA) Collaborative (Sander), University Health Network; Dalla Lana School of Public Health (Sander), University of Toronto, Toronto, Ont.; School of Mathematics and Statistics (Jun Li), Xidian University, Xi’an, Shaanxi, China; Department of Mathematics (Arino), University of Manitoba, Winnipeg, Man.; Département de mathématiques et de statistique (Bélair), Université de Montréal, Montréal, Que.; Department of Mathematics and Statistics (Watmough), University of New Brunswick, Fredericton, NB
  • Find this author on Google Scholar
  • Find this author on PubMed
  • Search for this author on this site
  • Article
  • Figures & Tables
  • Related Content
  • Responses
  • Metrics
  • PDF
Loading

Abstract

Background: Globally, nonpharmaceutical interventions for COVID-19, including stay-at-home policies, limitations on gatherings and closure of public spaces, are being lifted. We explored the effect of lifting a stay-at-home policy on virus resurgence under different conditions.

Methods: Using confirmed case data from Toronto, Canada, between Feb. 24 and June 24, 2020, we ran a compartmental model with household structure to simulate the impact of the stay-at-home policy considering different levels of compliance. We estimated threshold values for the maximum number of contacts, probability of transmission and testing rates required for the safe reopening of the community.

Results: After the implementation of the stay-at-home policy, the contact rate outside the household fell by 39% (from 11.58 daily contacts to 7.11). The effective reproductive number decreased from 3.56 (95% confidence interval [CI] 3.02–4.14) on Mar. 12 to 0.84 (95% CI 0.79–0.89) on May 6. Strong adherence to stay-at-home policies appeared to prevent SARS-CoV-2 resurgence, but extending the duration of stay-at-home policies beyond 2 months had little added effect on cumulative cases (25 958 for 65 days of a stay-at-home policy and 23 461 for 95 days, by July 2, 2020) and deaths (1404 for 65 days and 1353 for 95 days). To avoid a resurgence, the average number of contacts per person per day should be kept below 9, with strict nonpharmaceutical interventions in place.

Interpretation: Our study demonstrates that the stay-at-home policy implemented in Toronto in March 2020 had a substantial impact on mitigating the spread of SARS-CoV-2. In the context of the early pandemic, before the emergence of variants of concern, reopening schools and workplaces was possible only with other nonpharmaceutical interventions in place.

Nonpharmaceutical interventions for COVID-19, including stay-at-home policies, isolation of cases and contact tracing, as well as physical distancing, handwashing and use of protective equipment such as face masks, are effective mitigation strategies for preventing virus spread.1–4 Many studies investigating SARS-CoV-2 transmission and nonpharmaceutical interventions point to the importance of within- and between-household transmission. 5–8 Although stay-at-home policies can help curb spread of SARS-CoV-2 in the community by reducing contacts outside the household,8 they can increase contacts among family members, leading to higher risk within the household, 9 with secondary infection rates in households shown to be as high as 30%–52.7%.5,10 Furthermore, prolonged periods of stay-at-home policies may not be practical because of the essential operations of society, and may directly or indirectly harm the economy and the physical and mental health of individuals.11,12 Therefore, it is important to assess the optimal length of policy implementation for preventing virus resurgence.

During the epidemic, stay-at-home policies have been used to mitigate virus spread. The proportion of people staying at home is a paramount factor for evaluating the effectiveness of this policy implementation. For example, symptomatic individuals, those who tested positive for SARS-CoV-2 infection, and traced contacts are more likely to remain in the home through self-isolation or quarantine than uninfected or asymptomatic individuals. 13 Hence, rates of testing, diagnosis, isolation of cases, contact tracing and quarantine of contacts, as well as public compliance with stay-at-home policies, are essential factors for determining virus transmission and the likelihood of epidemic resurgence after the lifting of restrictive closures.1 To allow for this level of complexity, we developed a household-based transmission model to capture differences in policy uptake behaviour using confirmed case data from Toronto, Canada.

Throughout the pandemic, Canadian provinces and territories have implemented restrictive closures of businesses, schools, workplaces and public spaces to reduce the number of contacts in the population and prevent further virus spread, with these restrictions lifted and reinstituted at various times.14 On Mar. 17, 2020, Ontario declared a state of emergency, with directives including stay-at-home policies.15

We aimed to evaluate the effect of the stay-at-home policy issued in March 2020 on the transmission of SARS-CoV-2 in Toronto, accounting for average household size, the degree of adherence to the stay-at-home policy, and the length of policy implementation. Additionally, on the basis of the average family size and local epidemic data, we estimated the basic reproduction number (R0) and effective reproduction number (Rt) and investigated potential thresholds for the number of contacts, testing rates and use of nonpharmaceutical interventions that would be optimal for mitigating the epidemic. Hence, we conducted simulations of dynamic population behaviour under different reopening and adherence scenarios, to compare different public health strategies in hopes of adding those evaluations to the scientific literature.

Methods

Study design

We developed a household-based compartmental model of SARS-CoV-2 transmission dynamics. The model assigns all individuals in the population to different disease states, including susceptible, exposed, infected (subclinical, prodromal or with symptoms), recovered or deceased (Figure 1). Given the importance of asymptomatic and presymptomatic infection in COVID-19,16 both stages are included. We simulated how individuals move between these compartments, including individuals in self-isolation (through hospitalization for the more severe cases, or through testing or contact tracing — in either case, the model assumed they were no longer transmitting the virus). To reflect the local context better, the model incorporated additional complexity by including household structure (i.e., average household size). Demographic changes in the population (i.e., births, deaths) were ignored.

Figure 1:
  • Download figure
  • Open in new tab
  • Download powerpoint
Figure 1:

Transmission model with household structure. Panel A shows the activity and response of different populations. Panel B shows a schematic diagram of the dynamics of COVID-19 in Toronto. Solid lines indicate movement between classes. Dashed lines represent the virus transmission routes. All individuals from groups noncompliant (nq) and compliant (q) with stay-at-home policies are in different disease states, susceptible (Si), exposed (Ei), infected (subclinical [Ai], prodromal [Ii1] or with symptoms [Ii2]), hospitalized (H), isolated (W), recovered (R) or deceased (D) (i = nq, q).

We used the Consolidated Health Economic Evaluation Reporting Standards (CHEERS) checklist to report the findings of our study.17

Study setting and sources

The city of Toronto is the most populous city in Canada, with a recorded population of 2 956 024.18 Its first COVID-19 case was identified in January 2020.19 Toronto activated the Emergency Operations Centre on Mar. 12, 2020, in response to the COVID-19 pandemic, and the stay-at-home policy was enacted.19 The public health response gradually relaxed starting on May 6, 2020,19 after Ontario released the document “A Framework for Reopening our Province” on Apr. 27, 2020.20 The province gradually reopened all workplaces and public spaces. Stage 1 of reopening, which began on May 19, 2020, allowed the opening of select workplaces and some small gatherings. On June 24, 2020, the city of Toronto entered Stage 2 of reopening, opening more workplaces and outdoor spaces, allowing gatherings of up to 10 people.19

To estimate the dynamics of transmission before and after implementation of the stay-at-home policy in Toronto, our deterministic transmission model was calibrated using publicly available data between Feb. 24 and June 24, 2020. We used data on daily new and cumulative confirmed cases by episode date from the open data of the City of Toronto21 and daily new confirmed cases and cumulative deaths by report date from open access epidemiologic data.22 We also used Census data to determine that the average household in Toronto has 2.4 individuals.23

Model assumptions, variables and parameters

Model assumptions, variables and parameters are presented in Tables 1 and 2. Additional details on the model structure and its equations are provided in Appendix 1, Section A, available at www.cmajopen.ca/content/10/2/E367/suppl/DC1.

View this table:
  • View inline
  • View popup
Table 1:

Model assumptions

View this table:
  • View inline
  • View popup
Table 2:

Model variables and parameters*

Compliance with the stay-at-home policy

To capture differences in policy uptake, we divided the population into 2 subgroups: individuals following the stay-at-home policy, indicated by a subscript q, and those not following it, indicated by a subscript nq. To describe the process of policy implementation, there are some common simplification methods: introducing different parameters before and after policy implementation,3 or considering them as either evenly distributed or dynamic.28 However, because of the influence of a variety of factors including individual preferences, as well as different socioeconomic and occupational characteristics, not all people will fully adhere to the stay-at-home policy. Hence, we assumed compliance to be a gradual process for individuals in different disease states once the stay-at-home policy was enacted on Mar. 12, 2020.19 The reaction time to compliance of individuals in the susceptible, exposed and infected groups is a random variable that follows a Γ distribution, describing the enforcement process of stay-at-home policies. We derived the daily stay-at-home rate, which is described in Appendix 1, Section A2. The movement between groups compliant and noncompliant with the stay-at-home policy was modelled as the policy and time varied.

Symptomatic testing

In Toronto at the beginning of the pandemic, testing was mainly provided to individuals showing symptoms.13 It takes time for infection to cause symptoms, for an individual to get tested for SARS-CoV-2 infection, and for a positive test to return and ultimately enter the case data. With limited testing resources and wait times, there is a time lag between the episode (onset) date and the reporting date. A delay in case diagnosis results in a delay in implementing control measures, increasing the risk of transmission.

To capture the effects of this lag in the model, we defined the ratio of symptomatic diagnosis completion (dc), calculated as the ratio of the cumulative number of confirmed cases by reported date on day t to that by episode date on day t. We examined the trend of dc in Toronto from Feb. 24 to June 24, 2020 (Appendix 1, Section C1). This quantity was used to inform the stay-at-home rate of detected infectious people (i.e., the rate at which they follow isolation recommendations).

Statistical analysis

Parameter values including the per-contact transmission probability, the maximum compliance proportion of the stay-at-home policy, and the transition rate for compliance with the stay-at-home policy listed in Table 2 were estimated by minimizing the sum of squared differences29 between the model’s estimates of the cumulative confirmed cases and cumulative deaths and data on these 2 indicators.

We compared the total infections with or without a stay-at-home policy, and the change of transmission risk over time with implementation of the stay-at-home policy under the assumption of different average household sizes, ranging from 2 to 3, to make our model more applicable to a variety of jurisdictions. We also explored the effect of the stay-at-home policy on the epidemic for different degrees of compliance and the length of the stay-at-home policy. We then reported the trajectories of different reopening scenarios and the threshold for safe opening. Analyses were carried out using Matlab (R2020a) and R (version 4.0.1).

Risk indices and reproduction numbers

We calculated the model-free and model-based basic reproduction number R0, based on the Toronto case data by episode date21,22 and total infection data (including symptomatic and asymptomatic infections) generated by the model, respectively, using an exponential growth method.30,31 The effective reproduction number Rt was estimated by using the method shown elsewhere,32,33 assuming a Γ distributed serial interval of 7.5 (standard deviation 3.4) days.24 We then defined a novel risk index after reopening (Rreopen) to evaluate the risk of reopening by calculating the reproduction number applying a next generation matrix34 when the stay-at-home policy is weakened (Appendix 1, Section B).

Ethics approval

This study is exempt from research ethics approval, as it uses publicly available data.

Results

Parameter estimation indicated that, at most, 65.1% of Toronto residents stayed at home because of the stay-at-home policy, after which the contact rate declined by 39%. After Stage 1 reopening of the city on May 19, 2020, the contact rate gradually increased to 8.65 daily contacts, corresponding to a 22% increase compared with the contact rate during the period of the stay-at-home policy (Figure 2).

Figure 2:
  • Download figure
  • Open in new tab
  • Download powerpoint
Figure 2:

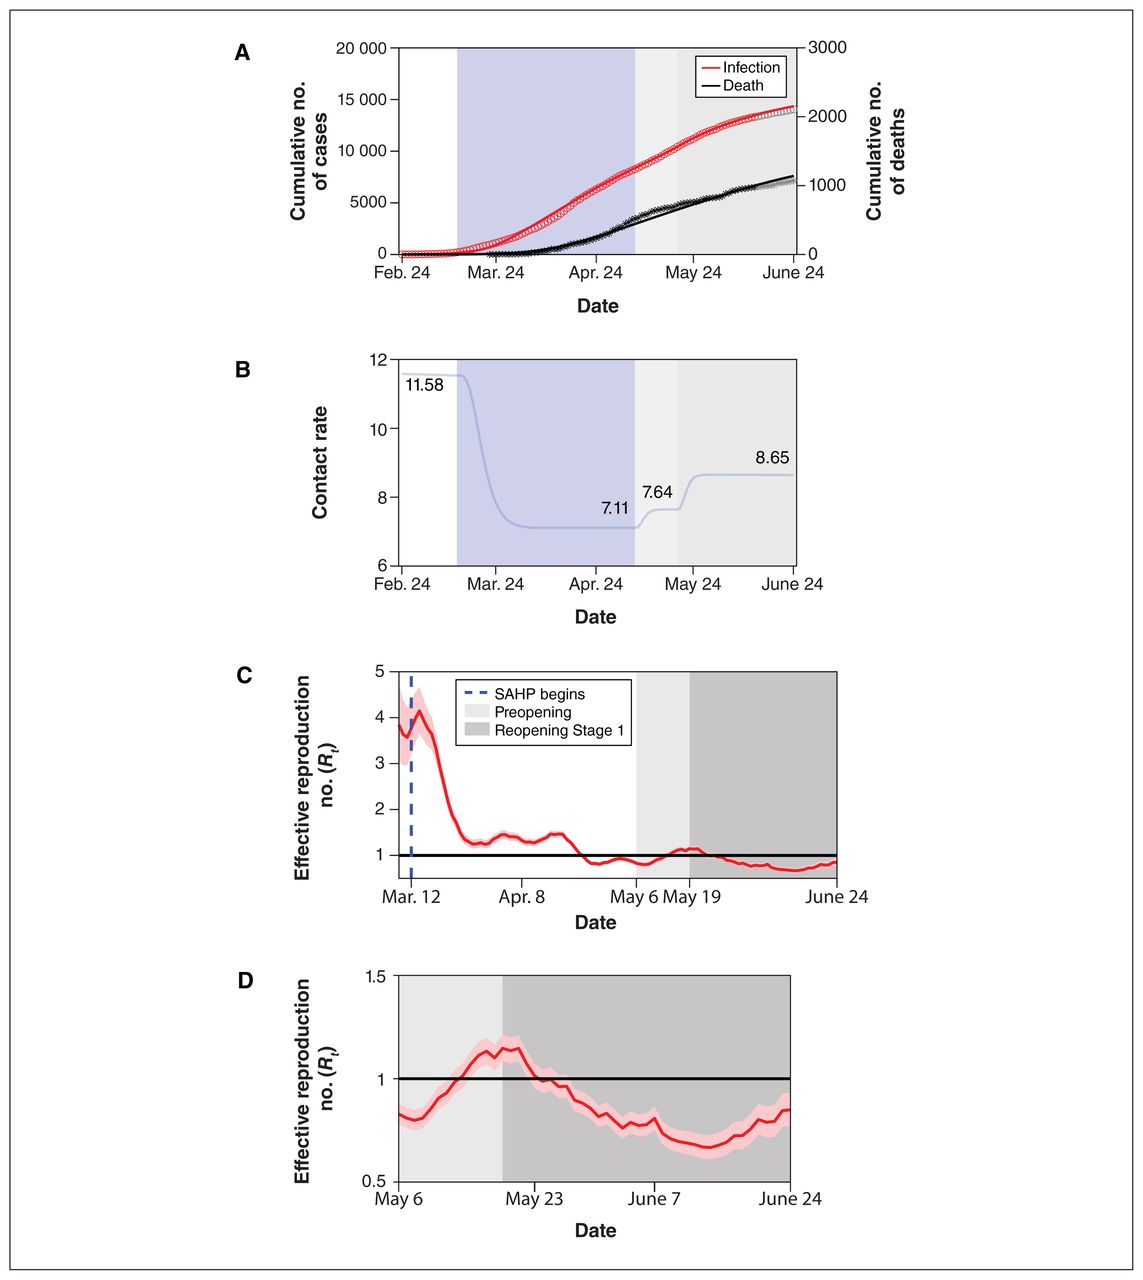
SARS-CoV-2 cumulative incidence and deaths, and transmission over time. (A) Data fitting of SARS-CoV-2 infection in Toronto from Feb. 24 to June 13, 2020. The red circles (infection) and black asterisks (death) represent observed data. The grey circles (infection) and grey asterisks (death) represent data validation from June 14 to June 24. The solid curves are model simulations. (B) Changes in contact rates over time. Panels C and D show estimates of the daily effective reproduction number (Rt) of SARS-CoV-2 over time based on the episode date (C) from Mar. 8 to May 6 and (D) from May 6 to June 24, with 95% confidence intervals represented by the pink shaded area. The dark solid line indicates the critical threshold of Rt = 1. The blue dashed line represents the start of the stay-at-home policy. Shaded bars show the dates of implementation of the stay-at-home policy (light blue), preopening (light grey) and reopening Stage 1 (medium grey). The white in panels A and B represent the time period without any public health control measures. The white in panel C represents the time period before and after the implementation of stay-at-home policy. All dates are in 2020. Note: SAHP = stay-at-home policy.

Estimation of reproduction numbers

The estimation result of the model-free R0 in Toronto was 1.45 (95% confidence interval [CI] 1.43–1.48), and the model-based R0 was 2.36 (95% CI 2.28–2.45). The Rt was calculated by using episode data varied before and after the implementation of the stay-at-home policy, and it gradually decreased from 3.56 (95% CI 3.02–4.14) on Mar. 12, 2020, to below 1.00 on Apr. 22, 2020, and to 0.84 (95% CI 0.79–0.89) on May 6, 2020, corresponding to a 76% (95% CI 71%–81%) reduction in transmissibility (Figure 2). After entering the Stage 1 reopening on May 19, 2020, with the strengthened use of face coverings, the Rt showed a clear downward trend initially and gradually decreased to 0.67 (95% CI 0.61–0.73) on June 14, 2020, although the contact rate was expected to be higher. By the end of reopening Stage 1, the Rt had increased to 0.85 (95% CI 0.77–0.93).

Effect of the stay-at-home policy

Overall, the stay-at-home policy reduced the average contact rate outside the household (Figures 2, 3 and 4), which affected overall transmission. A large reduction in infections and deaths by May 6, 2020, when the stay-at-home policy ended, was visible if a large proportion of individuals complied with the stay-at-home policy within a short period (Figure 3). If 75% of the population were compliant within 56 days, we could expect to see 5167 cases and 215 deaths by May 6, 2020, decreased by 63.2% and 57.4%, respectively, compared with 55% compliance. The mitigation effect on the epidemic could also be seen if the average transition rate of compliance with the stay-at-home policy was increased. The length of implementation of the stay-at-home policy did not affect the spread of the infection significantly when it was increased from 65 days to 95 days, where the cumulative number of infections and cumulative deaths by July 2 decreased by 9.6% and 3.6%, respectively.

Figure 3:
  • Download figure
  • Open in new tab
  • Download powerpoint
Figure 3:

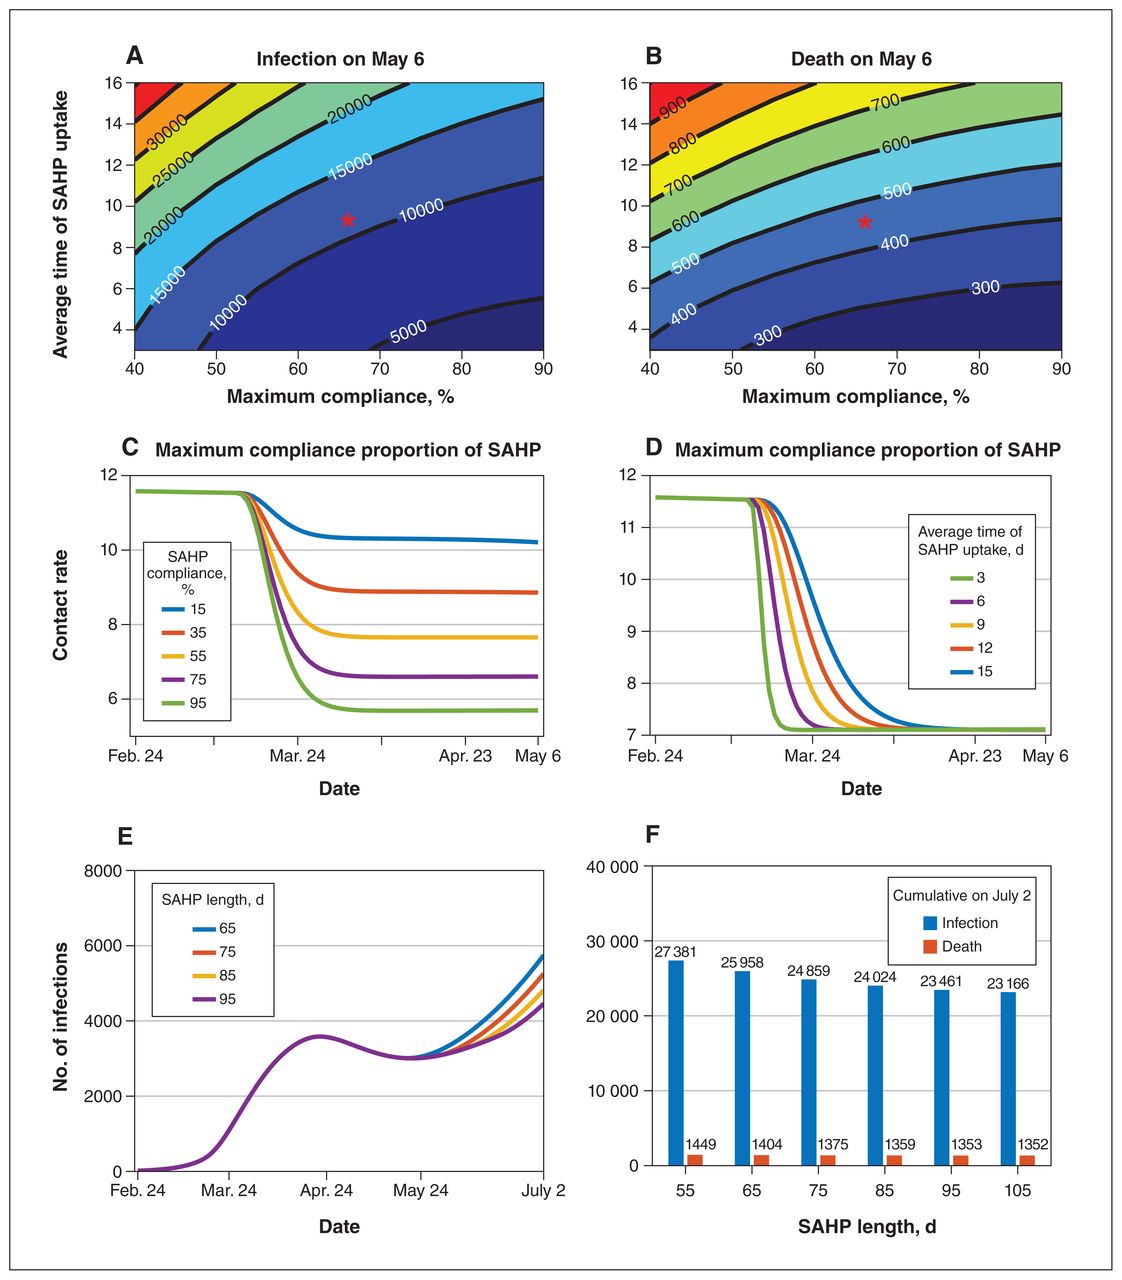
Effect of the stay-at-home policy with different maximum compliance proportion, average time and length of the stay-at-home policy. Contour plot of cumulative infections (A) and deaths (B) on May 6, 2020, with different average duration of stay-at-home policy uptake and maximum compliance proportions. Red asterisks represent the parameter values estimated from data and are used in simulations. The contact rate changes over time (C) under different compliance proportions of the stay-at-home policy when the average time of the stay-at-home policy uptake is 9 days (this is the inverse of the average transition rate of the stay-at-home policy compliance) and (D) under different average durations of stay-at-home policy uptake when the maximum compliance proportion is 65%. (E) The number of daily infections and (F) cumulative number of infections (blue bars) and deaths (orange bars) on July 2, 2020, with different lengths of the stay-at-home policy duration: 55 days, 65 days, 75 days, 85 days, 95 days, 105 days. All dates are in 2020. Note: SAHP = stay-at-home policy.

Figure 4:
  • Download figure
  • Open in new tab
  • Download powerpoint
Figure 4:

Risk of reopening under different reopening scenarios. Contour plot of Rreopen with different per-contact transmission probability outside the household (βnq) and contact rate under completion ratio of symptomatic diagnosis is (A) 40%; (B) 97%. The red asterisk is the initial status of βnq and contact rate, and the blue asterisk is the state on June 24. The grey asterisk is the possible state after completely reopening in simulation E. The red arrow shows the low-risk direction with the safe reopening. (C) The change in contact rates and (D) cumulative infections over time with different reopening scenarios: fully reopening on July 15 (purple dashed line), partially reopening on July 15 and then fully reopening on Sept. 1 (green dashed line), fully reopening on Sept. 1 (orange dashed line), fully reopening on Sept. 1 while maintaining a contact rate of 9 (orange dotted line), while βnq is 1.9%. (E) The number of cumulative infections over time with βnq = 1.6% (dashed line), 1.9% (solid line, current state), 2.2% (dotted line) when fully reopening on July 15. Rreopen = the transmission risk after fully reopening. All dates are in 2020.

The cumulative number of infections dropped significantly compared with that without the stay-at-home policy (Appendix 1, Section C2). To make our model more applicable to other jurisdictions, we examined the stay-at-home policy scenario for average household sizes of 3 and 2 individuals, whereby the number of infections was 12.5 and 25.9 times greater without the stay-at-home policy compared to with the stay-at-home policy, respectively. For an average household of 3 individuals, the stay-at-home policy resulted in 11 people infected per 1000 households by May 6, 2020, compared with 4 per 1000 for a household size of 2. However, in early phases of implementation of the stay-at-home policy, owing to the higher risk of transmission within families, the number of infections was higher than when there was no stay-at-home policy. The number of infections was even higher for larger household sizes, where the Rt increased as the maximum compliance proportion increased after 1 day of the implementation of the stay-at-home policy, but decreased after 10 days.

Threshold of contact rate and safe reopening

To avoid an epidemic resurgence after the city’s reopening, it is necessary to reduce the contact rate and probability of transmission per contact outside of the household. With a 1.9% transmission risk, the contact rate needs to be reduced to 11 when the symptomatic diagnosis completion ratio is 97% (Figure 4). However, if the symptomatic diagnosis completion ratio declines to 40%, the contact rate should be maintained below 9. In general, with increased risk of transmission, the contact rate must remain low.

Different reopening strategies can result in different epidemic trajectories, including a resurgence as we observed in the second wave in Toronto after August 2020. Using the Toronto stay-at-home policy issued in 2020 as an example, our model indicates that a safe reopening of public spaces could be achieved when the contact rate is reduced to 9, while maintaining strict physical distancing (Figure 4). With a 97% diagnosis completion ratio and 11.58 daily contacts, if the probability of transmission per contact was 2.2%, Rreopen was 1.2. This suggests that under full reopening conditions, the city still faced the risk of epidemic resurgence. On the other hand, if the per-contact transmission probability decreased to 1.6%, Rreopen was 0.87, and reopening was safe. Here, the claim is based on the situation in 2020.

Interpretation

Using our compartmental model with household structure, we analyzed the effect of the stay-at-home policy on SARS-CoV-2 transmission using Toronto as a case study. Stay-at-home policies have helped to control the epidemic and prevent the collapse of the health care system. However, in cities such as Wuhan, China, the stay-at-home policy was not effective in early stages of the lockdown.2 This phenomenon could be related to the average household size of 3.5 in Wuhan,35 larger than the household size of 2.4 in Toronto.23 Hence, the implementation of a stay-at-home policy needs to be adapted to local conditions. For areas with large average family size, additional measures, such as establishing temporary shelter hospitals, may be needed to reduce transmission.2 Moreover, a lower probability of transmission, provided by keeping mandatory or highly recommended use of nonpharmaceutical interventions such as physical distancing and mask-wearing,36 particularly in indoor public places,37 contributes substantially to epidemic control.

Our model-based R0 estimation captured asymptomatic transmission, which was higher than the estimate derived by case data, which underestimated R0. After Toronto reopened to Stage 1 on May 19, 2020,19 the Rt gradually declined, possibly owing to the strengthening of government regulations on personal protective equipment (PPE) use, as well as public messaging around mask-wearing, hand hygiene and physical distancing.19 Although the contact rate increased after reopening, the enhancement of PPE appears to have reduced the probability of infection, thereby reducing the risk of epidemic resurgence.

We constructed a new indicator, symptomatic diagnosis completion ratio (dc), which reflects the increased efficiency of public health response as the pandemic unfolded. We also observed that the diagnosis completion ratio affected transmission, as measured by the Rt being below 1 at reopening. Indeed, with a small ratio, public health agencies need to strengthen nonpharmaceutical interventions and work to decrease the number of contacts to avoid resurgence.

We found that full reopening without other strengthened nonpharmaceutical interventions leads to resurgence. When the average number of contacts in the population exceeded the threshold found in our analysis after reopening, the number of cases rapidly increased, explaining the second wave in Toronto. Such model-driven thresholds can act as early triggers for policy-makers and allow for dynamic intervention to mitigate the spread of SARS-CoV-2. Our model structure further allows for the generation of long-term projections to support decision-making. Though our analysis is a case study of Toronto, it is applicable to regions where the demographic characteristics are similar to those of this city and can also provide some information to any possible new emerging infections. Our simulation analysis is retrospective, however, and the results should be interpreted as reflecting the 2020 situation in Toronto.

Limitations

Household size and composition vary greatly within Toronto and in other regions. The mitigating effect of stay-at-home policies should be re-examined when applying to other areas with varying household sizes. The real-time serial interval may change with policy implementation, 38 which was not considered in our Rt calculation. In addition, age structure was not incorporated, as we aimed to unpack the impact of the stay-at-home policy on transmission considering the household as a whole, even though there is emerging evidence suggesting different transmission among adults and children, with children being less likely to acquire and transmit the infection.39 Moreover, the higher transmissibility of emerging variants of concern is concerning.40 We have considered school and community reopening with age structure;41 therefore, as a further work, we will consider the variant of concern and its impact on school opening to support public health decision-making.

Conclusion

We explored the mitigating effect of a stay-at-home policy on the spread of SARS-CoV-2 by using a compartmental model that incorporates household structure and nonpharmaceutical interventions, with Toronto as a case study. Our results reflect the 2020 situation in Toronto and have no current relevance to decision-making. We found that the effect of the stay-at-home policy was almost wholly evident after 2 months from implementation. Our study demonstrated that to control outbreaks, a stay-at-home policy, combined with physical distancing, PPE, and effective case diagnosis, contact tracing and isolation, is an effective strategy. Our results show that to reduce the risk of infection and transmission, if one of the control measures is relaxed, others may need to be strengthened. Our analysis of thresholds, including contact rates, can be applied to a variety of settings and can provide early triggers for dynamic public health response.

Footnotes

  • Competing interests: None declared.

  • This article has been peer reviewed.

  • Contributors: Huaiping Zhu, Pei Yuan, Juan Li, Iain Moyles, Nicholas Ogden, Jacques Bélair and Jane Heffernan contributed to the research design. Qi Li, Elena Aruffo, Pei Yuan, Juan Li, Tingting Zheng and Yi Tan contributed to the literature search. Evgenia Gatov, Sarah Collier, Tingting Zheng, Qi Li, Yi Tan, Pei Yuan and Juan Li contributed to data collection. Huaiping Zhu and all other authors contributed to the modelling. Jun Li, Pei Yuan, Juan Li, Elena Aruffo and Huaiping Zhu contributed to the model analysis. Pei Yuan, Juan Li, Elena Aruffo, Tingting Zheng, Yi Tan and Jun Li contributed to the simulations. Pei Yuan, Juan Li, Elena Aruffo, Qi Li, Tingting Zheng, Yi Tan and Huaiping Zhu prepared the draft. Pei Yuan, Juan Li, Elena Aruffo, Iain Moyles, Evgenia Gatov, Huaiping Zhu, Nicholas Ogden, Beate Sander, Jane Heffernan, Sarah Collier, Julien Arino, Jacques Bélair, James Watmough and Jude Dzevela Kong contributed to writing and revising the article. Huaiping Zhu supervised the study. Pei Yuan, Juan Li, Elena Aruffo contributed equally as co–first authors. All authors gave final approval of the version to be published and agree to be accountable for all aspects of the work.

  • Funding: This research was supported by the Canadian Institutes of Health Research, the Canadian COVID-19 Math Modelling Task Force (Huaiping Zhu, Nicholas Ogden, Beate Sander, Jane Heffernan, Julien Arino, Jacques Bélair, James Watmough and Jude Dzevela Kong), the Natural Sciences and Engineering Research Council of Canada (Huaiping Zhu, Jane Heffernan, Julien Arino, Jacques Bélair, James Watmough, Jude Dzevela Kong and Iain Moyles), the York University Research Chairs program (Huaiping Zhu) and the Chinese Scholarship Council (Pei Yuan, Qi Li, Tingting Zheng and Yi Tan).

  • Data sharing: The data used for this study are published by Toronto Public Health and Berry et al., and are publicly available at the following links: https://open.toronto.ca/dataset/covid-19-cases-in-toronto/ (accessed 2021 Mar. 24) and https://github.com/ishaberry/Covid19Canada (accessed 2021 Mar. 24).

  • Supplemental information: For reviewer comments and the original submission of this manuscript, please see www.cmajopen.ca/content/10/2/E367/suppl/DC1.

This is an Open Access article distributed in accordance with the terms of the Creative Commons Attribution (CC BY-NC-ND 4.0) licence, which permits use, distribution and reproduction in any medium, provided that the original publication is properly cited, the use is noncommercial (i.e., research or educational use), and no modifications or adaptations are made. See: https://creativecommons.org/licenses/by-nc-nd/4.0/

References

  1. ↵
    1. Ng V,
    2. Fazil A,
    3. Waddell LA,
    4. et al.
    (2020) Projected effects of nonpharmaceutical public health interventions to prevent resurgence of SARS-CoV-2 transmission in Canada. CMAJ 192:E1053–64.
    OpenUrlAbstract/FREE Full Text
  2. ↵
    1. Li J,
    2. Yuan P,
    3. Heffernan J,
    4. et al.
    (2020) Fangcang shelter hospitals during the COVID-19 epidemic, Wuhan, China. Bull World Health Organ 98:830–41D.
    OpenUrl
  3. ↵
    1. Tang B,
    2. Xia F,
    3. Tang SY,
    4. et al.
    (2020) The effectiveness of quarantine and isolation determine the trend of the COVID-19 epidemics in the final phase of the current outbreak in China. Int J Infect Dis 95:288–93.
    OpenUrlPubMed
  4. ↵
    1. Ludwig A,
    2. Berthiaume P,
    3. Orpana H,
    4. et al.
    (2020) Assessing the impact of varying levels of case detection and contact tracing on COVID-19 transmission in Canada during lifting of restrictive closures using a dynamic compartmental model. Can Commun Dis Rep 46:409–21.
    OpenUrl
  5. ↵
    1. Wang Z,
    2. Ma W,
    3. Zheng X,
    4. et al.
    (2020) Household transmission of SARS-CoV-2. J Infect 81:179–82.
    OpenUrlCrossRefPubMed
    1. Pellis L,
    2. Ferguson NM,
    3. Fraser C
    (2011) Epidemic growth rate and household reproduction number in communities of households, schools and workplaces. J Math Biol 63:691–734.
    OpenUrlPubMed
    1. House T,
    2. Keeling MJ
    (2008) Deterministic epidemic models with explicit household structure. Math Biosci 213:29–39.
    OpenUrlCrossRefPubMed
  6. ↵
    1. Sjödin H,
    2. Wilder-Smith A,
    3. Osman S,
    4. et al.
    (2020) Only strict quarantine measures can curb the coronavirus disease (COVID-19) outbreak in Italy, 2020. Euro Surveill 25:2000280.
    OpenUrl
  7. ↵
    1. Prem K,
    2. Liu Y,
    3. Russell TW,
    4. et al.
    (2020) The effect of control strategies to reduce social mixing on outcomes of the COVID-19 epidemic in Wuhan, China: a modelling study. Lancet Public Health 5:e261–70.
    OpenUrlPubMed
  8. ↵
    1. Baker JM,
    2. Nakayama JY,
    3. O’Hegarty M,
    4. et al.
    (2022) SARS-CoV-2 B.1.1.529 (Omicron) variant transmission within households — four U.S. jurisdictions, November 2021–February 2022. MMWR Morb Mortal Wkly Rep 71:341–346.
    OpenUrlCrossRefPubMed
  9. ↵
    1. Brooks SK,
    2. Webster RK,
    3. Smith LE,
    4. et al.
    (2020) The psychological impact of quarantine and how to reduce it: rapid review of the evidence. Lancet 395:912–20.
    OpenUrlCrossRefPubMed
  10. ↵
    1. Mandel A,
    2. Veetil V
    (June 19, 2020) The economic cost of COVID lockdowns: an out-of-equilibrium analysis. Econ Disaster Clim Chang doi:10.1007/s41885-020-00066-z, [Epub ahead of print].
    OpenUrlCrossRef
  11. ↵
    COVID-19 (City of Toronto, Toronto) updated 2021 Dec. 28. Available: https://www.toronto.ca/home/covid-19/. accessed 2021 Mar. 24.
  12. ↵
    Coronavirus disease (COVID-19) (Public Health Agency of Canada, Ottawa) modified 2021 Dec. 23. Available: https://www.canada.ca/en/public-health/services/diseases/coronavirus-disease-covid-19.html. accessed 2020 May 31.
  13. ↵
    (Mar 17, 2020) Ontario enacts declaration of emergency to protect the public [news release] (Ontario Ministry of Health, Toronto) Available: https://news.ontario.ca/en/release/56356/ontario-enacts-declaration-of-emergency-to-protect-the-public. accessed 2020 Apr. 8.
  14. ↵
    1. Zou L,
    2. Ruan F,
    3. Huang M,
    4. et al.
    (2020) SARS-CoV-2 viral load in upper respiratory specimens of infected patients. N Engl J Med 382:1177–9.
    OpenUrlCrossRefPubMed
  15. ↵
    1. Husereau D,
    2. Drummond M,
    3. Petrou S,
    4. et al.,
    5. ISPOR Health Economic Evaluation Publication Guidelines-CHEERS Good Reporting Practices Task Force
    (2013) Consolidated health economic evaluation reporting standards (CHEERS): explanation and elaboration — a report of the ISPOR health economic evaluations publication guidelines good reporting practices task force. Value Health 16:231–50.
    OpenUrlCrossRefPubMed
  16. ↵
    Toronto at a glance (City of Toronto, Toronto) Available: https://www.toronto.ca/city-government/data-research-maps/toronto-at-a-glance/. accessed 2020 Apr. 22.
  17. ↵
    News releases & other resources (City of Toronto, Toronto) Available: https://www.toronto.ca/news/. accessed 2020 July 30.
  18. ↵
    A plan to safely reopen Ontario and manage COVID-19 for the long-term (Ontario Ministry of Health, Toronto) Available: https://www.ontario.ca/page/reopening-ontario-whats-each-stage. accessed 2020 June 28.
  19. ↵
    Open data catalogue: COVID-19 cases in Toronto (City of Toronto, Toronto) Available: https://open.toronto.ca/dataset/covid-19-cases-in-toronto/. accessed 2021 Mar. 24.
  20. ↵
    1. Berry I,
    2. Soucy J-PR,
    3. Tuite A,
    4. et al.
    (2020) Open access epidemiologic data and an interactive dashboard to monitor the COVID-19 outbreak in Canada [letter]. CMAJ 192:E420.
    OpenUrlFREE Full Text
  21. ↵
    Census Profile, 2016 Census (Statistics Canada, Ottawa) modified 2021 Oct 27. Availablehttps://www12.statcan.gc.ca/census-recensement/2016/dp-pd/prof/details/Page.cfm?Lang=E&Geo1=CSD&Code1=3520005&Geo2=PR&Data=Count&B1=All. accessed 2020 Mar. 20.
  22. ↵
    1. Li Q,
    2. Guan X,
    3. Wu P,
    4. et al.
    (2020) Early transmission dynamics in Wuhan,8 China, of novel coronavirus-infected pneumonia. N Engl J Med 382:1199–207.
    OpenUrlCrossRefPubMed
    1. Li R,
    2. Pei S,
    3. Chen B,
    4. et al.
    (2020) Substantial undocumented infection facilitates the rapid dissemination of novel coronavirus (SARS-CoV2). Science 368:489–93.
    OpenUrlAbstract/FREE Full Text
  23. (2020) Coronavirus disease 2019 (COVID-19) situation report – 170 (World Health Organization, Geneva) Availablehttps://www.who.int/docs/default-source/coronaviruse/situation-reports/20200708-covid-19-sitrep-170.pdf?sfvrsn=bca86036_2. accessed 2020 July 15.
    1. Tang B,
    2. Scarabel F,
    3. Bragazzi NL,
    4. et al.
    (2020) De-escalation by reversing the escalation with a stronger synergistic package of contact tracing, quarantine, isolation and personal protection: feasibility of preventing a COVID-19 rebound in Ontario, Canada, as a case study. Biology (Basel) 9:100.
    OpenUrl
  24. ↵
    1. Moyles IR,
    2. Heffernan JM,
    3. Kong JD
    (2021) Cost and social distancing dynamics in a mathematical model of COVID-19 with application to Ontario, Canada. R Soc Open Sci 8:201770.
    OpenUrl
  25. ↵
    1. Lagarias JC,
    2. Reeds JA,
    3. Wright MH,
    4. et al.
    (1998) Convergence properties of the Nelder–Mead simplex method in low dimensions. SIAM J Optim 9:112–47.
    OpenUrlCrossRef
  26. ↵
    1. Wallinga J,
    2. Lipsitch M
    (2007) How generation intervals shape the relationship between growth rates and reproductive numbers. Proc Biol Sci 274:599–604.
    OpenUrlCrossRefPubMed
  27. ↵
    1. Obadia T,
    2. Haneef R,
    3. Boëlle P-Y
    (2012) The R0 package: a toolbox to estimate reproduction numbers for epidemic outbreaks. BMC Med Inform Decis Mak 12:147.
    OpenUrlCrossRefPubMed
  28. ↵
    1. Wallinga J,
    2. Teunis P
    (2004) Different epidemic curves for severe acute respiratory syndrome reveal similar impacts of control measures. Am J Epidemiol 160:509–16.
    OpenUrlCrossRefPubMed
  29. ↵
    1. Cori A,
    2. Ferguson NM,
    3. Fraser C,
    4. et al.
    (2013) A new framework and software to estimate time-varying reproduction numbers during epidemics. Am J Epidemiol 178:1505–12.
    OpenUrlCrossRefPubMed
  30. ↵
    1. van den Driessche P,
    2. Watmough J
    (2002) Reproduction numbers and sub-threshold endemic equilibria for compartmental models of disease transmission. Math Biosci 180:29–48.
    OpenUrlCrossRefPubMed
  31. ↵
    (2019) 2018 Wuhan Statistic Yearbook (Hubei Provincial Bureau of Statistics), Available: http://tjj.hubei.gov.cn/tjsj/sjkscx/tjnj/gsztj/whs/. accessed 2020 July 20.
  32. ↵
    1. Leung NHL,
    2. Chu DKW,
    3. Shiu EYC,
    4. et al.
    (2020) Respiratory virus shedding in exhaled breath and efficacy of face masks. Nat Med 26:676–80.
    OpenUrlCrossRefPubMed
  33. ↵
    Your guide to masks (Centers for Disease Control and Prevention, Atlanta) updated 2021 Oct 25. Availablehttps://www.cdc.gov/coronavirus/2019-ncov/prevent-getting-sick/about-face-coverings.html. accessed 2020 Apr. 8.
  34. ↵
    1. Ali ST,
    2. Wang L,
    3. Lau EHY,
    4. et al.
    (2020) Serial interval of SARS-CoV-2 was shortened over time by nonpharmaceutical interventions. Science 369:1106–9.
    OpenUrlAbstract/FREE Full Text
  35. ↵
    1. Viner RM,
    2. Mytton OT,
    3. Bonell C,
    4. et al.
    (2021) Susceptibility to SARS-CoV-2 infection among children and adolescents compared with adults: a systematic review and meta-analysis. JAMA Pediatr 175:143–56.
    OpenUrlPubMed
  36. ↵
    Tracking SARS-CoV-2 variants (World Health Organization, Geneva) updated 2022 Jan 10. Availablehttps://www.who.int/en/activities/tracking-SARS-CoV-2-variants/. accessed 2021 Apr. 20.
  37. ↵
    1. Pei Y,
    2. Elena A,
    3. Evgenia G,
    4. et al.
    (2022) School and community reopening during the COVID-19 pandemic: a mathematical modelling study. Royal Society Open Science 9:211883, https://doi.org/10.1098/rsos.211883.
    OpenUrl
  • © 2022 CMA Impact Inc. or its licensors
PreviousNext
Back to top

In this issue

CMAJ Open: 10 (2)
Vol. 10, Issue 2
1 Apr 2022
  • Table of Contents
  • Index by author

Article tools

Respond to this article
Print
Download PDF
Article Alerts
To sign up for email alerts or to access your current email alerts, enter your email address below:
Email Article

Thank you for your interest in spreading the word on CMAJ Open.

NOTE: We only request your email address so that the person you are recommending the page to knows that you wanted them to see it, and that it is not junk mail. We do not capture any email address.

Enter multiple addresses on separate lines or separate them with commas.
Efficacy of a “stay-at-home” policy on SARS-CoV-2 transmission in Toronto, Canada: a mathematical modelling study
(Your Name) has sent you a message from CMAJ Open
(Your Name) thought you would like to see the CMAJ Open web site.
CAPTCHA
This question is for testing whether or not you are a human visitor and to prevent automated spam submissions.
Citation Tools
Efficacy of a “stay-at-home” policy on SARS-CoV-2 transmission in Toronto, Canada: a mathematical modelling study
Pei Yuan, Juan Li, Elena Aruffo, Evgenia Gatov, Qi Li, Tingting Zheng, Nicholas H. Ogden, Beate Sander, Jane Heffernan, Sarah Collier, Yi Tan, Jun Li, Julien Arino, Jacques Bélair, James Watmough, Jude Dzevela Kong, Iain Moyles, Huaiping Zhu
Apr 2022, 10 (2) E367-E378; DOI: 10.9778/cmajo.20200242

Citation Manager Formats

  • BibTeX
  • Bookends
  • EasyBib
  • EndNote (tagged)
  • EndNote 8 (xml)
  • Medlars
  • Mendeley
  • Papers
  • RefWorks Tagged
  • Ref Manager
  • RIS
  • Zotero
Share
Efficacy of a “stay-at-home” policy on SARS-CoV-2 transmission in Toronto, Canada: a mathematical modelling study
Pei Yuan, Juan Li, Elena Aruffo, Evgenia Gatov, Qi Li, Tingting Zheng, Nicholas H. Ogden, Beate Sander, Jane Heffernan, Sarah Collier, Yi Tan, Jun Li, Julien Arino, Jacques Bélair, James Watmough, Jude Dzevela Kong, Iain Moyles, Huaiping Zhu
Apr 2022, 10 (2) E367-E378; DOI: 10.9778/cmajo.20200242
Digg logo Reddit logo Twitter logo Facebook logo Google logo Mendeley logo
  • Tweet Widget
  • Facebook Like

Related Articles

  • PubMed
  • Google Scholar

Cited By...

  • No citing articles found.
  • Google Scholar

Similar Articles

Content

  • Current issue
  • Past issues
  • Collections
  • Alerts
  • RSS

Authors & Reviewers

  • Overview for Authors
  • Preparing manuscripts
  • Manuscript Submission Checklist
  • Publication Fees
  • Forms
  • Editorial Policies
  • Editorial Process
  • Patient-Oriented Research
  • Submit a manuscript
  • Manuscript Progress
  • Submitting a letter
  • Information for Reviewers

About

  • General Information
  • Staff
  • Editorial Board
  • Contact Us
  • Advertising
  • Media
  • Reprints
  • Copyright and Permissions
  • Accessibility
  • CMA Civility Standards
CMAJ Group

Copyright 2023, CMA Impact Inc. or its licensors. All rights reserved. ISSN 2291-0026

All editorial matter in CMAJ OPEN represents the opinions of the authors and not necessarily those of the Canadian Medical Association or its subsidiaries.

To receive any of these resources in an accessible format, please contact us at CMAJ Group, 500-1410 Blair Towers Place, Ottawa ON, K1J 9B9; p: 1-888-855-2555; e: [email protected].

View CMA's Accessibility policy.


Powered by HighWire