


Abstract
Background: The capacity of general internal medicine (GIM) clinical teaching units has been strained by decreasing resident supply and increasing patient demand. The objective of our study was to compare the number of residents (supply) with the volume and duration of patient care activities (demand) to identify inefficiency.
Methods: Using the most recently available data from an academic teaching hospital in Toronto, Ontario, we identified each occurrence of a set of patient care activities that took place on the clinical teaching unit from 2015 to 2019. We completed a descriptive analysis of the frequencies of these activities and how the frequencies varied by hour, day, week, month and year. Patient care activities included admissions, rounds, responding to pages, meeting with patients and their families, patient transfers, discharges and responding to cardiac arrests. The estimated time to complete each task was based on the available data in our electronic medical record system and interviews with GIM physicians and trainees. To calculate resident utilization, the person-hours of patient care tasks was divided by the person-hours of resident supply. Resident utilization was computed for 3 scenarios corresponding to varying levels of resident absenteeism.
Results: During the study period, there were 14 581 consultations to GIM from the emergency department. Patient volumes tended to be highest during January and lowest during May and June, and highest on Monday morning and lowest on Friday night. Daily admissions to hospital from the emergency department were higher on weekdays than on weekends, and hourly admissions peaked at 8 am and between 3 pm and 1 am. Weekday resident utilization was generally highest between 8 am and 2 pm, and lowest between 1 am and 8 am. In a scenario in which all residents were present apart from those who were post-call, resident utilization generally never exceeded 100%; in scenarios in which at least 1 resident was absent owing to illness or vacation, it was common for resident utilization to approach or exceed 100%, particularly during daytime working hours.
Interpretation: Analyzing supply and demand on a GIM ward has allowed us to identify periods when supply and demand are not aligned and to demonstrate empirically the vulnerability of current staffing models. These data have the potential to inform and optimize scheduling on an internal medicine ward.
As Competence by Design is being implemented for residency training programs across North America, fewer residents are rotating through the general internal medicine (GIM) clinical teaching unit.1,2 Simultaneously, the complexity, acuity and length of hospitalization for patients admitted to hospital has been increasing.3 The effect of decreasing resident supply and increasing patient demand has placed strains on the GIM clinical teaching unit, leading some to question whether the current model requires redesign.4
Empirical studies quantifying the workload on a GIM ward are either specific to individual tasks or lacking altogether. A prospective study at 2 GIM wards quantified the time and tasks required to discharge a patient from hospital.5 The researchers identified that the time to complete the discharge paperwork was about 30 minutes, though additional time was required to fill out additional referrals and communicate the information to both patients and providers.5 A survey study of more than 500 GIM physicians in the United States identified that patient workload often exceeded the available staffing.6 Although the physicians surveyed indicated that their workload likely affected patient safety, the study lacked data quantifying their daily tasks (i.e., demand) or the number of clinicians available to help with the tasks (i.e., supply).6
The objective of our study was to model the supply (i.e., number of residents) and demand (i.e., patient care activities) on the GIM clinical teaching unit at an academic teaching hospital to understand how changes in either variable could lead to mismatch, redundancy or inefficiency.
Methods
Study setting
We conducted a modelling study based on a retrospective cohort of patients hospitalized under the GIM service at St. Michael’s Hospital, an academic teaching hospital in Toronto, Ontario, using data up to 2019 (most recent available data). At St. Michael’s Hospital at the time of the study, there were about 80 inpatient GIM beds cared for by 5 medical teams. Four of the 5 teams were each composed of 1 staff physician, 1 senior resident (i.e., second-year resident or higher), 3 junior residents (i.e., 1 GIM first-year resident and 2 non-GIM residents) and 2 medical students. The fifth team was composed of 1 staff physician and generally 1 senior resident. The number of teams and their breakdowns are consistent with the current St. Michael’s Hospital model.
In the current St. Michael’s Hospital model, 1 resident physician is in hospital for 4 of the 5 teams for about 26 hours, and the remaining residents work from 8 am until 5 pm Monday to Friday. On Saturday and Sunday, 1 resident is in hospital 24 hours per day for each team. On the fifth team, the resident works Monday to Friday from 8 am until 5 pm. On the weekend, this team is covered by the staff physician from 8 am until noon and by 1 of the in-house residents for the remaining hours.
Data sources
We modelled the current supply and demand on the GIM ward. To model the demand, we identified the patient care tasks that occurred on the clinical teaching unit. They were identified through discussions with medical students, residents and staff physicians. These tasks included admitting patients to hospital from the emergency department, rounding on admitted patients, responding to pages, meeting with patients and their families, transferring patients out of the intensive care unit to the GIM ward, discharging patients from hospital and responding to cardiac arrests. For each task, we retrieved historical data to understand the number of times each task occurred per day, the timing of the task to the nearest hour, and how the frequency of tasks varied by hour, day, week, month and year. The exact dates for components generally spanned from 2015 to 2019, and some components had data spanning as far back as 2013 (Appendix 1, available at www.cmajopen.ca/content/9/4/E1021/suppl/DC1).
Data for tasks related to patient care (i.e., admissions, daily rounding and discharges) were accessed through our electronic medical record system, which automatically captures these data. Specifically, the electronic medical record has a log of all admissions and discharges, and the patient census for each day. Paging data were extracted directly from the hospital’s source paging system, which captures the date and time of pages to each team’s pager. Cardiac arrest data were accessed through the hospital’s cardiac arrest database, which captures the date and time of cardiac arrests that occurred.
Data related to the number of family meetings and medical consultations, and the time necessary to complete these tasks were estimated by interview of staff physicians (n = 3), internal medicine residents (n = 3) and non–internal medicine residents (n = 3). The staff physicians were all GIM physicians who regularly work on the inpatient GIM team. The medical students and residents were either currently working on GIM or had recently completed their GIM rotations (i.e., within the preceding 3 months).
Statistical analysis
For the year from February 2018 to February 2019, we calculated the duration of patient care tasks against available resident time. We divided each day into 4 periods whose boundaries mark either shifts in the number of working residents or shifts in the volume of aggregate patient demand (8 am to 2 pm, 2 pm to 5 pm, 5 pm to 1 am, and 1 am to 8 am). Within each period, we estimated total workload (demand) in units of person-hours by multiplying the frequency of each task by its estimated duration, and summing over all tasks. Within each period, we also estimated total supply. For example, if there were 3 residents available between 8 am and 5 pm, then there were 27 person-hours of resident time for patient care.
We then used the total demand and supply to estimate resident utilization in each period. In particular, we divided the person-hours of demand by the person-hours of supply (i.e., resident time) to estimate the percentage of available resident time that was used in each period. We completed these computations for each period in 1 year of data, generating 52 data points to visualize the distribution of utilization in each period on each day of the week. We also performed a sensitivity analysis in which we assumed each patient task took 50% longer, to assess how a 50% increase in patient task load affected the supply and demand estimates.
The supply and demand were calculated in the current model under 3 scenarios. Scenario 1 assumed all residents were present apart from those who were post-call. Scenario 2 assumed 1 resident was away on vacation each week and also accounted for a resident being post-call. Scenario 3 assumed 1 resident was away on vacation and another resident was away sick, and also accounted for a resident being post-call.
When the time of the consultation being requested was available, we used this time and no imputation was required. For patient records missing a consult request timestamp, we estimated the time the consult was requested by calculating the median time between consult request and consult completion or admission to hospital using data from patients for whom the consult request time was not missing. Specifically, we calculated the median time between consult completion or admission to hospital and the time of the consult request, and then subtracted this median time from the completion or admission time to impute the consult request time in instances where this particular timestamp was unavailable. All statistical analyses were performed using R version 3.6.2.
Ethics approval
This study was approved by the St. Michael’s Hospital Research Ethics Board.
Results
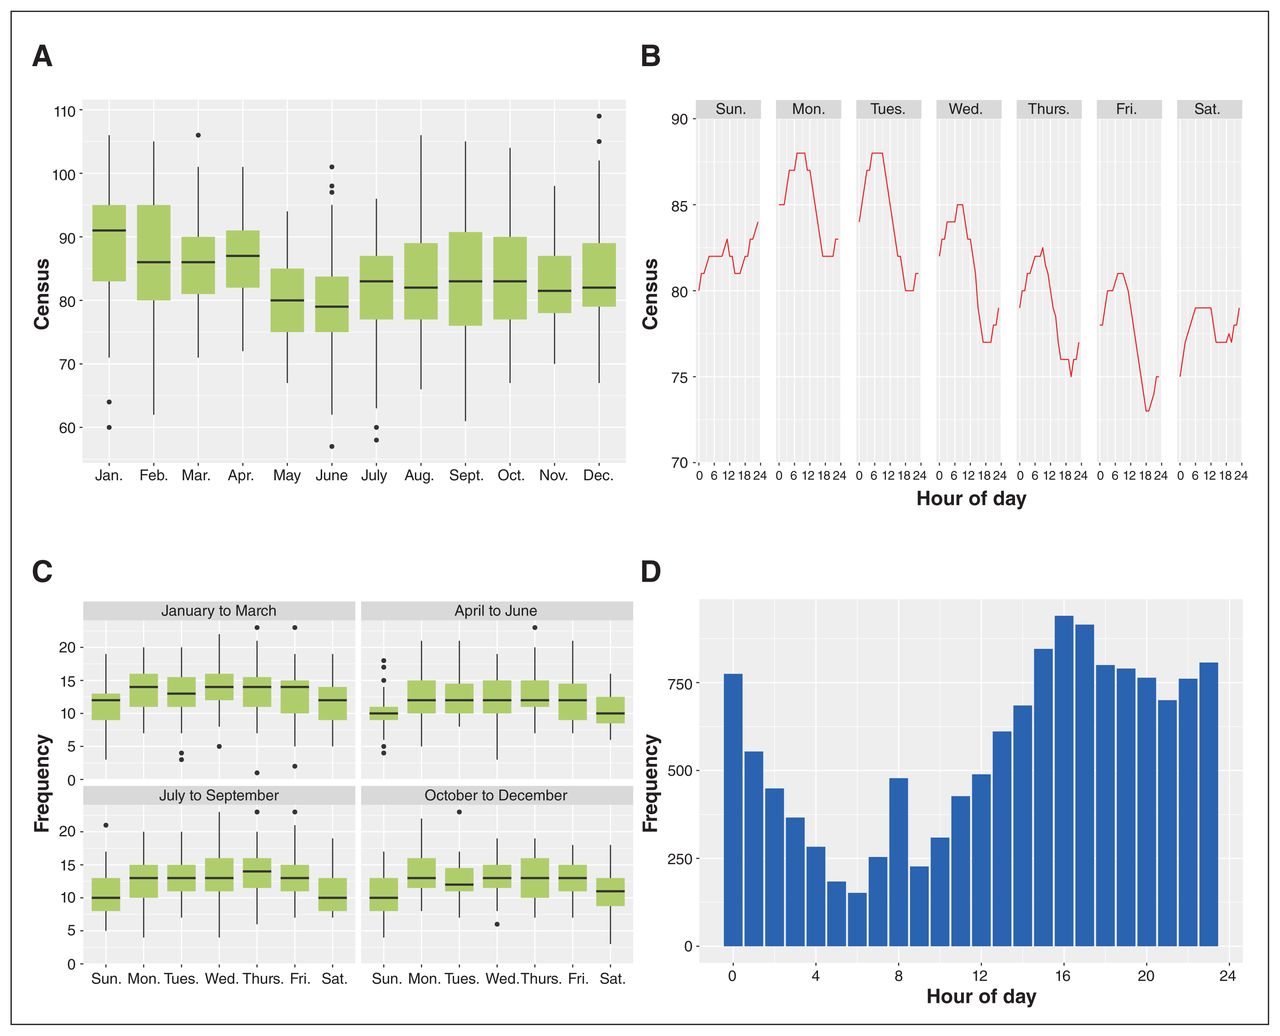
Between 2015 and 2019, there were 14 581 consultations to GIM from the emergency department at St. Michael’s Hospital. Patient volumes generally tended to be highest during January and lowest during May and June, with the highest variability in patient volumnes generally occurring in January, February, September and October (Figure 1A). Patient volumes also varied by day of week and hour of day, with the highest number of admitted patients typically occurring on Monday morning and the lowest number on Friday night (Figure 1B). Admissions to hospital from the emergency department varied by time of day, with peaks observed at 8 am and between 3 pm and 1 am, and the weekdays generally had higher numbers of admissions per day than the weekend (Figures 1C and 1D). The apparent “spike” at 8 am can be attributed to consultations after 6 am generally being held over until the new resident arrives at 8 am (Figure 1D). Similar patterns were observed for number of hospital discharges and number of pages to the on-call resident (Appendix 2, available at www.cmajopen.ca/content/9/4/E1021/suppl/DC1). Cardiac arrests occurred more often on weekdays than weekends and were most likely to occur between 10 am and 1 pm.

(A) Distribution of 8 am census in general internal medicine inpatient service, by month (data from January 2016 to December 2018). (B) Median census by hour of day and day of week. Data ranged from January 2016 to February 2019, Sunday to Saturday, excluding holidays. (C) Distribution of daily frequency of internal medicine consults. Data spans from January 2016 to December 2018. (D) Frequency of emergency department consults by hour of request (actual or imputed). Data ranged from January 2016 to December 2018. Note: For the census and emergency department consults data, box-whisker plot is used to show an indication of how the census (or consult frequency) volumes are spread out. The lower and upper bounds of the box represent, respectively, the 25th percentile and the 75th percentile of the volume of census (or consult frequency), and the horizontal line inside the box represents the median of the data. The range that the box covers (25th percentile to 75th percentile) is defined as interquartile range (IQR), and the lower and upper ends of the whiskers represent the “minimum” (i.e., 25th percentile – 1.5*IQR) and “maximum” (i.e., 75th percentile + 1.5*IQR) observation in the sample, respectively. The black dots are outliers.
In the current staffing model, resident utilization varied across the 3 scenarios (Figure 2). Across all 3 scenarios of various levels of staffing, weekday resident utilization was generally highest between 8 am and 2 pm and lowest between 1 am and 8 am (Figure 2). In scenario 1, resident utilization generally never exceeded 100% utilization. In contrast, in scenarios 2 and 3, it was common for resident utilization to approach and exceed 100% utilization, particularly during the daytime (Figures 2B and 2C). In the sensitivity analysis in which we assumed patient care tasks took 50% longer, resident utilization in scenario 1 began to approach and exceed 100%, and resident utilization in scenarios 2 and 3 was consistently above 100% (Appendix 2).
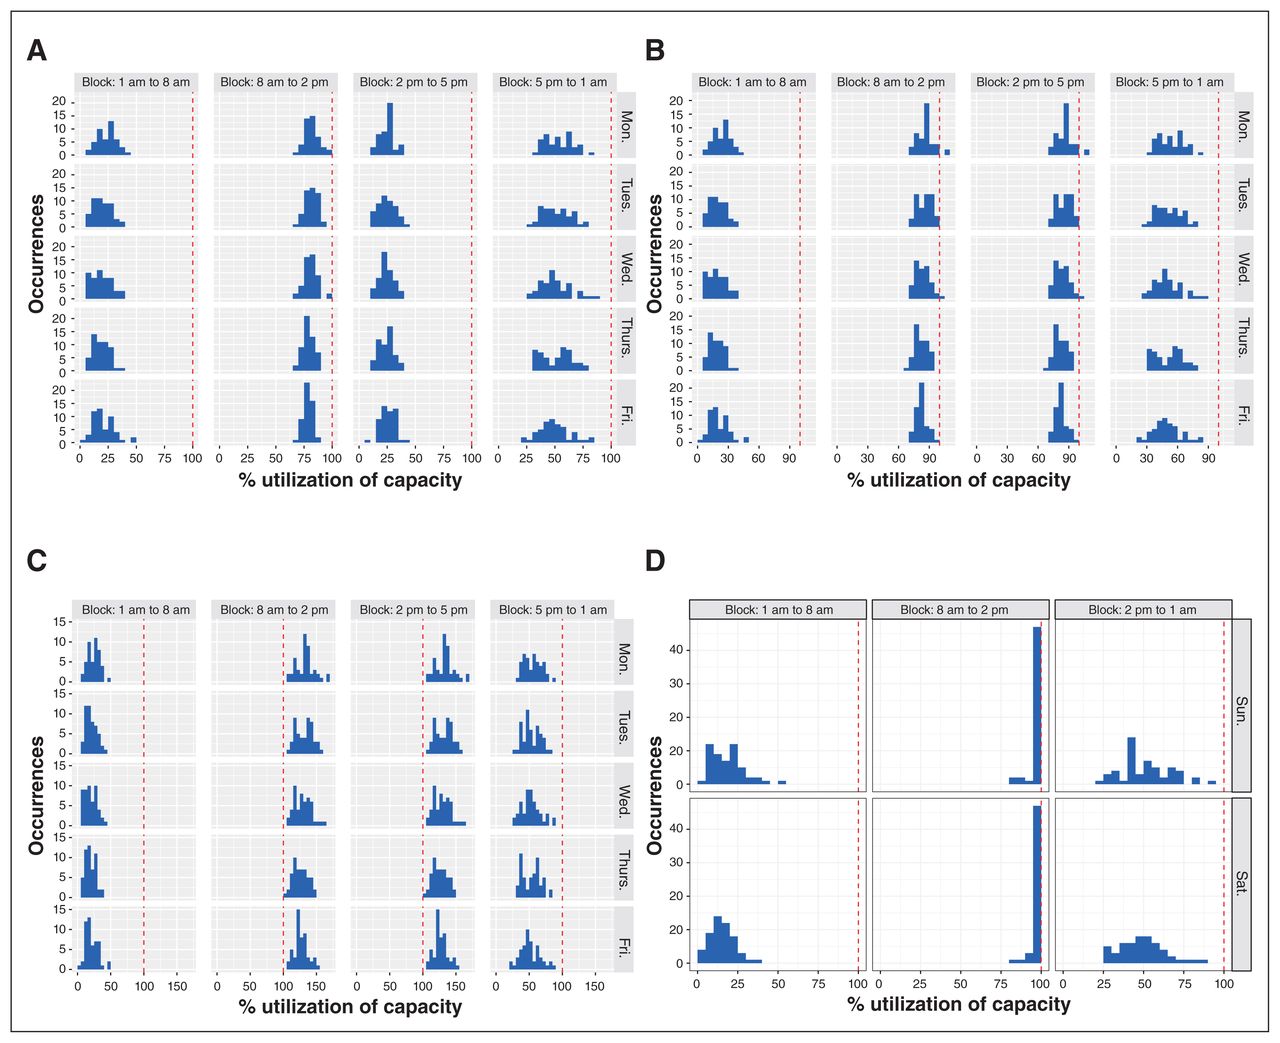
Resident utilization whereby each panel in the utilization histogram contains 52 data points representing the 52 weeks of the year. The red dashed line marks 100% utilization. (A) Weekday utilization scenario 1. This scenario assumed all residents were present apart from those who were post-call. (B) Weekday utilization scenario 2. This scenario assumed 1 resident was away on vacation each week and also accounted for a resident being post-call. (C) Weekday utilization scenario 3. This scenario assumed 1 resident was away on vacation and another resident was away sick, and also accounted for a resident being post-call. (D) Weekend utilization across all scenarios.
For weekend resident utilization, results were consistent across all 3 scenarios. During the weekends, resident utilization was highest from 8 am to 2 pm, during which it was consistently close to or reaching 100%; it was lowest from 1 am to 8 am (Figure 2D). In the sensitivity analysis, similar results were observed, though 100% utilization commonly occurred during the 2 pm to 1 am block.
Interpretation
In this single-centre study, we were able to model patient care tasks against resident supply to understand how supply and demand changes over the course of a given day and under various levels of resident absenteeism. Doing so allowed us to identify periods of mismatch, which provides data to inform how the schedule might be augmented to improve efficiency. Furthermore, our results highlight the vulnerability of the current scheduling model when residents are away.
The model can also be used to estimate whether a given number of residents would result in acceptable utilization rates, under scenarios where the volume of patient care tasks or the durations of patient care tasks have changed. For example, during the first wave of COVID-19, many hospitals observed increased volumes of admitted patients and increased time required to perform patient care tasks owing to requirements for personal protective equipment.7,8 These 2 factors would affect the demand on the ward, and given input data quantifying the change, the model could be used to estimate whether a proposed modification to the resident schedule would provide sufficient supply to satisfy demand at acceptable utilization rates. Determining the ideal utilization of health care team members will vary depending on whether a hospital’s goal is to have members working at maximum capacity (i.e., 100%) or working marginally below maximum (e.g., 80%) to allow for potential surges in workload.
Although there are few empirical studies that have been published in this area, our results mirror the experience of academic general internists who work in the inpatient setting. For example, it is well known among physicians working on a GIM service at a teaching hospital that the current scheduling approach is highly vulnerable to resident absenteeism, and it is common to have only 1 resident present each day after vacations, illness and teaching sessions are accounted for. We were able to show this by modelling the supply and demand across various scenarios of resident absenteeism to quantify empirically how this leads to overutilization (i.e., demand exceeds supply). Notably, the different scenarios we modelled did not affect supply and demand on the weekend, though this reflects the fact that, regardless of the number of residents scheduled for a GIM rotation, the weekend coverage is fixed at 1 resident per day.
In contrast, the different scenarios showed how weekday demand exceeds supply with increasing absenteeism. This observation likely explains why many teaching hospitals have hired physician extenders, such as physician assistants or nurse practitioners, to provide consistent levels of staffing. Other hospitals have also shifted their scheduling approach to a night float system, which again serves to provide more consistent daytime staffing of residents because the residents are not post-call and therefore not absent from the clinical ward during the daytime. Of course, each approach has important implications spanning from financial implications in the case of hiring physician extenders, to resident fatigue and work–life balance in the case of the night float system.
Limitations
Our study has important limitations. It was conducted at a single centre, and thus our results may not generalize to other centres. Specifically, our results will not generalize to community-based hospitals that do not have medical trainees, and will not necessarily generalize to hospitals that have a hybrid approach of teams supplemented by physician extenders (e.g., nurse practitioners and physician assistants) rather than medical trainees. Although we attempted to account for all of the various patient care tasks, there were others that we did not include because of a lack of data for those tasks (i.e., bedside procedures, hand-over, updating the medical sign-out list and calling for consultations).
For tasks with durations not recorded in the electronic medical record, we estimated the amount of time for each task included in our model based on input from a relatively small convenience sample of trainees and staff physicians, but our model does not account for the fact that time spent on any given task likely varies between residents. To help account for this, we conducted a sensitivity analysis in which we assumed tasks took 50% longer. This sensitivity analysis showed that scenario 2 and scenario 3 were particularly affected by a 50% increase in task duration, as shown by utilizations that consistently exceeded 100%.
Finally, a limitation of our study is that our model did not account for how “hands-on” the attending physician was and how this might vary across different levels of resident absenteeism to help balance supply and demand.
Conclusion
Analyzing supply and demand on a GIM ward has allowed us to identify periods when supply and demand are not aligned and to demonstrate empirically the vulnerability of current staffing models. Although our results were drawn from a single institution, we anticipate that many other hospitals also schedule the work hours of physicians based on historical scheduling practices. Scheduling physician work hours to align better with local patient demand may represent a more efficient and patient-centred approach. An added benefit of having a mechanism to model supply and demand is the ability to recalibrate scheduling as patient demand changes.
Footnotes
Competing interests: None declared.
This article has been peer reviewed.
Contributors: All authors contributed to the study concept and design, and to the analysis and interpretation of data. Neal Kaw and Mingkun Wang contributed to the statistical analysis. Michael Fralick drafted the manuscript, which all authors revised. All authors gave final approval of the version to be published and agreed to be accountable for all aspects of the work.
Funding: This study was funded by the Li Ka Shing Foundation. The funder was not involved in any other aspect of the study.
Data sharing: Data from this study are not available.
Supplemental information: For reviewer comments and the original submission of this manuscript, please see www.cmajopen.ca/content/9/4/E1021/suppl/DC1.
This is an Open Access article distributed in accordance with the terms of the Creative Commons Attribution (CC BY-NC-ND 4.0) licence, which permits use, distribution and reproduction in any medium, provided that the original publication is properly cited, the use is noncommercial (i.e., research or educational use), and no modifications or adaptations are made. See: https://creativecommons.org/licenses/by-nc-nd/4.0/
References
- © 2021 CMA Joule Inc. or its licensors
In this issue

Article tools


Related Articles
Cited By...
- No citing articles found.