


Abstract
Background: The COVID-19 pandemic has resulted in unique pressures on the emergency services system. This study describes changes in the presentation, presenting severity and disposition of patients accessing emergency services in Calgary, Alberta, during the first wave of the pandemic.
Methods: In this descriptive study, we constructed a population cohort of all patients who accessed emergency services by calling emergency medical services (EMS) (ambulance service that provides prehospital treatment and transport to medical facilities) or presenting directly to an emergency department (4 adult and 1 pediatric) or 2 urgent care centres in Calgary during the exposure period (December 2019 to June 2020) compared to 2 historical control periods (December to June, 2017–2018 and 2018–2019) combined. Outcomes included frequency of presentation, system flow indicators, patient severity, disposition and mortality. We used a locally estimated scatterplot smoothing function to visualize trends. We described differences at the maximum and minimum point of the exposure period compared to the control period.
Results: A total of 1 127 014 patient encounters were included. Compared to the control period, there was a 61% increase in the number of patients accessing EMS and a 35% decrease in the number of those presenting to an adult emergency department or urgent care centre in the COVID-19 period. The proportion of EMS calls for the highest-priority patients remained stable, whereas the proportion of patients presenting to an emergency department or urgent care centre with the highest-priority triage classification increased transiently by 0.9 percentage points (increase of 89%). A smaller proportion of patients were transported by EMS (decrease of 21%), and a greater proportion of emergency department patients were admitted to hospital (increase of 25%). After the first case was reported, the mortality rate among EMS patients increased by 265% (3.4 v. 12.4 per 1000 patient encounters).
Interpretation: The first wave of the COVID-19 pandemic was associated with substantial changes in the frequency and disposition of patients accessing emergency services. Further research examining the mechanism of these observations is important for mitigating the impact of future pandemics.
COVID-19 emerged in late 2019 and has since become a global pandemic.1 Maintaining the capacity of the health care system to accommodate large increases in patient numbers is an essential component of the overall pandemic response,2 and concern about overwhelming the health care system has led to widespread public health interventions in an attempt to limit the infection case load throughout the population. Assessment of changes in the patient composition seen by the health care system after these interventions would provide important knowledge for pandemic preparedness and evaluation of the response.
Emergency medical services (EMS) (ambulance service that provides prehospital treatment and transport to medical facilities) and the emergency department are the first points of contact with the health care system for many patients. During the early period of the pandemic, some EMS systems reported a decrease in the number of EMS responses,3 and emergency departments reported a decreased volume of patients.4–6 These changes included a decrease in presentations for conditions pathophysiologically unrelated to COVID-19, such as acute coronary syndrome7 and strokes.8 At the same time, evidence emerged of an increase in non-COVID-19 out-of-hospital deaths3,9 and 20% excess mortality between March and July 2020.10,11 These studies suggest major impacts from the pandemic and public health interventions; however, by examining components of the emergency services system in isolation, or specific patient populations and outcomes, they shed light only on some of the pressures faced by the system.
Comparing patients’ use of health care between emergency services would give a broader understanding of possible effects of the public health response on the system as a whole. The aim of this study was to examine changes in the frequency, presenting severity and disposition of patients who accessed emergency services in Calgary, Alberta, Canada, a city of about 1.5 million people,12 during the initial wave of the COVID-19 pandemic.
Methods
Study setting and design
In this population-level descriptive study, we compared changes in multiple outcomes during the initial phase of the COVID-19 pandemic (December 2019–June 2020) to a historical control period (December 2017–June 2018 and December 2018–June 2019 combined) in the emergency service system for Calgary and surrounding communities. Dates of important public health events and interventions included the reporting of the first COVID-19 case (Mar. 5, 2020), implementation of a municipal state of emergency (closing nonessential businesses, Mar. 15, 2020) and phases of the relaunch strategy (phase 1: opening stores and restaurants, May 14, 2020; phase 2: resuming elective surgical procedures, reopening schools and indoor recreation, June 12, 2020). Study reporting followed the STROBE statement.13
Participants
We used patient records to construct a population cohort of all patients who accessed emergency services, by calling the emergency number for an ambulance or by presenting directly to an emergency department or urgent care centre, during the study period. Calgary has 5 large hospitals, each equipped with emergency departments (one that is pediatric specific), and 2 urgent care centres. The latter are meant to provide care for non–life-threatening conditions requiring same-day treatment and have basic imaging and diagnostic resources available. A 1-tiered advanced life support EMS system responds throughout the city and may transport patients to any of these centres, or treat and release on scene according to provincial protocols. Both EMS and the hospitals are operated by the provincial health authority, Alberta Health Services.
Data sources
For EMS, paramedics document their assessment and interventions electronically at the time of the patient interaction in a single electronic patient care record system (Siren version 3.0, Medusa Medical Technologies). All hospitals and urgent care centres use a single integrated electronic medical record (Sunrise Clinical Manager release 18.4, Allscripts Sunrise Enterprise) in which all patient care activities, including initial assessments, are documented. These records are then linked to the National Ambulatory Care Reporting System, where diagnostic codes and disposition are coded electronically.
Measurements and outcomes
Primary outcomes included frequency of presentation, patient severity, disposition and mortality. We counted the daily frequency of patients accessing emergency services and examined the proportion of the total cohort of patients within each acuity stratification to determine changes in the composition of patients based on their presenting severity. For EMS, we stratified patients based on dispatch call priority, which indicates the urgency of the responding ambulance on a 5-level scale based on the 911 caller description, with Alpha being the lowest priority and Echo being the highest priority.14 A sixth level (Omega), indicating lower priority than Alpha, was omitted from the main analyses owing to inconsistent and infrequent use, and for consistency with the 5-level emergency department severity score. For emergency departments and urgent care centres, we stratified patient acuity using the Canadian Triage Acuity Scale (CTAS; scored from 5 [lowest acuity] to 1 [highest acuity]) based on the triage nurse’s assessment of the patient’s presenting problem and vital signs.15
We reported patient disposition after these initial encounters as the proportion of all encounters per day. Possible dispositions from EMS included death on scene, transport to hospital and release. We determined EMS disposition based on documented transfer to hospital or end of call for treat and release, both of which are computer-generated fields required with each encounter. We determined patient death based on paramedic documentation of death or discontinuation of resuscitation. Dispositions from the emergency department included death, admission to intensive care or hospital, and discharge home; disposition was noted from the disposition field in administrative records. Disposition from urgent care centres was not analyzed.
System flow indicators for EMS included response time (defined as the period of time between EMS receiving the 911 call and paramedic unit arrival on scene), scene time (defined as the period of time between arrival on scene and departure from scene) and total prehospital time (defined as the period of time between EMS receiving the 911 call and the end of the event [arrive at hospital or discharge on scene]). System flow indicators emergency departments and urgent care centres included wait time (defined as time from triage to physician assessment), total physician time (defined as the time from initial assessment by a physician to patient disposition decision) and emergency department boarding time (representing the downstream burden of hospital overcrowding on the emergency department).
Statistical analysis
We used descriptive analyses to examine changes in each outcome over the course of the 2 study periods, with each day as the unit for time. We determined changes during the COVID-19 period by subtracting an average of the daily estimate for each outcome for the 2 control periods from the corresponding day during the COVID-19 period. We generated smooth trends for each period using a locally estimated scatterplot smoothing function (α = 0.5) to help observe changes over time. We reported minimum or maximum values from the trend line as summary measures, or calculated percent change by contrasting these values with the corresponding median estimate from the historical control years. For the initial analysis, we stratified visits by service (EMS, emergency department and urgent care centre). Subsequent analyses examined all patients together. Repeat visits by the same patient within the same day, including patients presenting to EMS first and then transported to an emergency department or urgent care centre, were counted multiple times, as these represented discrete interactions with the health care system.
For most outcomes, we report direct measures from this population cohort, where all patients presenting to emergency services are represented; therefore, no estimates of uncertainty in population were necessary. For the system flow indicators, we calculated an average estimate per day and then plotted it with 95% confidence intervals as a representation of standard error for these averages. We calculated the daily mortality rate among EMS and emergency department patients per 1000 patient encounters. Missing data were present only for the system flow indicators, in very small proportions; therefore, we used complete case analysis for those outcomes. All statistical analyses were completed in R (R Foundation for Statistical Computing).
Ethics approval
This study was approved by the University of Calgary Conjoint Health Research Ethics Board and was granted a waiver of individual informed consent (REB20-0502).
Results
A total of 1 127 014 patient encounters were included (Table 1). Among these, 312 010 patients (27.7%) presented to EMS first, of whom 184 125 (59.0%) were transported to hospital. Among the hospital cohort (n = 815 004), 526 696 patients (64.6%) presented to 1 of the 4 adult hospitals, 125 523 (15.4%) presented to the children’s hospital, and 162 785 (20.0%) presented to an urgent care centre.
Patient and operational characteristics for emergency medical services, and emergency departments and urgent care centres in the control and COVID-19 periods
For reference, the frequency of COVID-19 cases in Calgary as reported by the provincial public health authority is shown in Figure 1A. As of Mar. 5, 2020, more patients presented to EMS than in the control period; this trend continued through the subsequent months (Figure 1B). At the maximum, 270 more patients (increase of 61%) presented to EMS in the COVID-19 period than in the control period. The number of patients presenting to an emergency department or urgent care centre decreased after the initial case. At the minimum, 296 fewer patients presented to an adult emergency department per day (decrease of 35%), 125 fewer patients presented to the children’s emergency department (decrease of 59%), and 148 fewer patients presented to an urgent care centre (decrease of 55%).
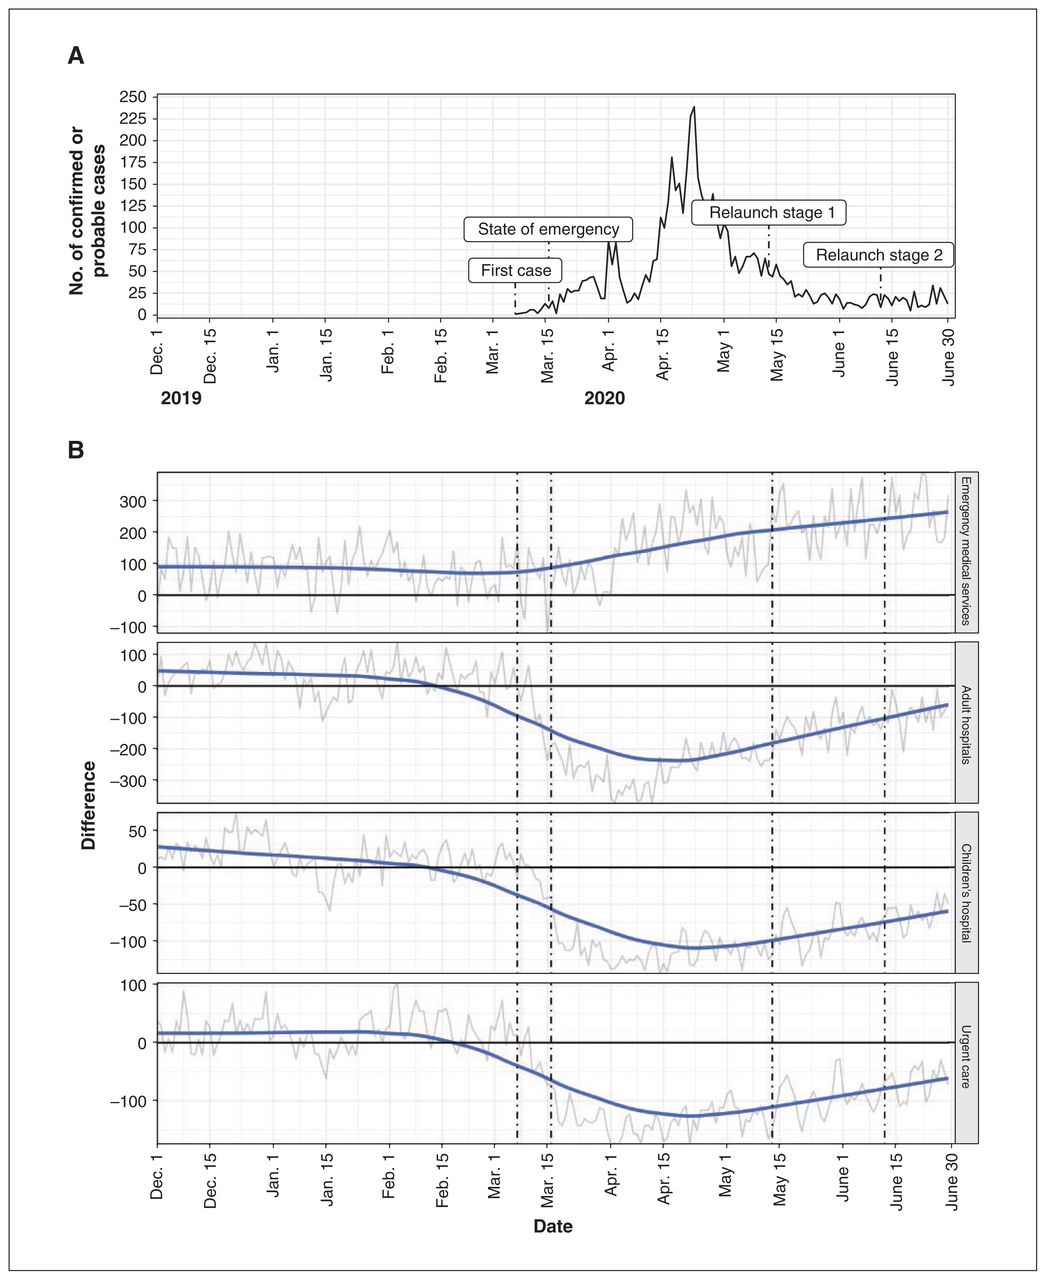
(A) Frequency of COVID-19 cases, March–June 2020. (B) Change in frequency of patient encounters with emergency services from the control period (December 2017–June 2018 and December 2018–June 2019) to the COVID-19 period (December 2019–June 2020).
Patient severity
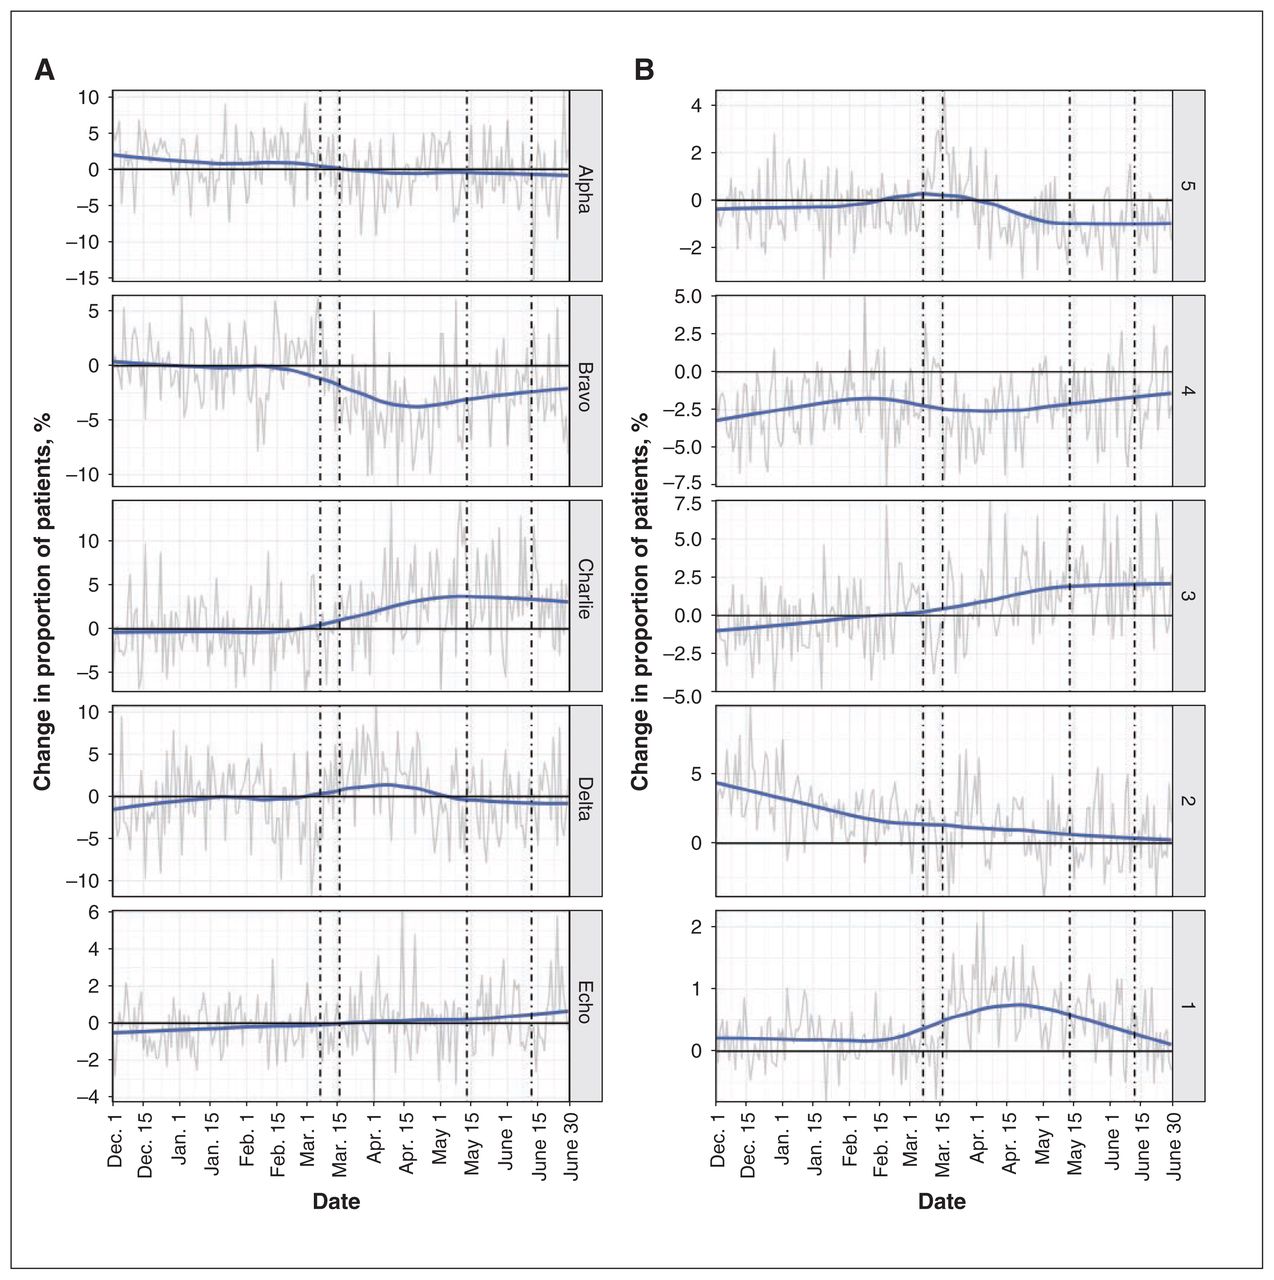
There was a greater proportion of Charlie-level calls and a decrease in Bravo-level calls during the COVID-19 period than in the control period (Figure 2). In contrast, the proportion of patients presenting to an emergency department or urgent care centre with the highest-priority triage classification (CTAS 1) increased after the initial case; this increase was sustained through the first phase of relaunch (Figure 2). At the maximum, the proportion of patients classified as CTAS 1 increased by 0.9 percentage points (increase of 89%). An associated decline in the lower-priority triage classifications (CTAS 4 and 5) was observed after the initial case and was sustained until the end of the study timeline.

Absolute change from the control period to the COVID-19 period in severity of presentation based on (A) emergency medical services (EMS) dispatch priority (Alpha = lowest, Echo = highest) and (B) emergency department and urgent care centre Canadian Triage Acuity Scale level (5 = lowest, 1 = highest). Dashed lines indicate important events as per Figure 1. Y-axis differs between EMS and emergency department/urgent care centre cohorts; these were modified to improve clarity of trends rather than allow direct comparison.
Transportation to hospital
After the first COVID-19 case, there was a decrease of 21% in the proportion of EMS patients transported to hospital (Figure 3). This decrease was observed mainly in the lower-priority categories (Alpha and Charlie) early in the period and was sustained until the first phase of relaunch. There was little change from the control period to the COVID-19 period in the proportion of patients admitted to hospital from an emergency department (12.3% v. 13.6%) (Table 1, Figure 3).

Absolute change from the control period to the COVID-19 period in severity of presentation for patients (A) transported by emergency medical services (EMS) (dispatch priority: Alpha = lowest, Echo = highest) and (B) admitted from the emergency department (Canadian Triage Acuity Scale level: 5 = lowest, 1 = highest). Dashed lines indicate important events as per Figure 1. Y-axis differs between EMS and emergency department cohorts; these were modified to improve clarity of trends rather than allow direct comparison.
Emergency medical services response time
Emergency medical services response time remained consistent during the COVID-19 period, but scene time and consequently the total prehospital time increased after the first case (Figure 4). At the maximum, the average scene time was 5.2 minutes longer (increase of 21%). In emergency departments and urgent care centres, the time patients waited to see a physician decreased by up to 1 hour (decrease of 60%), but the time physicians spent attending each patient increased by 22 minutes (increase of 15%). The time patients who were being admitted spent boarding decreased to 33 minutes (decrease of 18%).

Absolute change in average operational times for (A) emergency medical services (EMS) and (B) emergency departments and urgent care centres from the control period to the COVID-19 period. Shaded regions represent 95% confidence intervals for average estimates. Dashed lines indicate important events as per Figure 1. Y-axis differs between EMS and emergency department/urgent care centre cohorts; these were modified to improve clarity of trends rather than allow direct comparison.
Daily mortality rates
Daily mortality rates among patients in emergency departments remained steady throughout the COVID-19 period (Figure 5). An increase in the daily mortality rate among EMS patients was observed after the first case; this increase was sustained throughout the subsequent months. The highest mortality rate among EMS patients during the COVID-19 period was 12.4 per 1000 patient encounters, compared to 3.4 per 1000 encounters at the same time in the control period, an increase of 265%.

Absolute change in mortality rate per 1000 patient encounters for (A) emergency medical services (EMS) and (B) emergency departments from the control period to the COVID-19 period. Dashed lines indicate important events as per Figure 1. Y-axis differs between EMS and emergency department cohorts; these were modified to improve clarity of trends rather than allow direct comparison.
Interpretation
We observed an increase in the number of patients presenting to EMS and a decrease in the number of those presenting to an emergency department or urgent care centre during the first wave of the COVID-19 pandemic in Calgary. A greater proportion of patients who presented to an emergency department or urgent care centre in the COVID-19 period had the most acute triage score, but admission and death rates were similar between the 2 periods. Emergency medical services personnel spent longer on scene and transported fewer patients to hospital in the COVID-19 period. Emergency department and urgent care physicians spent more time responsible for patients, but wait and boarding times decreased. An increase in the mortality rate of 265% from the control period to the COVID-19 period was observed among patients who presented to EMS.
Unlike previous investigators,3,16 we observed an increased demand for EMS and decreased emergency department and urgent care centre volumes.17 Despite shifts in the acuity of emergency department and urgent care centre patients, a greater proportion of high-priority EMS dispatches was not observed, which suggests that the EMS system was seeing a different composition of patients than emergency departments and urgent care centres. This is further supported by the corresponding decrease in patients transported to hospital, which may have been due to lower-acuity patients’ wanting to avoid adding to the burden of the health care system.18 Alternatively, it may be evidence of a triage role paramedics play for patients accessing the health care system,3 or perhaps patients may have called EMS specifically to be assessed for COVID-19 symptoms. These findings provide insight into the decreased volume of emergency department presentations and highlight the complex and evolving role paramedics play in our health care system, particularly during times of increased system demand. This emphasizes the need to integrate EMS into future pandemic plans and research.
Similar to previous reports,17 we observed lower volumes of emergency department and urgent care centre presentations and a greater proportion of higher-acuity presentations to these facilities, but we also observed more physician time per patient. A number of factors may have contributed to this increased care time, including a larger proportion of patients who were more severely ill and required longer to assess and manage. Together, these changes suggest a major impact of the pandemic or of public health interventions on the care delivered in emergency departments and urgent care centres.
The increased mortality rate seen among EMS patients is concerning and is unlikely to be explained by COVID-19 directly.10,11 One contributor is an increase in opioid-related deaths.19,20 A report from the Alberta government identified 49 opioid-related deaths in the first quarter of 2020 and 115 such deaths in the second quarter.21 Mafham and colleagues7 reported decreased rates of presentation to hospital among patients with myocardial infarction, which raises the possibility that patients were ignoring cardiac symptoms, leading to out-of-hospital cardiac arrests. This may extend more broadly to the possibility that patients with potentially life-limiting illness avoided accessing health care for as long as possible because of concern about COVID-19. Future studies should seek to identify the underlying cause of death for these patients.
Limitations
We can only hypothesize the cause of the observed COVID-19-related changes in the frequency and disposition of patients presenting to emergency services, and how public health interventions may have contributed. Our conclusions about the presenting severity of patients are limited by the measures of severity, as these measures are a crude approximation of severity before any examination by an EMS provider or before a thorough examination by a physician and determination of laboratory values in the emergency department or urgent care centre. The emergency department triage score also incorporates subjectivity into the rating that may have been influenced by the pandemic. Operational time variables depend on health care providers’ entering information into electronic medical records, which may have systematically changed during the pandemic, as more personal protective equipment and sanitization are required before accessing the computers.
Conclusion
We observed an increase in the volume of patients presenting to EMS and a decrease in the volume of patients presenting to emergency departments and urgent care centres during the firsts wave of the COVID-19 pandemic in Calgary. Although the severity of the condition of patients presenting to EMS was largely unchanged, there was a relative increase in the proportion of patients with the highest-priority triage classification presenting to an emergency department or urgent care centre. There was a 265% increase in mortality among EMS patients. The mechanism of these observations needs to be assessed in future studies.
Footnotes
Competing interests: None declared.
This article has been peer reviewed.
Contributors: Daniel Lane, Ian Blanchard and Andrew McRae conceived the study and obtained the data. Jason Buick and Marta Shaw designed the study. Daniel Lane analyzed the data. All of the authors contributed to data interpretation, drafted the manuscript and revised it for important intellectual content, approved the final version to be published and agreed to be accountable for all aspects of the work.
Funding: No funding was received for this study.
Data sharing: The data were obtained through application to Alberta Health Services, which may be made at https://www.albertahealthservices.ca/research/research.aspx.
Supplemental information: For reviewer comments and the original submission of this manuscript, please see www.cmajopen.ca/content/9/2/E592/suppl/DC1.
This is an Open Access article distributed in accordance with the terms of the Creative Commons Attribution (CC BY-NC-ND 4.0) licence, which permits use, distribution and reproduction in any medium, provided that the original publication is properly cited, the use is noncommercial (i.e., research or educational use), and no modifications or adaptations are made. See: https://creativecommons.org/licenses/by-nc-nd/4.0/
References
- © 2021 CMA Joule Inc. or its licensors
In this issue

Article tools


