


Article Figures & Tables
Figures
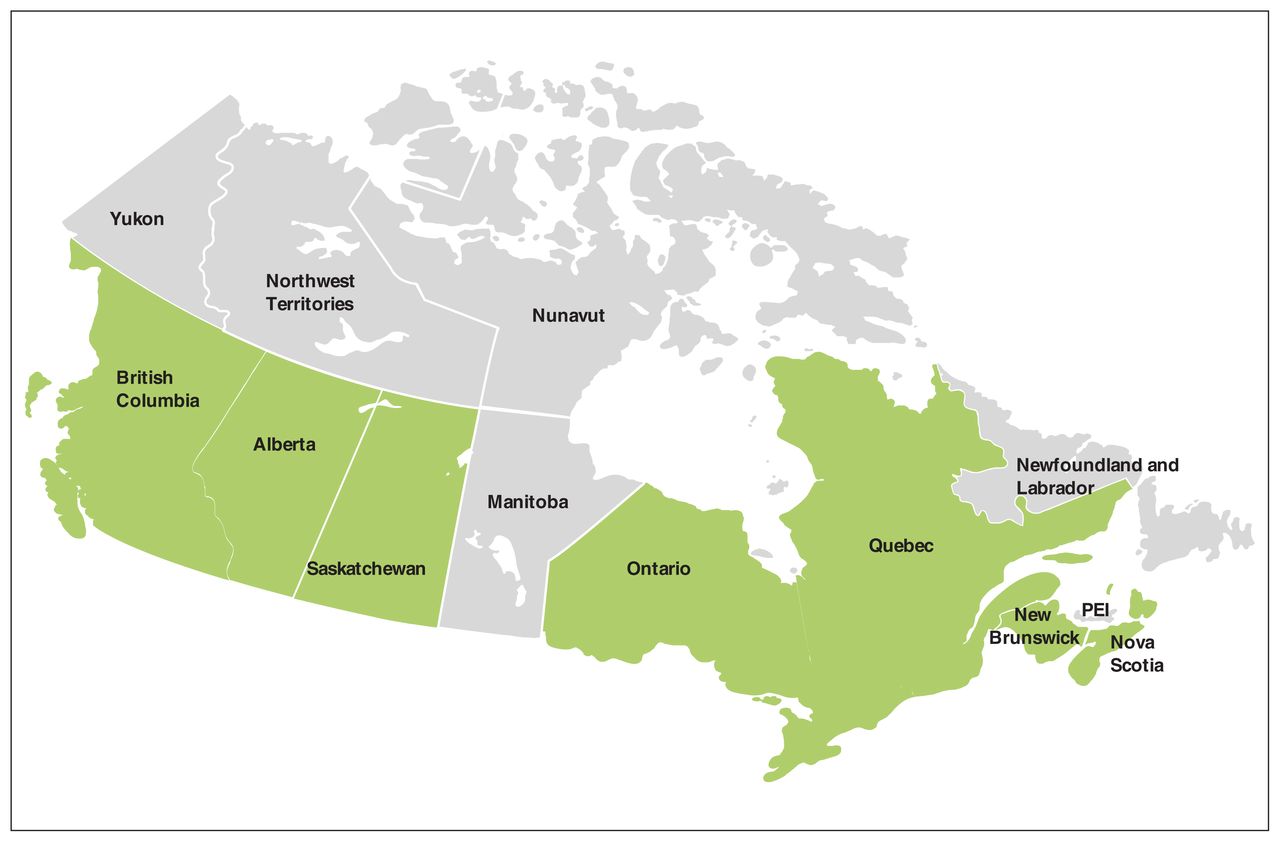
- Figure 1:
Map of Canada. Note: Provinces in green have centralized wait-time reporting systems in place. PEI = Prince Edward Island. © Copyright PresentationGO.com. Reproduced with permission.

Tables
- Table 1:
Overview of the wait-time reporting systems for elective surgery in Canadian provinces and territories
Characteristic BC AB SK MB ON QC NL NS NB PE TRS MOH budget, $ 20.8 billion 20.6 billion 5.89 billion 6.65 billion 63.5 billion 39 billion 3.2 billion 4.6 billion 2.8 billion 750 million 1.36 billion†† Centralized wait-time reporting system exists* ✓ ✓ ✓ ✓ ✓ ✓ ✓ Wait times reported for more than procedures included in the 5 priority areas† ✓ ✓ ✓ ✓ ✓ ✓ ✓ Wait times reported for procedures in the 5 priority areas ✓ ✓ ✓ Wait 1‡ measured ✓ ✓‡‡ ✓ ✓ NR Wait 2§ measured ✓ ✓ ✓ ✓ ✓ ✓ ✓§§ ✓ ✓ ✓ Comprehensive diagnostic prioritization system exists¶ ✓ ✓ ✓ ✓ ✓ ✓ ✓ Benchmarks established** ✓ ✓ ✓ ✓ ✓ ✓ ✓ Data quality and error checks ✓ ✓ NR NR ✓ NR NR ✓ ✓ NR Note: The populations of the provinces and territories in 2019 were as follows: BC, 5 046 780; AB, 4 350 901; SK, 1 171 027; MB, 1 364 400; ON 14 484 242; QC, 8 447 609; NL, 522 818; NS, 966 709; NB, 772 887; PE, 155 656, Northwest Territories, 44 909; Nunavut, 38 666; Yukon, 40 601. AB = Alberta, BC = British Columbia, MOH = ministry of health, NL = Newfoundland and Labrador, NR = not reported, NS = Nova Scotia, ON = Ontario, PE = Prince Edward Island, QC = Quebec, SK = Saskatchewan, TRS = territories (Northwest Territories, Yukon and Nunavut).
↵* Centralized wait-time reporting systems are province wide and collect data for various elective surgical procedures into a single database.
↵† The 5 priority areas, as defined in the 2003 First Ministers’ Accord on Health Care Renewal, are sight restoration surgery (cataract surgery), diagnostic imaging, cancer surgery, cardiac surgery and joint replacement surgery (hip and knee replacements).
↵‡ Wait 1 is defined as the time between referral from the family physician to the specialist and the first (or only) specialist appointment.
↵§ Wait 2 is defined as the time between when the specialist and the patient decide to proceed with surgery and the date the surgery is completed.
↵¶ A diagnostic prioritization system is a method for determining patient wait times or location on a wait list or both, on the basis of urgency or acuity. A comprehensive diagnostic prioritization system was defined as a system that is embedded within a centralized wait-time reporting system that includes 2 or more surgical procedures.
↵** A benchmark is a standard against which actual wait times are measured.
↵†† Yukon = $428 million, Northwest Territories = $495.9 million, Nunavut = $431 million.
↵‡‡ Only some specialists report consult wait times to the directory.
↵§§ Wait times for joint replacement surgery, cataract surgery and cancer surgery are tracked by each regional health authority and are reported to the Department of Health and Community Services 4 times per year.
- Table 2:
Data source and method of collection for provincial and territorial wait-time reporting systems for elective surgery
Variable BC AB SK MB* ON QC NL* NS NB PE* TRS* Entity tasked with reporting wait-time data Health authorities, operating room booking staff Operating Room Information System (ORIS) NR Hospitals and clinical offices, Cardiac Care Network Assigned staff in every health care institution District health authorities Hospital staff Entity tasked with collecting wait-time data Provincial Health Services Authority (PHSA) Alberta Coding Access Targets for Surgery (ACATS) Surgical Patient Registry Wait Time Information System (WTIS) Information System for Managing Access Mechanisms to Specialized Services (SIMASS) Patient Access Registry Nova Scotia (PAR NS) Surgical Patient Registry Schedule for updating wait-time data Daily Varies by report Daily Near real time Real time NR Real time Note: AB = Alberta, BC = British Columbia, MB = Manitoba, NB = New Brunswick, NL = Newfoundland and Labrador, NR = not reported, NS = Nova Scotia, ON = Ontario, PE = Prince Edward Island, QC = Quebec, SK = Saskatchewan, TRS = territories (Northwest Territories, Yukon and Nunavut).
↵* The territories do not report wait times. Manitoba, Newfoundland and Labrador and Prince Edward Island report wait times only for procedures that fall within the 5 priority areas. Other provinces report wait-times for a broader range of elective procedures.
- Table 3:
General characteristics of websites reporting wait times for elective surgery in Canadian provinces and territories
Characteristic BC AB SK MB ON QC NL NS NB PE TRS Wait-time reporting website exists* ✓ ✓ ✓ ✓ ✓ ✓ ✓¶ ✓ ✓ ✓ Wait times reported for more than procedures included in the 5 priority areas† ✓ ✓ ✓ ✓ ✓ ✓ ✓ Wait times reported for procedures in the 5 priority areas ✓ ✓ ✓ Wait 1‡ reported ✓** ✓ ✓ Wait 2§ reported ✓ ✓ ✓ ✓ ✓ ✓ ✓ ✓ ✓ ✓ Note: AB = Alberta, BC = British Columbia, MB = Manitoba, NB = New Brunswick, NL = Newfoundland and Labrador, NS = Nova Scotia, ON = Ontario, PE = Prince Edward Island, QC = Quebec, SK = Saskatchewan, TRS = territories (Northwest Territories, Yukon and Nunavut).
↵* The websites may be reporting data from a centralized wait-time reporting system or a decentralized reporting process.
↵† The 5 priority areas, as defined in the 2003 First Ministers’ Accord on Health Care Renewal, are sight restoration surgery (cataract surgery), diagnostic imaging, cancer surgery, cardiac surgery and joint replacement surgery (hip and knee replacements).
↵‡ Wait 1 is defined as the time between referral from the family physician to the specialist and the first (or only) specialist appointment.
↵§ Wait 2 is defined as the time between when the specialist and the patient decide to proceed with surgery and the date the surgery is completed.
↵¶ There is no single website devoted to wait-time reporting. However, reports are published on the Western Health website and the Health and Community Services website.
↵** The website indicates that Wait 1 reporting is under development.
- Table 4:
Characteristics of wait-time data for elective surgery presented on wait-time reporting websites in Canadian provinces and territories
Characteristic BC AB SK MB ON QC NL NS NB PE TRS Data presented by procedure ✓ ✓ ✓ ✓ ✓ ✓ ✓* ✓ ✓ ✓ Data presented by surgeon ✓ ✓ ✓ ✓ Data presented by hospital or institution ✓ ✓ ✓ ✓ ✓ ✓† ✓ ✓ Data presented by location (e.g., health authority, zone, community) ✓ ✓ ✓ ✓ ✓ ✓ ✓‡ ✓ Data presented by time period (e.g., month, year) ✓ ✓ ✓§ ✓ Information included No. of cases waiting
No. of cases completed
50th (median) and 90th percentile wait times
25th, 50th, 75th and 90th percentile wait times
Average (mean) wait time
No. of procedures completed
No. of nonemergent cases completed
Time frame within which 50% and 90% of patients received surgery (wk)
Cases waiting
Percentage of patients waiting > 3 months
Specialist will or will not see patient using video conferencing
No. of surgeries performed/month
Median wait times by most recent 2 fiscal years to date
Percentage of patients seen within target time (all patients combined)
For each priority level: patients who should be seen within a target time of X days waited on average X days, percentage of patients seen within target time
Can compare average days waited across various hospitals
For patients operated on: no. of patients, percentage operated on within 3 and 6 or more months, and average waiting time
For patients waiting: no. of patients waiting, no. of patients waiting 6 months or more
WH website Median wait time
Percentage of patients for whom benchmark was met
Total no. of procedures performed
No. of procedures completed
Time frame within which 50% and 90% of procedures were completed
Percentage of procedures performed within benchmark
Maximum time 90% and 50% of patients waited
Shortest wait time
Wait-time trends
Time frame within which 50% and 90% of procedures were completed
Trend information
No. of procedures completed
Time frame within which 90% of patients were treated (d)
Data source Surgical Patient Registry
Data not recorded by the Surgical Patient Registry are sent to the MOH by other organizations
MOH receives data from hospitals and diagnostic clinics
These institutions gather information from physicians and specialists
Surgical Patient Registry with the exception of hip fracture repair (data come from CIHI)
Hospitals and other facilities gather wait-time data from physician and operating room booking systems
RHAs check the data and send it to Manitoba Health, Seniors and Active Living’s Health System Innovation Branch
Wait Time Information System (WTIS)
Information System for Managing Access Mechanisms to Specialized Services (SIMASS) WH website Hospitals and other facilities get data from physicians and operating rooms or booking systems
Data are verified by each RHA and submitted to the Department of Health and Community Services
RHAs report wait-time data to the Department of Health and Community Services
Patient Access Registry Nova Scotia (PAR NS) Provincial Surgical Access Registry NR Update frequency Bimonthly Monthly Real time NR Monthly Monthly Monthly or quarterly or both Quarterly Quarterly NR Note: AB = Alberta, BC = British Columbia, CIHI = Canadian Institute for Health Information, HCS = Health and Community Services, MB = Manitoba, MOH = ministry of health, NB = New Brunswick, NL = Newfoundland and Labrador, NR = not reported, NS = Nova Scotia, ON = Ontario, PE = Prince Edward Island, QC = Quebec, RHA = regional health authority, SK = Saskatchewan, TRS = territories (i.e., Northwest Territories, Yukon & Nunavut), WH = Western Health.
↵* WH and HCS websites.
↵† WH website only.
↵‡ HCS website only.
↵§ Yearly reports are posted on the HCS website.
In this issue

Article tools


Related Articles
Cited By...
- No citing articles found.