


Abstract
Background: Incentive payments for chronic diseases in British Columbia were intended to support primary care physicians in providing more comprehensive care, but research shows that not all physicians bill incentives and not all eligible patients have them billed on their behalf. We investigated patient and physician characteristics associated with billing incentives for chronic diseases in BC.
Methods: We conducted a retrospective cohort analysis using linked administrative health data to examine community-based primary care physicians and patients with eligible chronic conditions in BC during 2010–2013. Descriptive analyses of patients and physicians compared 3 groups: no incentives in any of the 4 years, incentives in all 4 years, and incentives in any of the study years. We used hierarchical logistic regression models to identify the patient- and physician-level characteristics associated with billing incentives.
Results: Of 428 770 eligible patients, 142 475 (33.2%) had an incentive billed on their behalf in all 4 years, and 152 686 (35.6%) never did. Of 3936 physicians, 2625 (66.7%) billed at least 1 incentive in each of the 4 years, and 740 (18.8%) billed no incentives during the study period. The strongest predictors of having an incentive billed were the number of physician contacts a patient had (odds ratio [OR] for > 48 contacts 134.77, 95% confidence interval [CI] 112.27–161.78) and whether a physician had a large number of patients in his or her practice for whom incentives were billed (OR 42.38 [95% CI 34.55–52.00] for quartile 4 v. quartile 1).
Interpretation: The findings suggest that primary care physicians bill incentives for patients based on whom they see most often rather than using a population health management approach to their practice.
For nearly 2 decades, there has been concern about the decline in primary care, including both the availability of primary care providers1,2 and the comprehensiveness of their practices.3,4 Starting in 2003/04, incentive payments for a range of chronic diseases were put in place in British Columbia to encourage provision of comprehensive primary care.5 Additional per-patient annual payments for accepting longitudinal responsibility for care of patients with 1 or more chronic conditions were intended to emphasize the value of, and enable more physicians to provide, “full-service” family practice.6 More than a decade into the availability of fee-for-service-based chronic disease and complex care incentives in BC, only about two-thirds of primary care physician billed incentives.7
Previous analyses in BC showed that the likelihood of billing an incentive is strongly related to data-derived characterization of physician practice style, with “walk-in” style physicians billing very few to no incentives.8 The incentive program overall has shown little effect on patient care, with small increases in some clinical process measures of care (such as increased prescribing for patients with chronic obstructive pulmonary disease) 9 but no effect on acute care admissions or cost savings.7 Furthermore, among patients who qualified for the complex care incentive, those who had incentives billed on their behalf had lower costs and higher continuity of care both before and after the start of the incentive program.7 These observations, particularly the latter, are consistent with the international literature, which overall suggests that incentives tend to be billed by providers already providing higher-quality care or in contexts where care was already improving.10–12 Observational study designs are prone to selection bias.13 The tendency is to think of these biases in terms of patient-related selection factors, but, in the case of incentives, when not all physicians participate, there clearly may be selection effects at the physician level as well. Therefore, although incentives do not appear to alter the course of care,7,9 they may be a surrogate measure that differentiates the type of primary care people are receiving.
We investigated physician and patient characteristics associated with receipt of an incentive. We compared 2 distinct groups of patients who qualified for incentives: those who had an incentive billed on their behalf in all study years, and those who did not have an incentive billed on their behalf in any study year. We hypothesized that people without an incentive billed on their behalf see more primary care physicians and have lower overall continuity of care; that people without an incentive billed on their behalf tend not to see physicians who bill incentives for their patients; and that characteristics of a patient’s primary care physician are a stronger determinant of incentive billing than patient characteristics.
Methods
Setting
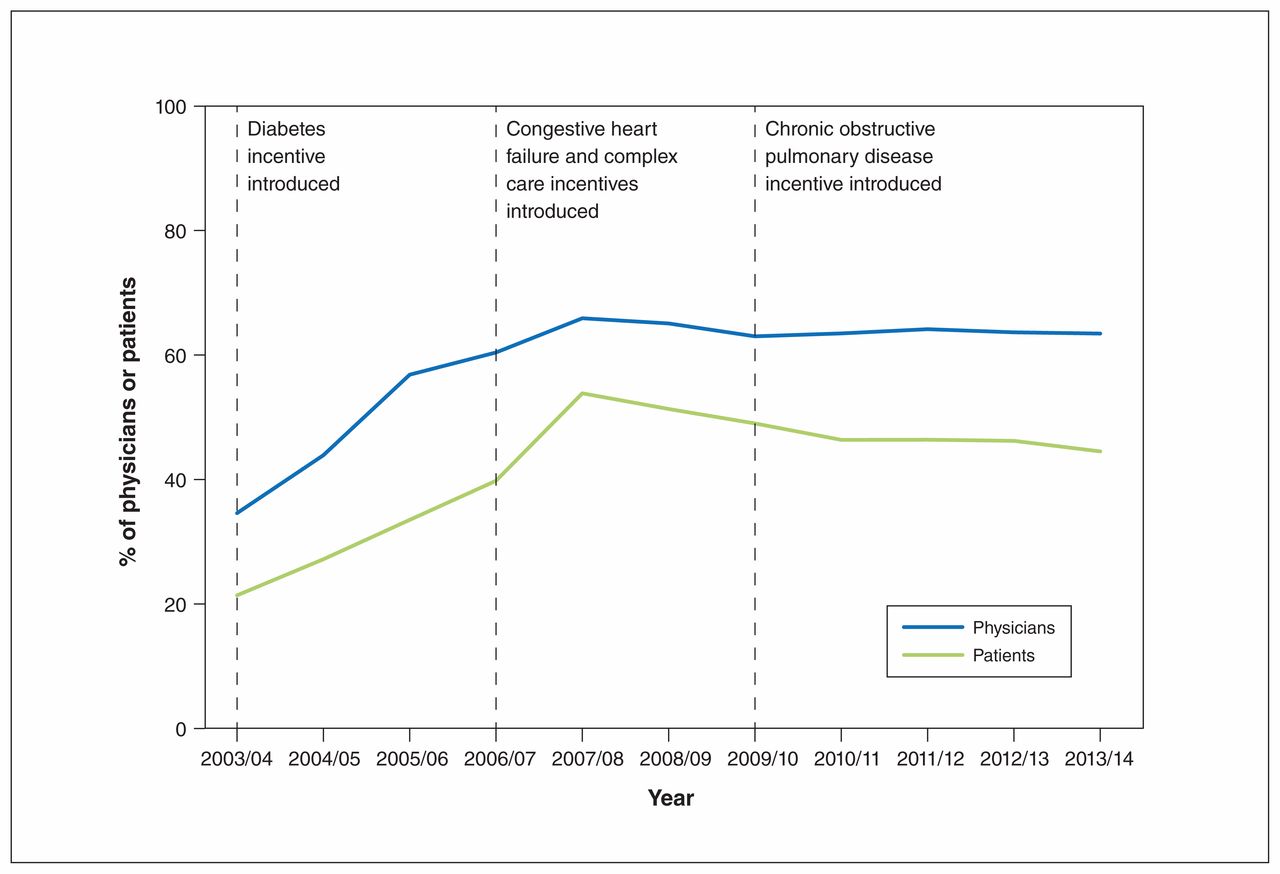
Incentive payments for chronic diseases were introduced in BC in 2003/04, with additional incentives being added in 2006/07 and then again in 2009/10. These incentives can be billed annually by physicians for each eligible patient for whom they commit to providing ongoing management and care (Table 1). Figure 1 shows that there was no appreciable increase in the proportion of physicians engaged with the incentive program in BC or the proportion of patients for whom incentives were billed after the complex care incentives were introduced. It is a result of this sustained trend that this study was conducted.
Summary of incentive programs in British Columbia

Proportion of primary care physicians who billed at least 1 chronic care or complex care incentive payment, and proportion of patients who had an incentive billed on their behalf, 2003/04 to 2013/14. Source: British Columbia Medical Services Plan (physician billing) information15 and author calculations.
Data sources
Consistent with previous analyses of the incentive programs,7,9 we used linked administrative data from Jan. 1, 2010, to Dec. 31, 2013, including the BC Medical Services Plan fee-for-service physician payment files,15 a registered patients file containing demographic information,16 physician demographic characteristics from the College of Physicians and Surgeons of British Columbia17 and data on all prescriptions filled in the province.18 Population Data BC provided all data for the study with unique, study-specific identification codes to ensure nonidentifiability of both physicians and patients. This study focuses on fee-for-service payment patterns and characteristics of physicians and patients enrolled in the BC Medical Services Plan, information that is completely captured in these databases.
Variable development
Primary care physicians
Our focus was physicians who provided community-based primary care. We limited analysis to primary care physicians who saw 100–6500 unique patients in a year. We chose the lower limit to exclude physicians who had very small fee-for-service practices, and the upper limit to exclude what are likely errors in the data, as 6500 represents seeing 25 unique patients 5 days per week for all 52 weeks of the year. We excluded physicians who billed any specialty consultation fee items (as this makes providers ineligible for the incentive fee items14), those who did not see any patients eligible for the incentives (which might happen, for example, in a focused practice) and those who were not assigned as a continuity provider for any patients (which eliminated physicians not providing the majority of primary care to the patients they see, as this may indicate working in walk-in clinics or locums). We assigned physicians as the regular provider to individual patients in cases in which they were the primary care provider seen most often, as measured by the highest number of visits. In case of a tie, we used highest dollars billed; if still tied, we used physician most recently visited. These methods are consistent with previous analyses in BC and elsewhere.7,19
Physician characteristics included age, sex and region of practice (according to the 5 health authority regions in BC).
Classifying other aspects of physician practice style
Other variables included total billings per year, number of unique patients and proportion of eligible patients for whom an incentive was billed. We defined eligible patients as those with conditions covered by the incentive program. Since the eligibility criterion for the incentive program was a diagnosis of the specified chronic disease, we required at least 2 physician diagnoses or 1 hospital diagnosis within a 2-year period, a validated methodology for how chronic disease is identified in administrative data.20,21 We chose this more conservative approach (2 physician diagnoses rather than 1 physician diagnosis) to ensure that all included patients were truly eligible. We also required patients to be eligible no later than Dec. 31, 2010, the first year of the study period. Once eligible, patients were deemed eligible over time; they did not have to qualify in each 2-year period.
We excluded patients who died during the study period, those who were not registered at least 275 days in each year of analysis, those who had no physician visits during the study period (since they would not have had an opportunity to have an incentive billed on their behalf), those who appeared (based on the data available) to be residing in long-term care at any point during the study period (as they use primary care differently and are not the main target of the incentive program) and those who were assigned a regular provider who was not part of the final physician cohort.
Patient characteristics included age, sex, health authority region of residence, neighbourhood income (defined by means of postal code of patient’s residence22) and number of incentive-eligible chronic conditions.
Classifying other aspects of health care use
Other patient variables were chosen based on previous analyses7,9 and hypothesized relations; these included encounters with primary care providers paid outside the fee-for-service system, total number of physician visits over the study period, total number of primary care physicians seen over the study period, the recency of eligibility for the incentives and continuity of care, measured with the usual provider continuity index23 (number of visits with the primary care physician seen most often divided by the total number of visits to all primary care physicians per year).
Statistical analysis
Descriptive analyses of eligible patients and physicians compared 3 groups: no incentives, incentives in some years and incentives in all years. For patients, this differentiated those who had incentives billed on their behalf consistently (i.e., in all 4 study yr), inconsistently (i.e., in some years) and not at all. For physicians, the groups differentiated those who billed incentive fee codes in all, some or none of the 4 study years. The main outcome of interest was the contrast between incentives in all 4 years versus incentives in no years. We used standardized differences in descriptive analyses to quantify differences between groups.
We used hierarchical regression models to identify the patient- and physician-level characteristics associated with incentives, with the outcome of receipt of incentive in all 4 years versus in no years. We used the SAS GLIMMIX procedure (SAS Institute) to estimate logistic regression models with random intercepts at the individual physician level. We used a logit link function and a binary distribution. Both patient-level and physician-level fixed effects were entered, and patients were nested within primary care physicians based on the primary care physician with whom they had the most contacts over the 4 years. We did not include any geographic clustering within the analysis. We used the median odds ratio (OR) as an alternative to the interclass correlation to describe variation across physicians, as recommended for logistic regression.24
Ethics approval
The University of British Columbia Behavioural Research Ethics Board approved this study.
Results
There were 578 907 patients eligible to receive incentives by the end of 2010. We excluded 96 239 patients who died during the study period or were not registered at least 275 days per year, 6355 patients who had no physician visits or only specialist visits, and 17 384 patients residing in long-term care. We also excluded 30 159 patients whose usual provider of care physician was excluded from the cohort of primary care physicians. This left a final cohort of 428 770 patients (Figure 2).
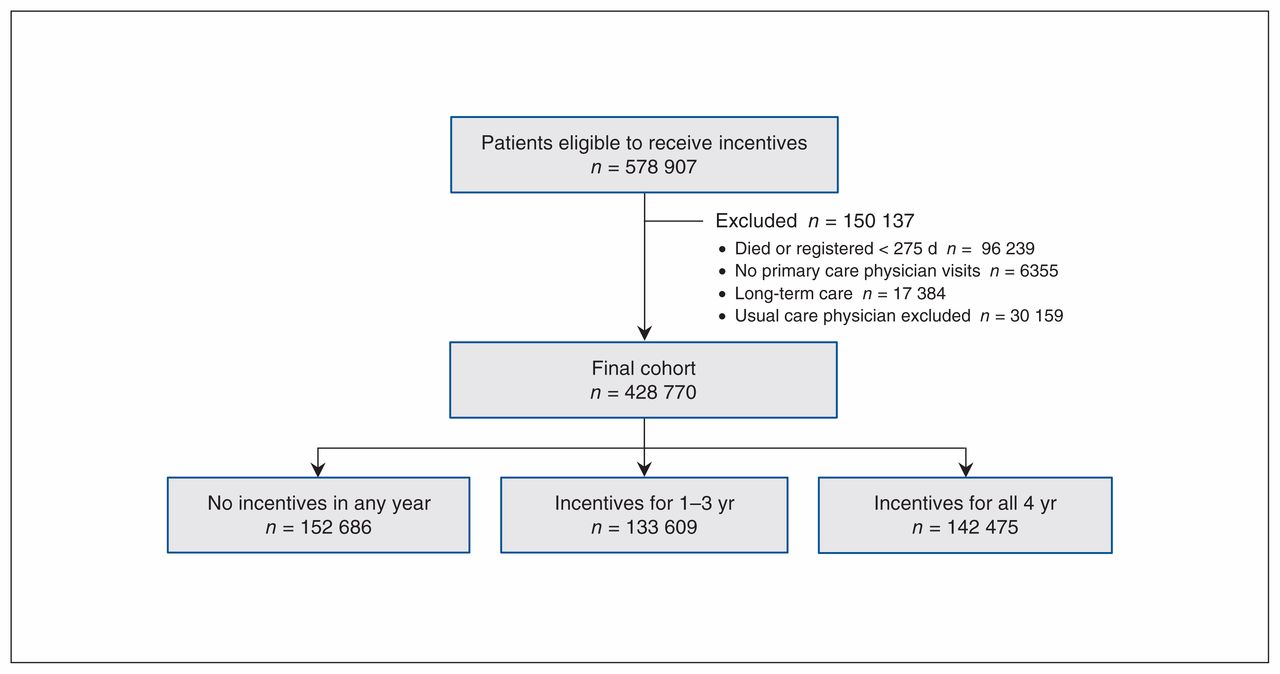
Flow diagram showing selection of patient cohort.
A total of 142 475 eligible patients (33.2%) had an incentive billed on their behalf in all 4 study years, and 152 686 (35.6%) never did (Table 2). There were more eligible males than females overall, but there was little difference between the sexes in the likelihood of being in the allyears–incentive versus no-incentive group. Age was positively associated with having an incentive billed in all 4 years, even within a population of eligible patients (standardized difference for age overall = 0.66). Standardized differences for geographic region, socioeconomic status, number of different primary care physicians seen over the 4 years, whether there was contact with a non–fee-for-service physician and number of years since the patient was eligible for incentives were all small. Standardized differences were moderate for continuity of care, and were large for number of eligible conditions and overall number of primary care physician visits.
Characteristics of patients who had incentives billed on their behalf in all, some or none of the study years, 2010–2013
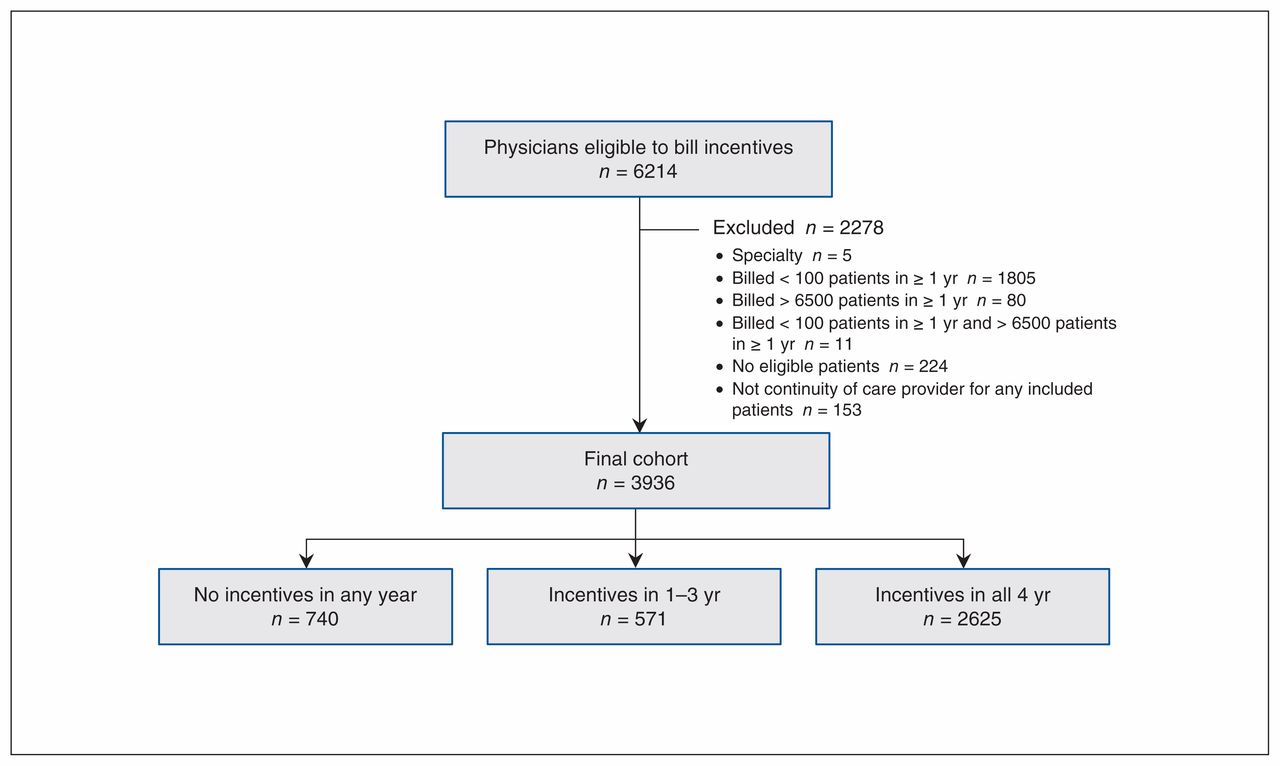
There were 6214 physicians eligible to bill incentives during the study period. We excluded 5 physicians who billed specialty consultations, 1896 who billed fewer than 100 (n = 1805) or more than 6500 (n = 80) unique patients in a year, 224 who did not see any patients eligible for incentives and 153 who were not matched as a continuity of care provider to any patients in the final cohort. This left a total cohort of 3936 primary care physicians (Figure 3).

Flow diagram showing selection of physician cohort.
Two-thirds of physicians (2625 [66.7%]) billed at least 1 incentive in each of the 4 study years, 571 (14.5%) billed in 1–3 years, and 740 (18.8%) billed no incentives during the study period (Table 3). Overall, the 4-year group billed incentives for an average of 30.7% of eligible patients seen, compared to 5.7% for the 1- to 3-year group and (by definition) 0% for the nonincentive group. Those who billed in all 4 years had higher average total payments than the other physician groups, but otherwise standardized differences between the groups were small.
Physician and practice characteristics for those who billed incentives in all, some or none of the study years, 2010–2013
Regression results showed that male patients had higher odds than female patients of having an incentive billed on their behalf (OR 1.42, 95% confidence interval [CI] 1.39–1.45), as did older patients (e.g., OR for ≤ 17 yr 0.04, 95% CI 0.03–0.05), those residing in less metropolitan health authorities (e.g., OR for Northern Health 1.68, 95% CI 1.36–2.06), those in lower-income neighbourhoods (OR 1.15 [95% CI 1.11–1.19] for lowest v. highest quintile) and those eligible for more incentives at the start of the study period (e.g., OR for 4 incentives 5.87, 95% Cl 5.00–6.89) (Table 4). The likelihood of having incentives billed increased with increased number of primary care physician visits (OR for > 48 contacts 134.77, 95% CI 112.27–161.78) but declined with increasing number of different primary care physicians seen (e.g., OR 0.82 [95% CI 0.78–0.85] for ≥ 5 v. 1–2). Continuity of care had a positive association with incentives, with an OR of 1.31 (95% CI 1.30–1.32) for each increase of 0.1 on a scale of 0–10.
Hierarchical regression model results*
Male physicians were less likely to bill incentives than female physicians (OR 0.86, 95% CI 0.77–0.95) (Table 4). The likelihood of billing incentives decreased with increasing physician age (e.g., OR 0.83 [95% CI 0.74–0.94] for 55–64 yr v. 45–54 yr). Patients were more likely to have an incentive billed on their behalf if they saw physicians who had higher participation, as measured by the proportion of eligible patients for whom an incentive was billed (e.g., OR 42.38 [95% CI 34.55–52.00] for quartile 4 v. quartile 1).
Interpretation
The only hypothesis supported by these analyses is that seeing fewer different primary care providers and higher continuity of care are both associated with a higher likelihood of having an incentive billed. Patients without an incentive billed on their behalf, however, did see physicians who billed incentives, so the absence of incentive billing is not a matter of a mismatch between providers and patients. Perhaps more important, characteristics of both patients and physicians were strongly associated with billing of incentives.
The association between a larger number of different primary care physicians seen and lower likelihood of an incentive may reflect that, where care is dispersed, no primary care provider feels ownership of or responsibility for an ongoing relationship with a patient. The very strong association with number of visits, however, suggests that physicians may be prompted to bill the incentives when patients come into their office but are without a systematic population health management approach to managing their entire patient panel and identifying all patients with chronic conditions in their practice. 25 Given that the incentives are intended for all eligible patients, not just those who make the most visits, further research should test this hypothesis, as there is evidence that population health management results in higher-quality care.26,27
The fact that younger physicians and female physicians were more likely to bill incentives suggests age and sex differences in the chosen form or type of practice. Previous studies identified both cohort effects and gender effects in practice style,28–30 but less is known about the drivers of these differences and whether they could be mitigated.
Limitations
As this study used only administrative data, we lacked information from patients as to whom they perceived their usual provider to be. Similarly, we lacked physician perspectives on their patient cohort. We were unable to differentiate patient choice from system factors, such as whether patients saw more primary care physicians because that is their preference or because they could not find a regular provider of care. We were not able to measure complexity of condition other than through counting the number of comorbidities. All of these variables would have added to the study but are not collected routinely. To our knowledge, there have been no validation studies related to incentive fee items; however, these data have been used in previous analyses.7,9
This was a population-based study in BC, so it is representative of that population and generalizable to the BC context. Beyond the BC setting, our conclusions may be generalizable in the context of fee-based incentives and the potential for this form of operational reform to achieve desired outcomes.
Conclusion
The strongest predictors of having an incentive billed on a patient’s behalf were the number of primary care physician contacts a patient had and the percentage of eligible patients for whom the primary care physician billed incentives. These findings are consistent with the notion that physicians are identifying and billing for eligible patients based on whom they see most often. Further research should identify the extent to which population health management is used by clinicians in Canada. The lack of billing of incentives may be a symptom of broader issues in primary care. It should be a priority to find out whether that is the case.
Footnotes
Competing interests: None declared.
This article has been peer reviewed.
Contributors: All of the authors contributed to the study conception and design, analyzed and interpreted the data, drafted the manuscript and revised it critically for important intellectual content, approved the final version to be published and agreed to be accountable for all aspects of the work.
Funding: This study was supported by project grant MOP-126008 from the Canadian Institutes of Health Research.
Data sharing: Data used in this article were derived from administrative health and social data as a secondary use. The data were provided under specific data-sharing agreements only for approved research use at Population Data BC. The original source data is not owned by the researchers or Population Data BC and as such cannot be provided to a public repository. The original data sources have been noted and referenced in the methods section of the article. Where necessary, source data specific to this article or project may be reviewed at Population Data BC with the consent of the original data providers, along with the required privacy and ethical review bodies.
Disclaimer: All inferences, opinions and conclusions drawn in this paper are those of the authors and do not reflect the opinions or policies of the data stewards.
Supplemental information: For reviewer comments and the original submission of this manuscript, please see www.cmajopen.ca/content/8/2/E319/suppl/DC1.
References
- Copyright 2020, Joule Inc. or its licensors
In this issue

Article tools


