


Abstract
Background: Most health care spending is concentrated within a small group of high-cost health care users. To inform health policies, we examined the characteristics of index hospital admissions and their predictors among incident older high-cost users compared to older non–high-cost users in Ontario.
Methods: Using Ontario administrative data, we identified incident high-cost users aged 66 years or more and matched them 1:3 on age, gender and Local Health Integration Network with non–high-cost users aged 66 years or more. We defined high-cost users as patients within the top 5% most costly high-cost users during fiscal year 2013/14 but not during 2012/13. An index hospital admission, the main outcome, was defined as the first unplanned hospital admission during 2013/14, with no hospital admissions in the preceding 12 months. Descriptively, we analyzed the attributes of index hospital admissions, including costs. We identified predictors of index hospital admissions using stratified logistic regression.
Results: Over half (95 375/175 847 [54.2%]) of all high-cost users had an unplanned index hospital admission, compared to 8838/527 541 (1.7%) of non–high-cost users. High-cost users had a poorer health status, longer acute length of stay (mean 7.5 d v. 2.9 d) and more frequent designation as alternate level of care before discharge (20.8% v. 1.7%) than did non–high-cost users. Ten diagnosis codes accounted for roughly one-third of the index hospital admission costs in both cohorts. Although many predictors were similar between the cohorts, a lower risk of an index hospital admission was associated with residence in long-term care, attachment to a primary care provider and recent consultation by a geriatrician among high-cost users.
Interpretation: The high prevalence of index hospital admissions and the corresponding costs are a distinctive feature of incident older high-cost users. Improved access to specialist outpatient care, home-based social care and long-term care when required are worth further investigation.
Most public health care spending is concentrated within a small group of patients.1 The top 5% most costly patients, referred to as the high-cost health care users, accounted for 61.1% of all publicly funded health care expenditures in Ontario, which amounted to $55.9 billion in 2016/17.2,3 Older high-cost users represent 60% of the overall high-cost user population.2 Since about two-thirds of the costs among older high-cost users are accrued through hospital admissions,2,4–6 a detailed examination of older high-cost users admitted to hospital is warranted.
Currently, there is limited information on several key aspects of hospital admissions among older high-cost users, such as 1) the first admission, as opposed to readmission, since the first (or index) admission is the most important predictor of subsequent admissions, which, in older adults, may indicate a point where management efforts are less successful,7–9 2) the contribution of individual conditions to the financial burden of admission, which would help programs identify clinical drivers of the highest inpatient expenditures that are potentially divertible by managing risk factors, 3) outcomes of admission, such as inpatient mortality, and 4) characteristics of incident high-cost users as opposed to prevalent high-cost users, which would allow identification of the factors that influence the transition to high-cost user status. More specifically, although sociodemographic and health attributes of older high-cost users have been reported in Canada and elsewhere,1,10–12 little is known about the health care of this population before they become high-cost users, especially in Canada, and how these attributes compare to those of non–high-cost users.
Given health care planners’ growing concern over the escalating costs and challenges in managing high-cost users,13 a better characterization of the first unplanned hospital admission among incident older high-cost users is a timely exercise with important implications for health policies aimed at curbing health care costs or reallocating resources. The objectives of the current study were therefore to describe attributes of the first unplanned hospital admission in the year of becoming a high-cost user among incident older high-cost users and compare them to those of non–high-cost users, and to determine predictors of these admissions in the 2 cohorts.
Methods
Design and population
We conducted a retrospective population-based matched cohort study using 2 years of provincial patient data. The 2013/14 Ontario government fiscal year was considered the incident year, and the 2012/13 fiscal year was the baseline, or preincident, year.
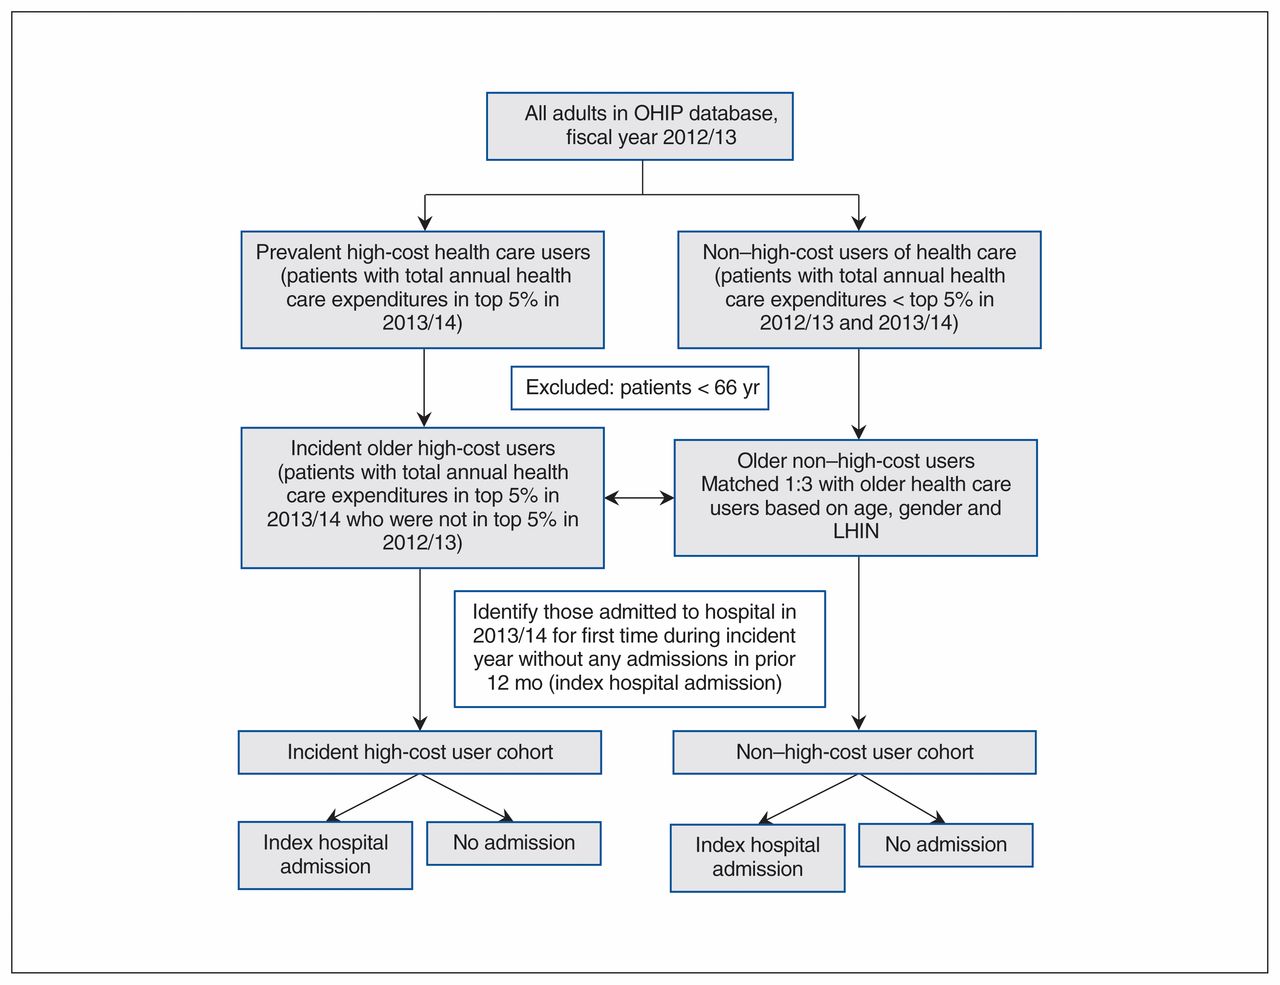
We defined incident older high-cost users as people aged 66 years or more with annual total health care expenditures within the top 5% threshold of all Ontarians in 2013/14 who were not in the top 5% in 2012/13. The 5% threshold is commonly used in studies of high-cost users in Canada and elsewhere. 5,6,10,14 Older non–high-cost users were Ontarians with annual total health care expenditures in both 2012/13 and 2013/14 less than the top 5% threshold. We matched the incident high-cost user cohort with non–high-cost users in a ratio of 1:3 according to age at cohort entry (± 1 mo), sex and Local Health Integration Network (health district) of patient residence. We applied the age threshold of 66 years to capture prescription numbers and costs for at least 1 year before 2013/14, as Ontario Drug Benefits eligibility begins at the age of 65. Figure 1 presents the patient flow.

Flow chart showing cohort identification. Note: LHIN = Local Health Integration Network, OHIP = Ontario Health Insurance Plan.
Data sources
We created the individual-level data set using health administrative databases from Ontario housed at ICES. These databases, which are subject to data quality assessments,15 contain linkable records of publicly funded health care services for the Ontario population eligible for health coverage. We derived basic demographic information from the Ontario Registered Persons Database. We obtained the health status and comorbidities of the study population from several sources, including the Canadian Institute for Health Information Discharge Abstract Database, National Ambulatory Care Reporting System, and ICES-derived and -validated cohorts. We measured health care characteristics using the Ontario Health Insurance Plan (physician visits), Home Care Database (home care visits), Ontario Drug Benefit Plan (number of prescriptions) and Discharge Abstract Database (admission attributes). Appendix 1 (available at www.cmajopen.ca/content/7/3/E537/suppl/DC1) provides more detail on the data sources. We calculated health care expenditures using ICES person-level costing algorithms based on a costing methodology that links data on use of health care resources from administrative databases and costs collected by the provincial public payer.16 Costs were expressed in 2013 Canadian dollars. More details on the study design and data sources were published as a study protocol elsewhere.17
Patient characteristics
The study population was characterized by several variables, all of which can be grouped into 3 major categories. The sociodemographic status was described by age, sex, low income status, place of residence (urban v. rural) and history of recent immigration. Health status was primarily described by the number of Johns Hopkins Aggregate Diagnosis Groups that the patient was assigned.18 Also, we used Johns Hopkins Expanded Diagnosis Clusters to construct additional variables such as a history of hypertension or malignant disease to describe health status. Finally, health care characteristics in the baseline year included the number of prescriptions and health care visits and placement with a long-term facility. The variables are briefly summarized in Appendix 1.
Unplanned index hospital admissions
We defined patients with an unplanned index hospital admission, the main outcome, as people who had not been admitted to hospital for at least 12 months before their first acute inpatient hospital admission in 2013/14. The 12-month window ensured that the index hospital admission was less likely to be associated with a recent admission and therefore represents the first hospital admission event in the incident year contributing to the costs. We defined unplanned index hospital admissions as nonelective admissions, as recorded in the Discharge Abstract Database. We used the International Statistical Classification of Diseases and Related Health Problems, 10th revision, enhanced Canadian version (ICD-10-CA) diagnosis code most responsible for resource use to define the reason for each hospital admission. Each hospital admission recorded in the study consisted of the acute care portion and alternate level of care (patients who no longer require acute care but who occupy a hospital bed while awaiting placement in another health care facility19). We did not measure pre- and postadmission time, i.e., we did not account for time spent in the emergency department before hospital admission, or time in care at home or in other facilities after discharge from hospital. We summarized the acute portion of each hospital length of stay as the mean number of the days of the hospital stay. We also calculated the proportion of patients who were admitted to a teaching facility and the proportion who resided in a Local Health Integration Network different from the hospital Local Health Integration Network (Appendix 1). We calculated costs of the index hospital admission using ICD-10-CA diagnosis codes. We defined inpatient mortality as all-cause in-hospital mortality among the subset of patients who had an unplanned index hospital admission. In addition, we calculated the number of days patients were in hospital before death.
Statistical analysis
Descriptive analysis
We first compared the patient characteristics of the 2 cohorts in 2012/13 by measuring the absolute standardized difference (ASD). An ASD value of 0.1 or greater indicates a meaningful difference.20 We then described the attributes of the unplanned index hospital admissions among incident high-cost users versus non–high-cost users in terms of the acute portion of each hospital length of stay, ALC, discharge disposition and in-hospital death. Third, we determined the most common clinical causes of admission and their associated costs for both cohorts. We also computed the cumulative percentage of the total costs of the unplanned index hospital admissions using ICD-10-CA diagnosis codes and the average annual costs for each diagnosis.
Predictive analysis
We used logistic regression, 1 model for either cohort, to identify independent predictors of an unplanned index hospital admission. For both models, an index hospital admission event was the binary dependent variable. The list of potential predictors (independent variables) consisted of sociodemographic, health status and health care characteristics measured in 2012/13 that are described under the corresponding sections of Appendix 1. Odds ratios (ORs) and 95% confidence intervals (CIs) were reported. We included all relevant variables in the models regardless of their statistical significance. We assessed model discrimination using the C-statistic, where a C-statistic value of 0.70 or greater indicates good discrimination.21 We evaluated the model’s ability to predict subgroups of patients with a differing risk of index hospital admission.22,23 We validated the models by means of cross-validation24 and checked them for multicollinearity. Additional information on the statistical methods is provided in Appendices 2 and 3, available at www.cmajopen.ca/content/7/3/E537/suppl/DC1. For sensitivity analysis, we reran the models individually on the 5 most costly conditions in both cohorts, examining the effect on predictor estimates (Appendix 4, available at www.cmajopen.ca/content/7/3/E537/suppl/DC1).
Ethics approval
This study was approved by the Hamilton Integrated Research Ethics Board.
Results
Baseline patient characteristics
The total study population consisted of 703 388 patients, of whom 175 847 were incident high-cost users. The average age was 77.7 years. In both cohorts, 53.0% of patients were women. Patients resided predominantly in suburban areas (Table 1). Compared to non–high-cost users, high-cost users were sicker (mean number of Aggregate Diagnosis Groups 10.2 v. 7.9%, ASD 0.54) and were dispensed a higher mean number of medications (8.4 v. 5.6, ASD 0.6) in the year preceding the index year, and a higher proportion visited their primary care provider (95.6% v. 84.3%, ASD 0.38), received specialty care (89.8% v. 74.2%, ASD 0.41) and received home care services. High-cost users were more likely than non–high-cost users to have a primary care provider (97.0% v. 88.6%, ASD 0.33). Almost one-third (31.8%) of high-cost users visited an emergency department, compared to 19.3% of non–high-cost users (ASD 0.29). A higher proportion of non–high-cost users than high-cost users were recent immigrants (4.3% v. 2.4%, ASD 0.11). The study cohorts were otherwise similar.
Characteristics of high-cost health care users and non–high-cost users in the preincident year
Characteristics of unplanned index hospital admission
Unplanned index hospital admissions accounted for 71.2% and 82.1% of index hospital admissions among high-cost users and non–high-cost users, respectively. More than half (95 375 [54.2%]) of high-cost users had an unplanned index hospital admission, compared to 8838 non–high-cost users (1.7%) (Table 2). Compared to non–high-cost users, high-cost users had a longer hospital stay (mean acute portion of each hospital length of stay 7.5 d v. 2.9 d, ASD 0.73), were designated ALC status in higher numbers (20.8% v. 1.7%, ASD 0.64) and, once transferred to ALC, had a relatively greater number of ALC days (2.97 v. 0.06, ASD 0.32). A total of 23.0% of high-cost users were transferred to another acute care or long-term care facility, compared to 1.3% of non–high-cost users, whereas most non–high-cost users (83.6%) were discharged home (with or without support). There was a striking difference in inpatient mortality between the cohorts: non–high-cost users were more than twice as likely as high-cost users to die in hospital (13.9% v. 5.6%, ASD 0.28), despite the high-cost users’ longer mean acute portion of each hospital length of stay. Among those who died in hospital, non–high-cost users had a substantially shorter stay before death than high-cost users (2.3 d v. 16.1 d, ASD 0.97).
Characteristics of unplanned index hospital admissions
Index hospital admission costs
Unplanned index hospital admissions accounted for 74.4% of the costs associated with all index hospital admissions (unplanned plus elective) during the year of study among high-cost users and 81.3% of these costs among non–high-cost users. The total 1-year inpatient cost associated with unplanned index hospital admissions was $1.2 billion for high-cost users and $33.1 million for non–high-cost users. The average cost per patient associated with unplanned index hospital admissions was $12 471 (standard deviation $19 935) and $3749 (standard deviation $1290), respectively. Ten conditions accounted for roughly one-third (36.4% among high-cost users and 35.3% among non–high-cost users) of the costs (Tables 3 and 4). Acute myocardial infarction (7.8%) was the leading most costly reason of the index hospital admission among high-cost users, whereas pneumonia (5.9%) was the leading most costly reason of the index hospital admission among non–high-cost users. Five conditions (cerebral infarction, congestive heart failure, pneumonia, chronic obstructive pulmonary disease and ileus/intestinal obstruction) were among the 10 most costly conditions in both cohorts. The costliest conditions were also the most frequent causes of unplanned hospital admissions in both cohorts.
Ten most expensive conditions among high-cost users with unplanned index hospital admissions
Ten most expensive conditions for non–high-cost users with unplanned index hospital admissions
Predictors of unplanned index hospital admission
Overall, the direction, magnitude and significance of ORs were similar across the 2 cohorts for many of the predictors of an unplanned index hospital admission (Table 5). Predictors specific to the high-cost user cohort included having visited a geriatrician in the previous year and living at a long-term care facility. Both were associated with lower odds of an index hospital admission (OR 0.80, 95% CI 0.76–0.86 and OR 0.29, 95% CI 0.25–0.34, respectively). Among non–high-cost users, recent immigrants had lower odds of an index hospital admission (OR 0.72, 95% CI 0.62–0.84). In contrast to many predictors with a low magnitude of association, the home care services category “other” for high-cost users had a protective effect against an index hospital admission (OR 0.94, 95% CI 0.93–0.94). Since this variable was constructed to include a combination of social services, respite care and case management, it was impossible to identify the impact of each of these services alone. Finally, incident high-cost users who had a primary care provider were at lower risk for an index hospital admission, whereas among non–high-cost users, attachment to a provider was associated with an increase in index hospital admissions.
Predictors of unplanned index hospital admission
Interpretation
By examining the first hospital admission during the incident year among new older high-cost users compared to non–high-cost users matched on age, sex and health district in Ontario, we found that unplanned index hospital admissions were much more common among high-cost users, with more than half having an unplanned index hospital admission, compared to less than 2% of non–high-cost users. Ten conditions, many of which have known remediable risk factors for hospital admission,25–29 accounted for a large number of these admissions and one-third of their costs. Besides a greater admission rate, incident high-cost users had longer hospital stays and were frequently designated as ALC. Also, high-cost users who died in hospital had an average hospital stay of more than 2 weeks, which suggests a terminal disease stage. Finally, our findings indicate that, despite a few predictors (e.g., visits to a geriatrician or attachment to a primary care provider) that were unique to either cohort, there were many similarities in baseline predictors of the first unplanned admission between the 2 cohorts, including health care received before the incident year. The fact that incident high-cost users who had a primary care provider were at lower risk for hospital admission whereas among non–high-cost users, attachment to a provider was associated with an increase in index hospital admissions may reflect the existence of subgroups of “orphan” patients who differ based on severity of illness, personality type, social circumstance or, among high-cost users, access to primary care.30
Any comparison of our results with other studies is challenging owing to methodological heterogeneity such as the lack of differentiation between the category of admission (unplanned v. elective), inclusion of readmissions or use of a different high-cost user threshold (e.g., top 1%). However, our results are consistent with previous research in several aspects. First, our list of the most frequent and most costly disease codes is overall in line with prior limited studies on older high-cost users from Canada and elsewhere that examined the financial contribution of individual conditions: cardiovascular, orthopedic and infectious diseases are predominant reasons for admissions.6,31 Furthermore, the risk of unplanned hospital admissions among community-dwelling older adults was examined by means of several models from various jurisdictions.9 Similar to our results, older age, male sex, visits to the emergency department and prevalent chronic conditions were associated with higher odds of admission. Our findings support earlier reports of the “healthy immigrant effect:”32 recent immigrants were less likely than those who had been in Canada longer to become high-cost users or have an index hospital admission. In contrast to previous studies of the general older population that suggested residence at a nursing home as a predictor of future admission, especially for fracture,33,34 in the current study, living in a long-term care facility was associated with lower risk of unplanned index hospital admissions among incident high-cost users.
Strengths and limitations
Key strengths of this study include its population-based matched design and examination of poorly studied aspects of the population of older high-cost users in the Canadian context. Our study also has limitations. The discriminatory power of the models was only fair, although the C-statistic values were close to those in several previously reported risk prediction models in the general older population.9 Running the models with more homogeneous subgroups of patients (e.g., chronic obstructive pulmonary disease, heart failure) improved model discrimination (e.g., C-statistic > 0.7), especially for high-cost users (Appendix 4), and these results were consistent with the main analyses. Furthermore, some findings are based on variables with low prevalence: long-term care residence (n = 836 [0.5%]) and geriatrician visits (n = 4974 [2.8%]); however, this is relative to the very large size of the study population. The study focused only on unplanned index hospital admissions rather than including elective admissions. This limits the generalizability of our results to all hospital admissions, but unplanned admissions accounted for more than 70% of admissions in both cohorts. Also, we did not undertake a validation study for the ICD-10-CA diagnosis codes used. However, analysis of the Discharge Abstract Database data using the codes has become a standard methodology in Canada.6,35–37 Validation studies examining clinical coding practices have been performed previously and have shown that coding was done with satisfactory accuracy.38 Furthermore, we note a risk of residual confounding. Although the 2 cohorts were comparable in age, sex and Local Health Integration Network, as per the study protocol, differences were observed between the cohorts with respect to other variables. The rationale for matching on only 3 covariates was to ensure comparability on selected important factors while both maximizing sample size and generalizability, and being able to explore predictors of index hospital admissions in our regression analyses. Despite this, our analysis may have been influenced by residual confounding owing to our inability to capture and adjust for unmeasured variables such as marital status, frailty or lifestyle factors. We also did not explore hospital clustering effects; although worthwhile pursuing in the future, it was beyond the scope of this study. Finally, our modelling is exploratory: the results suggest association but certainly not causation.
Conclusion
The high prevalence of unplanned index hospital admissions and the corresponding costs driven partly by longer lengths of stay for acute care and more ALC are a distinctive feature of older incident high-cost users. The effect of improved access to specialist outpatient care, home-based social care and long-term care when required in avoiding index hospital admissions warrants further research, especially among the most costly conditions.
Footnotes
Competing interests: None declared.
This article has been peer reviewed.
Contributors: Sergei Muratov, Jean-Eric Tarride, Anne Holbrook, Justin Lee, Michael Paterson, Tara Gomes and Wayne Khuu conceptualized the study. Michael Paterson, Wayne Khuu, Priscila Pequeno and Tara Gomes created the data set. Sergei Muratov analyzed the data, with support from Jean-Eric Tarride, Priscila Pequeno, Jason Guertin and Lawrence Mbuagbaw. Sergei Muratov drafted the manuscript. All of the authors contributed to the study design, critically revised the manuscript for important intellectual content, approved the version to be published and agreed to be accountable for all aspects of the work.
Funding: This work was supported by in-kind support from the Ontario Drug Policy Research Network (ODPRN) and by personnel awards from the Canadian Institutes of Health Research (CIHR) Drug Safety and Effectiveness Cross-Disciplinary Training Program, the Program for Assessment of Technology in Health, The Research Institute of St. Joe’s Hamilton, St. Joseph’s Healthcare Hamilton and an Ontario Graduate Scholarship. The work was also supported by ICES, an independent research institute funded by the Ontario Ministry of Health and Long-Term Care (MOHLTC). The ODPRN is funded by grants from the Ontario MOHLTC and the Ontario Strategy for Patient-Oriented Research Support Unit, which is supported by CIHR and the Province of Ontario.
Disclaimer: Parts of this material are based on data and information compiled and provided by the Canadian Institute for Health Information (CIHI) and Immigration, Refugees and Citizenship Canada (IRCC). However, the analyses, conclusions, opinions and statements expressed herein are those of the authors and not necessarily those of CIHI or IRCC. The opinions, results and conclusions reported in this article are those of the authors and are independent from the funding sources. No endorsement by ICES or the Ontario MOHLTC is intended or should be inferred.
Supplemental information: For reviewer comments and the original submission of this manuscript, please see www.cmajopen.ca/content/7/3/E537/suppl/DC1.
References
- Copyright 2019, Joule Inc. or its licensors
In this issue

Article tools


