


Article Figures & Tables
Figures
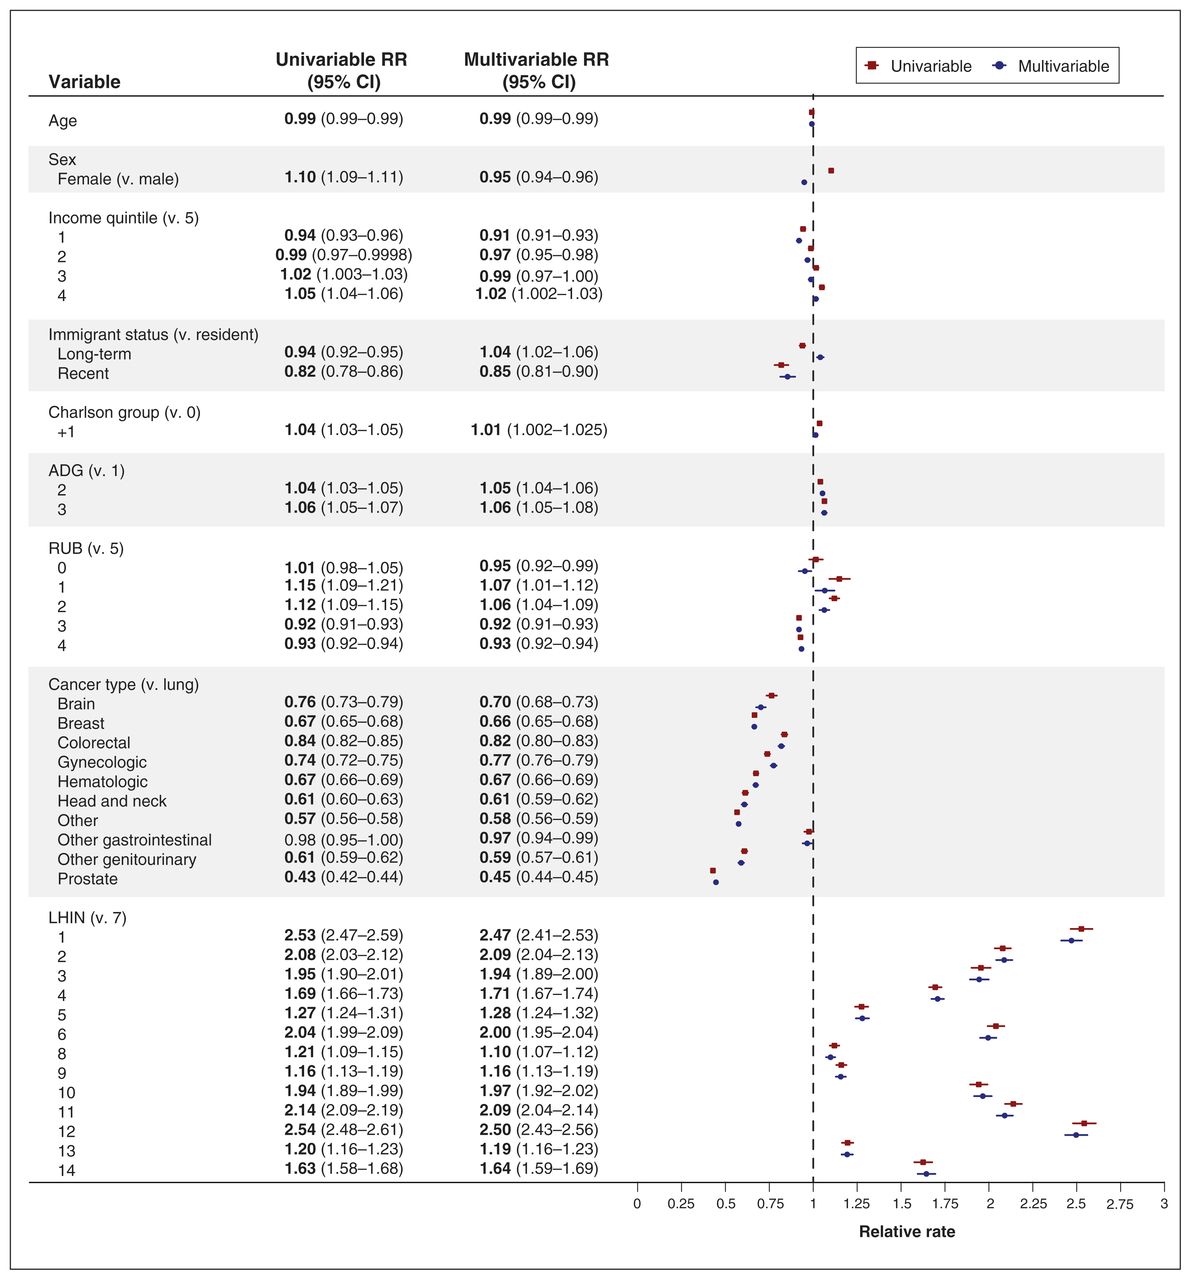
- Figure 1:
Negative binomical generalized estimating equations (GEE) output. Note: ADG = Aggregated Diagnosis Group, CI = confidence interval, RUB = resource utilization band. The local health integration networks (LHINs) are as follows: LHIN 1 = Erie St. Clair, LHIN 2 = South West, LHIN 3 = Waterloo Wellington, LHIN 4 = Hamilton Niagara Haldimand Brant, LHIN 5 = Central West, LHIN 6 = Mississauga Halton, LHIN 7 = Toronto Central, LHIN 8 = Central, LHIN 9 = Central East, LHIN 10 = South East, LHIN 11 = Champlain, LHIN 12 = North Simcoe Muskoka, LHIN 13 = North East, LHIN 14 = North West.
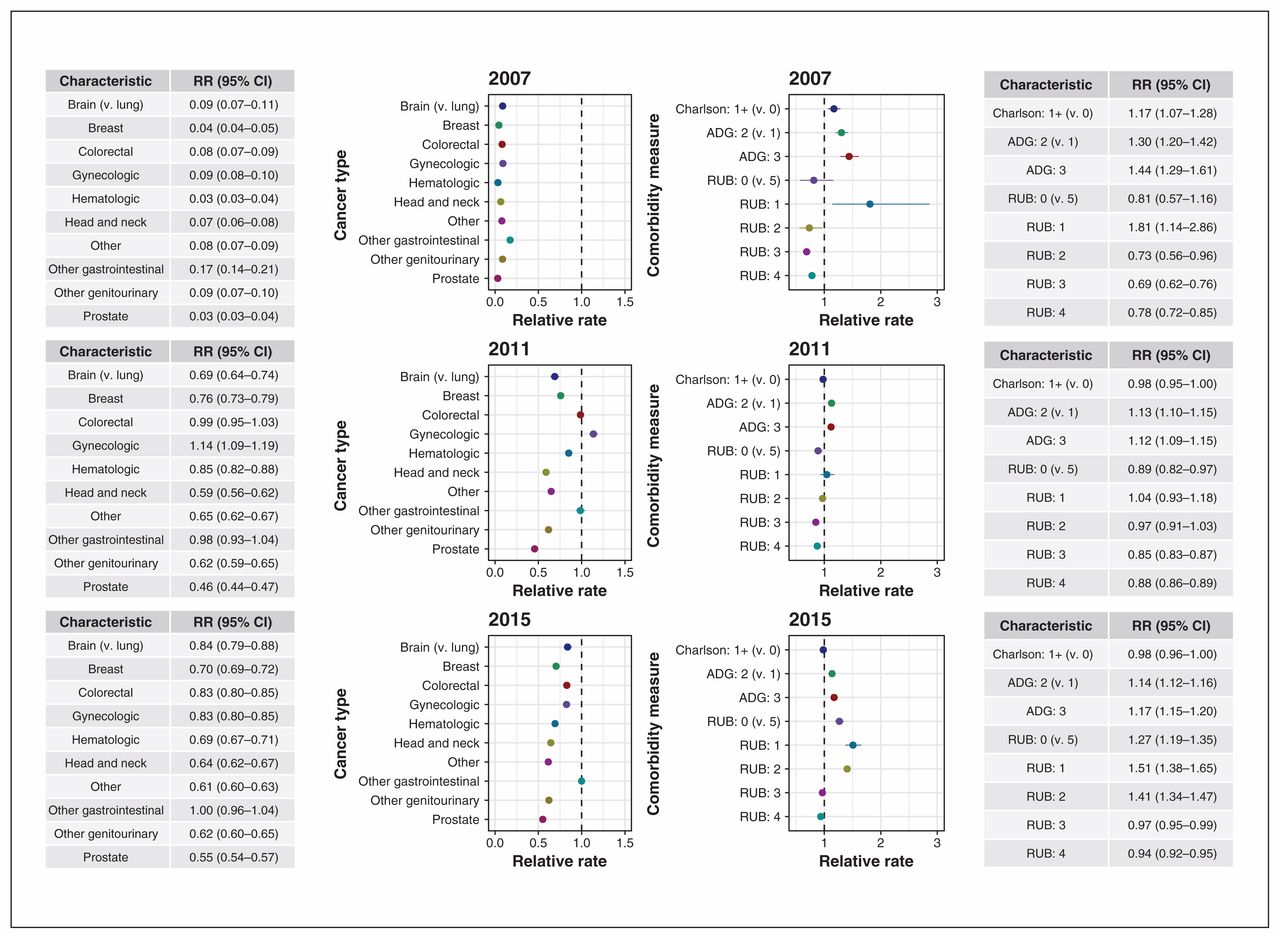
- Figure 2:
Relative rates of Edmonton Symptom Assessment System (ESAS) uptake from multivariable regression model for cancer type and comorbidity. Note: ADG = Aggregated Diagnosis Group, CI = confidence interval, RUB = resource utilization band.
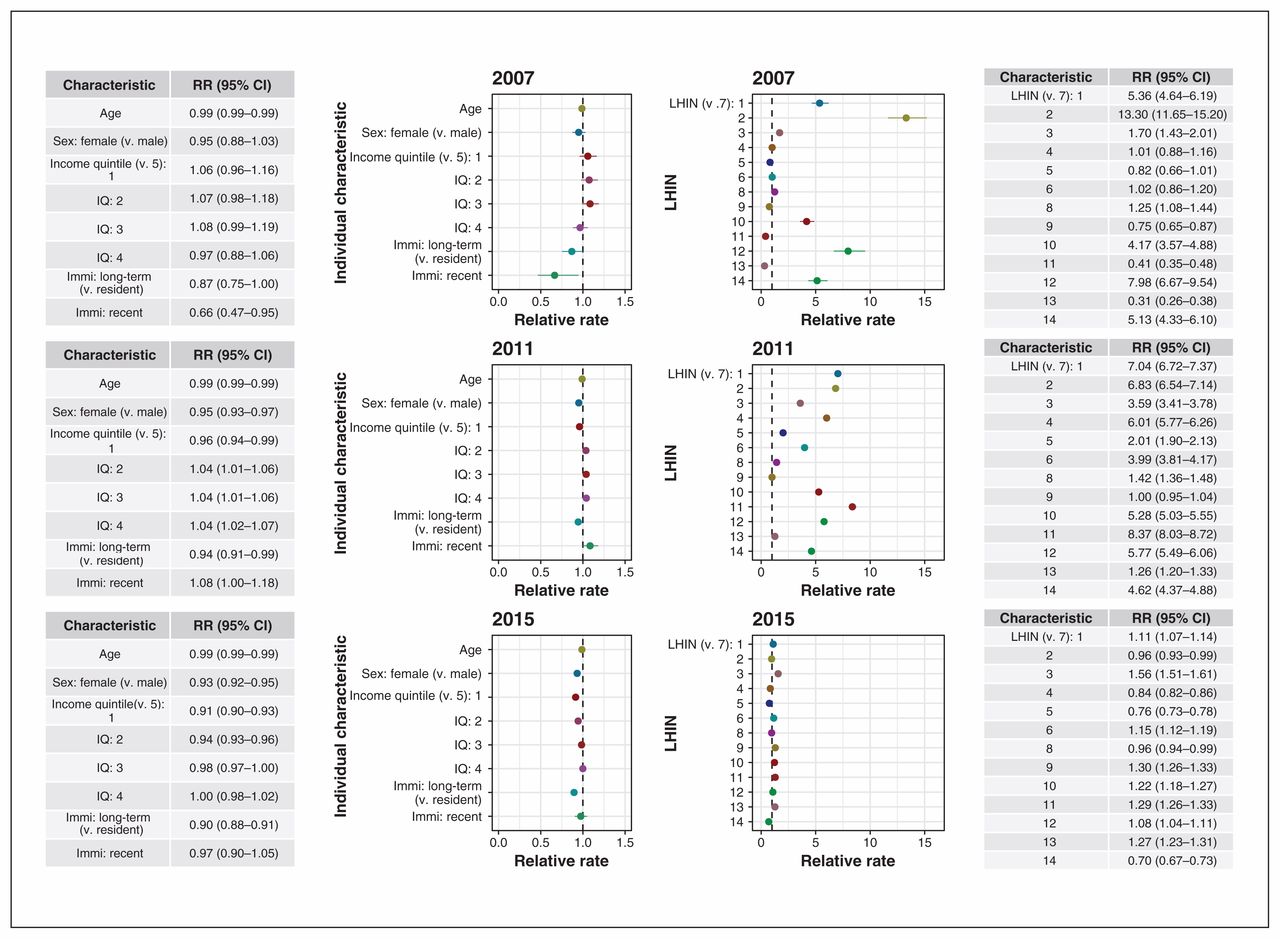
- Figure 3:
Relative rates of Edmonton Symptom Assessment System (ESAS) uptake from multivariable regression model for age, sex, income quintile, immigration status and region (local health integration network; LHIN). Note: CI = confidence interval, Immi = Immigration, IQ = income quintile. The LHINs are as follows: LHIN 1 = Erie St. Clair, LHIN 2 = South West, LHIN 3 = Waterloo Wellington, LHIN 4 = Hamilton Niagara Haldimand Brant, LHIN 5 = Central West, LHIN 6 = Mississauga Halton, LHIN 7 = Toronto Central, LHIN 8 = Central, LHIN 9 = Central East, LHIN 10 = South East, LHIN 11 = Champlain, LHIN 12 = North Simcoe Muskoka, LHIN 13 = North East, LHIN 14 = North West.


Tables
Characteristic No. (%)* Overall 525 409 (100) Age Mean 64.37 Median (IQR) 65 (56–75) Sex Female 274 476 (52) Male 250 993 (48) Income quintile 1 93 866 (18) 2 103 577 (20) 3 103 228 (20) 4 109 642 (21) 5 (wealthiest) 115 096 (21) Immigration status Long-term 37 114 (7) Recent 6104 (1) Nonimmigrant 482 191 (92) Type of cancer Brain 8119 (2) Breast 111 543 (21) Colorectal 54 871 (10) Gynecologic 35 022 (7) Hematologic 52 609 (10) Head and neck 20 277 (4) Lung 50 541 (10) Other 67 268 (13) Other gastrointestinal 21 048 (4) Other genitourinary 24 552 (5) Prostate 79 559 (15) Region Erie St. Clair 30 053 (6) South West 40 377 (8) Waterloo Wellington 24 625 (5) Hamilton Niagara Haldimand Brant 64 800 (12) Central West 21 872 (4) Mississauga Halton 36 791 (7) Toronto Central 44 241 (8) Central 59 952 (11) Central East 60 268 (11) South East 25 102 (5) Champlain 53 126 (10) North Simcoe Musksoka 21 124 (4) North East 30 542 (6) North West 12 536 (2) Charlson score 0 462 189 (88) ≥ 1 63 220 (12) ADG score 1–5 188 057 (36) 6–10 235 163 (45) ≥ 10 102 189 (19) RUB score 0 14 701 (3) 1 6380 (1) 2 27 597 (5) 3 219 284 (42) 4 135 096 (26) 5 122 351 (23) Note: ADG = Aggregated Diagnosis Group, IQR = interquartile range, RUB = resource utilization band.
↵* Unless indicated otherwise.
In this issue

Article tools


Related Articles
Cited By...
- No citing articles found.