


Abstract
Background: Expenditure on systemic therapy for cancer has been increasing quickly owing to population growth, increased use, both in the number of users and in prescription volume, and rising drug prices. Our objective was to describe trends in expenditure in British Columbia and Saskatchewan’s cancer care systems and to elucidate these drivers of growth.
Methods: In this trend analysis, we obtained pharmacy dispensing records from the BC Cancer and Saskatchewan Cancer Agency pharmacies for all anticancer therapies dispensed in 2006–2013. We calculated total annual expenditure directly from the data and conducted a trend analysis of crude and standardized annual expenditure using generalized linear models. We estimated trends in the following components of total expenditure: cancer incidence, number of systemic therapy users per incident case, number of dispensed prescriptions per user and cost per prescription. Analysis was stratified by patient age group, cancer site and route of administration (oral or intravenous/other).
Results: Expenditure on systemic therapies, adjusted for population growth and aging, increased an average of 9.2% (95% confidence interval [CI] 7.2 to 11.2) per year in Saskatchewan and 6.4% (95% CI 5.3 to 7.6) per year in BC. Growth in expenditure on orally administered agents was more than 2 times higher than growth in expenditure on intravenous/other agents. Growth rates varied significantly by cancer site. In both provinces, rising cost per prescription was the largest contributor to overall growth.
Interpretation: Price is the primary driver of growth in systemic therapy expenditure in both BC and Saskatchewan. Understanding the mechanisms of expenditure growth may inform system planning and support policy-makers’ efforts to manage rising costs.
Health care system expenditure on cancer drugs has been rising rapidly. Many factors contribute to this growth: the cost of new cancer therapies has increased,1,2 systemic therapy is being used in more patients,3–5 and the pool of prevalent cancer cases has been growing owing to increasing incidence6 and improvements in survival.7 The number of new drugs being approved has accelerated alongside higher daily drug costs and longer duration of treatment.8 The use of orally administered drugs in an outpatient setting has also been a major change. Unlike conventional intravenous cytotoxic chemotherapy, with high-dosage infusions on intermittent schedules, many orally administered agents are delivered at a lower daily dosage over a prolonged period.9 With so many contributing factors, there is a strong need for health care systems to disentangle the sources of growth in cancer drug expenditures.
In Canada, understanding these trends is complicated by differences in public funding and delivery models for cancer therapy across provinces. Information on trends in systemic therapy expenditure, trends in the underlying cost drivers and differences between provinces is not readily available to Canadian policy-makers. Even among provinces with similar funding structures for systemic therapy, there is variation in coverage for specific drugs and postcoverage variation in use and access.10 Both British Columbia and Saskatchewan have complete universal coverage for anticancer systemic therapy.11–13 The provinces share strong concordance between formularies but also report wide variation in rates of use for many drugs, owing in part to differences in policy and uptake.10 Our study was conducted in parallel in BC and Saskatchewan to better understand variation between provinces while minimizing differences due to funding structure. The objectives of the study were to describe trends in systemic therapy use and cost in BC and Saskatchewan from 2006 to 2013, by therapy type and cancer site, and to identify key drivers of overall growth by isolating trends in demographic profile, incidence, use and cost.
Methods
Data sources
We conducted secondary analysis of routinely collected administrative data from the Saskatchewan Cancer Agency and BC Cancer. In this context, secondary analysis refers to analysis of data that were not collected for research purposes. Both agencies provide population-based cancer care services, including complete universal coverage of systemic therapy provided according to agency guidelines.12,13 We obtained data from the BC Cancer Systemic Therapy Program and the Saskatchewan Cancer Agency Pharmacy System for all prescriptions dispensed in 2006–2013. These databases contain dispensing records for all systemic therapy delivered to patients with cancer in the province and are routinely reviewed by pharmacy staff for accuracy and quality assurance. Records for clinical trials, special access programs and free supplies were excluded, as were drugs dispensed to pediatric patients and patients with benign disease. We excluded supportive care drugs (e.g., antiemetics) from the analysis using each province’s respective classification. Drug ingredient cost was available directly from the data and was adjusted to 2013 Canadian dollars.14 We classified drugs by route of administration as oral or intravenous/other. We generated a preliminary list of orally administered drugs in Saskatchewan, and additional drugs appearing in the BC data were added following review (Appendix 1, available at www.cmajopen.ca/content/6/3/E292/suppl/DC1).
We linked dispensing records with patient-level data from the BC Cancer Registry15 and the Saskatchewan Cancer Registry16 using unique patient identifiers. Patient characteristics obtained from registry data included age at dispensing date, sex and primary cancer site.6 For patients with multiple primary cancers, the last diagnosis before their first prescription in the observation period was used. Primary cancer site was intended as a proxy for the indication of therapy because indication was not available from the data. We also obtained aggregate cancer incidence, by age, sex and cancer site for 2006–2013, from the BC and Saskatchewan cancer registries.
Population effects
We calculated total annual expenditure, prescription volume and number of unique systemic therapy users in the 2 provinces. We calculated adjusted totals using the 2006 provincial population from Statistics Canada17 as the reference population. Annual mean per capita expenditure by age was re-weighted to the reference population size and age distribution6 to adjust for population growth and aging in either province.
Components of growth
To investigate the trends underlying overall growth, we separated total expenditure into independent components using the following identity, adapted from McGrail and colleagues:18
 Equation 1
We separated growth in expenditure for the population into 4 components: from left, growth in population cancer incidence, times growth in the number of systemic therapy recipients per incident case, times growth in the number of prescriptions per user, times growth in the cost per prescription. For example, 10% growth in expenditure for the population could be made up of 2.5% growth in each of the components as follows: 1.025 × 1.025 × 1.025 × 1.025 = 1.10.
Incidence, total number of users, prescription volume and expenditure were direct standardized by age and sex,19 weighted to the pooled population of BC and Saskatchewan for 2013 using census estimates from Statistics Canada.17 We estimated annual percent change in expenditure and in each component of equation 1 using generalized linear models with a log-link and γ distribution to directly estimate the relative growth and to account for the skewed distribution of count and cost data. We stratified models by drug route of administration, age group and cancer site (female breast, colorectal, lung, prostate and other).6 Analysis was done in SAS 9.3 (SAS Institute).
Ethics approval
The study was approved by the University of British Columbia–BC Cancer Agency Research Ethics Board.
Results
From 2006 to 2013, 2 100 947 prescriptions for systemic therapy were dispensed in BC, and 585 476 systemic therapy prescriptions were dispensed in Saskatchewan (Table 1). In BC, breast cancer was the most common indication, whereas in Saskatchewan, it was colorectal cancer. Over 30% of dispensed prescriptions in both provinces had an oral route of administration.
Characteristics of unique dispensed systemic therapy prescriptions and systemic therapy recipients in British Columbia and Saskatchewan, 2006–2013
Population effects
Crude expenditure increased an average of 11.2% (95% confidence interval [CI] 9.3 to 13.1) per year in Saskatchewan and 9.2% (95% CI 8.0 to 10.3) per year in BC, from about $25 million and $119 million in 2006 to $54 million and $205 million in 2013 in Saskatchewan and BC, respectively (Supplementary Table A1, Appendix 2, available at www.cmajopen.ca/content/6/3/E292/suppl/DC1). Prescription volume and number of systemic therapy users also increased over the study period (Figure 1). Growth in expenditure and prescription volume was higher in Saskatchewan than in BC (Figure 1).
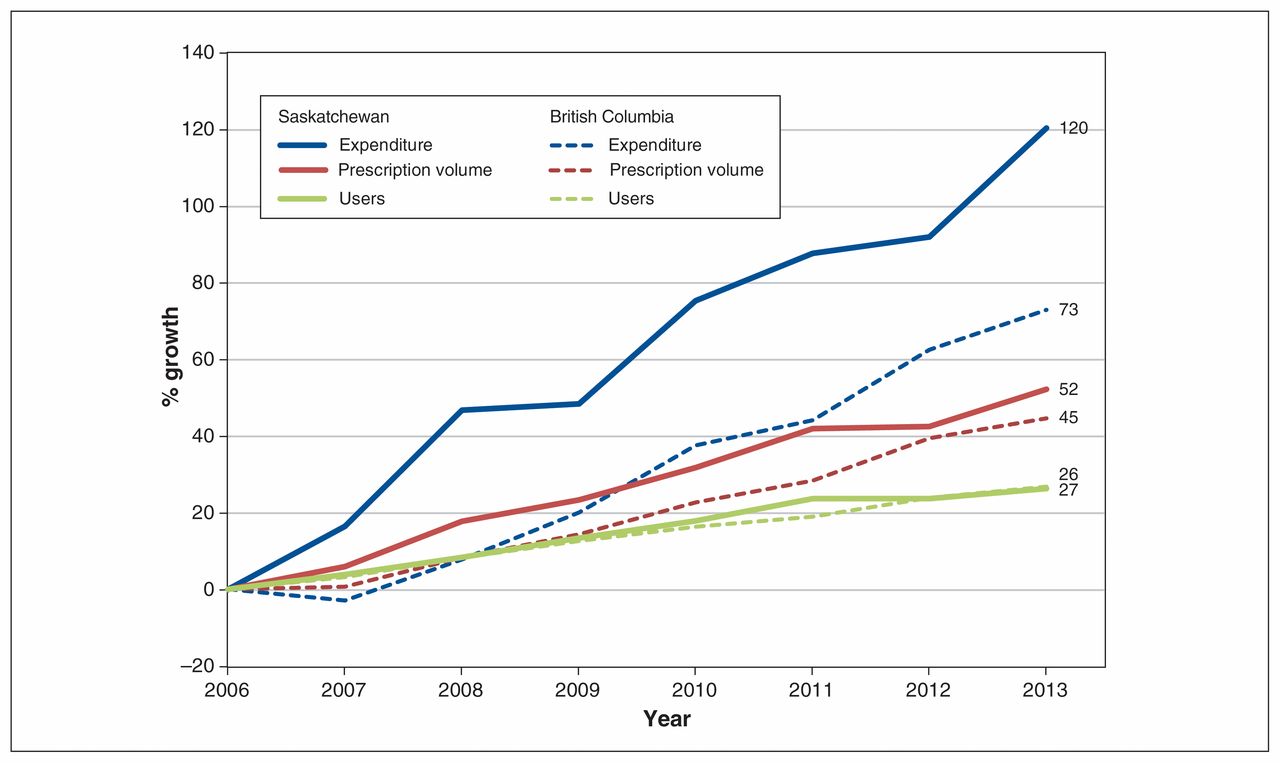
Unadjusted growth in number of users, prescriptions and expenditure in British Columbia and Saskatchewan, relative to 2006.
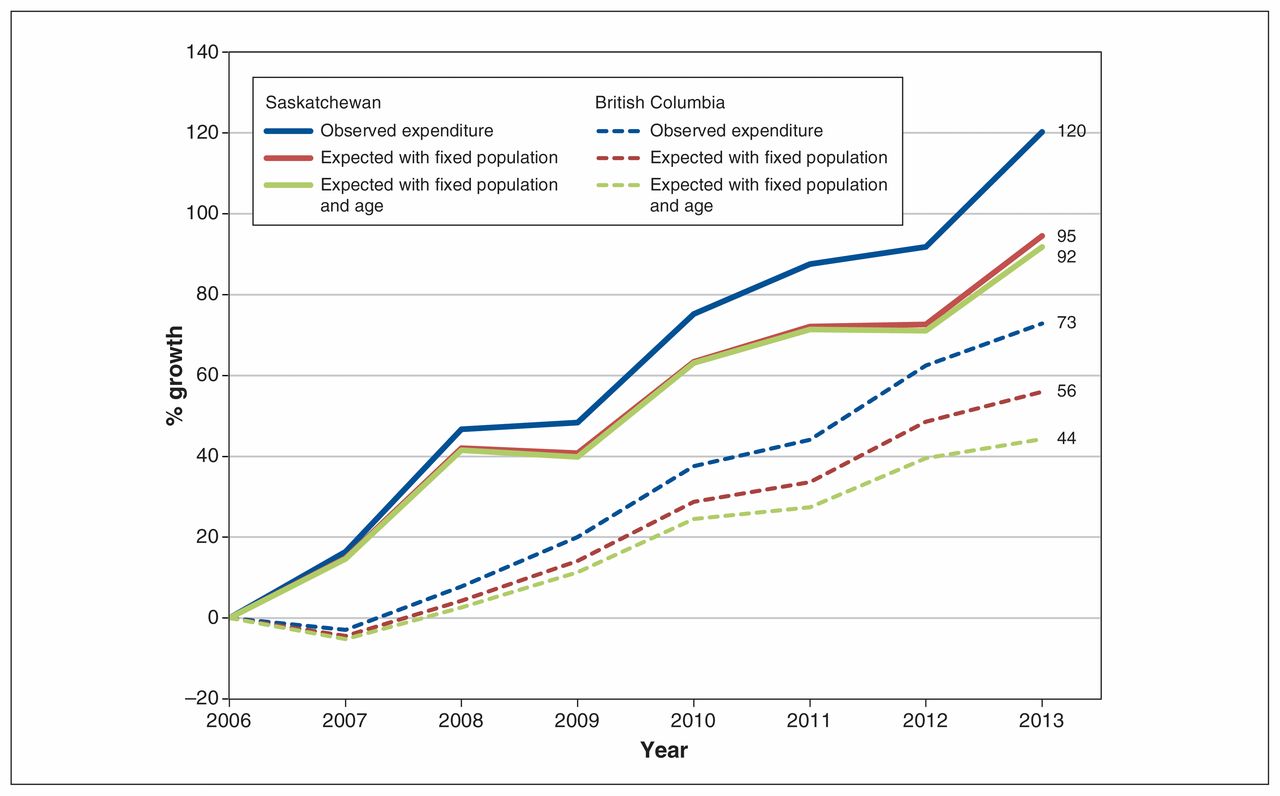
In BC, 23% of the observed increase in expenditure was attributable to population growth, and a further 16% was attributable to population aging. In Saskatchewan, population growth accounted for 21% of the increase in expenditure, and aging accounted for 2.2% (Figure 2). After adjustment for age and population, expenditure rose an average of 9.2% (95% CI 7.2 to 11.2) per year in Saskatchewan and 6.4% (95% CI 5.3 to 7.6) per year in BC.

Growth in expenditure, adjusted for population growth and aging, in British Columbia and Saskatchewan, relative to 2006.
Components of growth
Change in the components of age- and sex-standardized growth in expenditure for BC and Saskatchewan is shown in Table 2 and Table 3, respectively. Growth in cost per dispensed prescription was the largest component of overall expenditure growth, at 3.2% (95% CI 2.5 to 3.9) per year in BC and 4.7% (95% CI 3.5 to 6.0) per year in Saskatchewan. Both provinces also had increases in the number of systemic therapy users per incident case and the number of dispensed prescriptions per user. Growth in expenditure for orally administered agents was higher than that for drugs with other routes of administration, at 13.1% (95% CI 10.7 to 15.6) per year and 16.5% (95% CI 13.6 to 19.6) per year in BC and Saskatchewan, respectively.
Annual percent change by component in British Columbia*
Annual percent change by component in Saskatchewan*
Stratified analysis by cancer site and age group revealed significant variability in trends. In BC, expenditure on orally administered drugs for breast cancer decreased over the study period (−11.4% per year, 95% CI −17.8 to −4.5), whereas in Saskatchewan, expenditure was unchanged. In both provinces, the greatest increase was seen in orally administered drugs for prostate cancer: incidence decreased and the number of systemic therapy users and prescriptions increased slightly, whereas cost per dispensed prescription grew annually by 20.6% (95% CI 4.8 to 38.7) in BC and 31.6% (95% CI 12.9 to 53.4) in Saskatchewan. Both provinces also showed a trend of increasing expenditure on orally administered agents among older patients, but this effect largely disappeared after adjustment for both age group and indication (Supplementary Tables A2 and A3, Appendix 2).
Interpretation
Average annual growth in expenditure for systemic therapy, at 11.2% in Saskatchewan and 9.2% in BC between 2006 and 2013, outpaced growth in the number of users and prescription volume. After we accounted for population growth and aging, the increase in expenditure on systemic therapy agents remained significant, roughly doubling in Saskatchewan and increasing by half in BC over the study period. In Canada, the average annual growth in wholesale purchases of cancer drugs by hospitals was 15.2% per year between 2004/05 and 2009/10, with the majority of the growth attributed to purchase of newer, high-cost treatments as opposed to price changes, volume effects or population growth.2 Similar patterns have been observed in the United States for orally administered anticancer drugs, for which spending increased by 37% and use increased by 10% between 2006 and 2011.20 Although older adults account for a disproportionate amount of health care expenditure owing to higher morbidity and use of health care services, population aging has only a modest effect on growth. The Canadian Institute for Health Information estimated growth in overall health expenditure attributable to aging as only 0.9% per year.21 Aging in particular had little impact on expenditure in Saskatchewan in the current study. Recent census data indicate that Saskatchewan’s population is growing more quickly than BC’s and is substantially younger.22 In the present study, overall growth in expenditure was higher in Saskatchewan than in BC. Per capita expenditure was slightly higher in BC than in Saskatchewan at the start of observation, in 2006, as observed previously,10 and decreased from 2006 to 2007, which exaggerated the difference in growth rates. Changes in indication for 2 major drugs in BC, bevacizumab for colorectal cancer and trastuzumab for breast cancer, led to reduced expenditure in 2007.
Our stratified analysis revealed significant variability in trends. Growth in expenditure was fastest for orally administered drugs in both provinces, owing in part to a change in the product mix over time. A US study showed that biologics accounted for 59% of total spending on orally administered anticancer drugs in 2011, up from 35% in 2006, whereas the share of hormonal agents decreased from 42% to 19%.20 Generic hormonal agents became available over the study period, and this is reflected in the decrease in cost observed for orally administered breast cancer drugs. Growth in expenditure was largest for lung cancer and “other” cancers, which reflects recent changes in therapies for less common cancers. Between 2005 and 2014, most new oncology drugs were for rarer indications, including renal cancer, lymphoma and chronic myelogenous leukemia.8 Growth in total expenditure was highest among older patents, particularly for orally administered drugs. There is a perception that these agents have reduced toxicity,9,23 and, as a result, we might expect to see increased use among older patients, who may not otherwise be candidates for systemic therapy; however, the number of users and prescription volume increased at roughly the same rate among older and younger patients.
Isolating the underlying trends revealed that the largest growth was observed in cost per dispensed prescription, at 3% and 5% per year for all drugs and 8% and 11% per year for orally administered drugs in BC and Saskatchewan, respectively. The unit cost of drugs, particularly for orally delivered drugs, is responsible for the most growth in expenditure. Growth was especially high for prostate cancer owing to the introduction of abiraterone, an orally administered CYP17 inhibitor, toward the end of the study period. The exception to this pattern was colorectal cancer, for which the observed growth in all other components exceeded the growth in cost for oral systemic therapy. Most oral therapy for colorectal cancer was with capecitabine, whose use steadily increased over time.
What is the value that health care systems are realizing on systemic therapy spending? Measuring value for money is outside the scope of the current analysis but is central to understanding the implications of these trends. Growth in systemic therapy expenditure may be appropriate if therapeutic benefit to patients is growing correspondingly; however, there is mounting evidence that patient benefit is decreasing over time relative to price.24 The list price of new anticancer drugs increased by 12% per year between 1996 and 2014 for drugs approved in the US.1 In the United Kingdom, the average daily drug cost increased from £50 (roughly Can$90) for drugs introduced in 2000–2004 to £144 (Can$270) in 2005–2009 and £160 (Can$300) in 2010–2014.8 Cost-effectiveness ratios have been rising over time for newly approved anticancer drugs, with an estimated US$54 100 per year of life for drugs launched in 1995 and US$207 000 per year of life for those launched in 2013, an increase of nearly fourfold.1 Rising prices are attributable in part to reference pricing, whereby a product’s launch price is set incrementally higher than those of existing therapies, and to compensating for mandated or negotiated discounts.1 At a threshold of US$100 000 per year of life, the net benefit for total drug expenditure at current levels remains positive, but as expenditure growth outpaces therapeutic benefit, value for money diminishes.25
Limitations
This study has several limitations arising from the use of administrative data. Our analysis uses a patient’s last diagnosis as a proxy for indication of therapy, and there may have been some misclassification in cases in which patients with multiple primary cancers were receiving treatment for the earlier diagnosis. Data on specific indications (e.g., adjuvant v. palliative indications) would provide additional insight into drug use. Administrative data also cannot provide important contextual information, such as the impact of provider practice patterns, patient preference or shared decision-making on these trends. Patients tend to prefer oral therapy for convenience and comfort, 23 but managing adherence and monitoring toxicity may be more challenging in patients taking oral therapy at home.9,26 Exploring these factors through qualitative or mixed-methods research would provide important insight into the trends observed here. Our results are also limited by the time frame of our analysis. New therapies are continually being adopted by cancer agencies. Since 2013, the largest change to the systemic therapy landscape has been the introduction of immune checkpoint inhibitors for the treatment of several cancers. The expenditure trends we observed will have likely continued beyond 2013 with the use of these and other novel systemic therapy agents, but this should be confirmed with additional years of observation. Additional data would also allow for a more sophisticated time-series or joinpoint analysis, in which changes in the growth rate over time are identified by means of segmented regression.27 Our study had too few time points to implement these methods;28 consequently, this analysis assumes a constant rate of change and cannot identify changes in growth associated with specific policy changes or time-varying factors. Finally, the cost information in our data does not reflect negotiated volume discounts or rebates from manufacturers. European data indicate that actual prices can be as much as 58% lower than list price.29 Our analysis therefore overestimates expenditures, but the magnitude of this effect is unknown owing to the confidential nature of these negotiated pricing agreements.
Conclusion
Expenditure on systemic therapy drugs for cancer is increasing over time. Our analysis indicates that the largest contributor to this growth is price, reflected in the cost per dispensed prescription. Although the magnitude of this growth and the balance between the cost drivers vary by cancer type, similar patterns were observed in BC and Saskatchewan, and these findings are likely generalizable across Canadian jurisdictions. Understanding the drivers of health care expenditure is only the first step toward assessing the value of services and setting priorities for the allocation of scarce resources.
Footnotes
Competing interests: None declared.
This article has been peer reviewed.
Contributors: Reka Pataky developed the analysis plan, obtained and analyzed the British Columbia data, and drafted the manuscript. David Tran and Andrea Coronado contributed to the analysis plan, obtained and analyzed the Saskatchewan data, and contributed substantially to manuscript development. Riaz Alvi, Darryl Boehm, Dean Regier and Stuart Peacock conceived the study, contributed substantially to the study design and interpretation of the data, and critically revised the manuscript for important intellectual content. All of the authors gave final approval of the version to be published and agreed to be accountable for all aspects of the work.
Disclaimer: All inferences, opinions and conclusions drawn in this article are those of the authors and do not reflect the opinions or policies of the data steward(s).
Supplemental information: For reviewer comments and the original submission of this manuscript, please see www.cmajopen.ca/content/6/3/E292/suppl/DC1.
Funding: The Canadian Centre for Applied Research in Cancer Control is funded by grant 2015-703549 from the Canadian Cancer Society Research Institute.
References
- Copyright 2018, Joule Inc. or its licensors
In this issue

Article tools


Related Articles
Cited By...
- No citing articles found.