


Abstract
Background: Racial and ethnic disparities in COVID-19 vaccination coverage have been observed in Canada and in other countries. We aimed to compare vaccination coverage for at least 1 dose of a COVID-19 vaccine between First Nations people living off reserve and Métis, Black, Arab, Chinese, South Asian and White people.
Methods: We used data collected between June 2021 and June 2022 by Statistics Canada’s Canadian Community Health Survey, a large, nationally representative cross-sectional study. The analysis included 64 722 participants aged 18 years or older from the 10 provinces. We used a multiple logistic regression model to determine associations between vaccination status and race, controlling for collection period, region of residence, age, gender and education.
Results: Nonvaccination against COVID-19 was more frequent in off-reserve First Nations people (adjusted odds ratio [OR] 1.8, 95% confidence interval [CI] 1.2–2.7) and Black people (adjusted OR 1.7, 95% CI 1.1–2.6), and less frequent among South Asian people (adjusted OR 0.3, 95% CI 0.1–0.7) compared to White people.
Interpretation: This analysis showed significant inequalities in COVID-19 vaccine uptake between racial/ethnic populations in Canada. Further research is needed to understand the sociocultural, structural and systemic facilitators of and barriers to vaccination across racial groups, and to identify strategies that may improve vaccination uptake among First Nations and Black people.
Health inequalities represent any measurable differences in health across individuals. When these differences are preventable, unjust or unnecessary, they are considered health inequities.1 Since the beginning of COVID-19 vaccination, in December 2020, racial and ethnic disparities in vaccine uptake have been observed in Canada and other countries.2–4 Studies have shown lower vaccine uptake in areas with a higher proportion of minority ethnic groups: certain racialized populations were less vaccinated or more hesitant to receive a COVID-19 vaccine than others.5–7 The ongoing inequalities faced by racialized populations have been exacerbated and amplified by the pandemic.8 Infections, hospital admissions and deaths due to COVID-19 have disproportionately affected these populations.9 Therefore, to inform the development of equitable vaccination targeting programs across all populations, it is crucial to understand the existing barriers to vaccine uptake in ethnic and racialized groups by measuring and monitoring the possible structural and systemic disparities in vaccination coverage. However, few studies have examined actual COVID-19 vaccination coverage by racial group in Canada. Nationally representative evidence on racial inequalities in vaccine uptake is limited. Since Canadian vaccination registries do not collect information on race, survey data are the best source for collecting these data from a large sample. In our previous analysis measuring inequalities in COVID-19 vaccine uptake and vaccination intent based on data collected from June to September 2021 by the Canadian Community Health Survey (CCHS), the small number of observations among racialized and Indigenous populations precluded a detailed analysis of vaccination coverage.10
As the CCHS interviewed more people over time, combining collection cycles from June 2021 to June 2022 accrued enough participants to compare vaccination coverage between specific subgroups. Therefore, we aimed to compare COVID-19 vaccination coverage for at least 1 dose between adult Indigenous, racialized and White people in Canada.
Unlike “vaccination coverage,” which consistently refers to the proportion of people vaccinated in a population, “vaccine uptake” is used with various meanings in the scientific literature. 11 In this article, we use vaccine uptake with the meaning of “the behavior of receiving a vaccine.” We use the word “Indigenous” throughout this article to designate people who are First Nations, Inuit or Métis, except when referring to the exact wording of the CCHS questionnaire, where the word “Aboriginal” was used.
Methods
Setting
Canada initiated its COVID-19 vaccination campaign in December 2020, targeting priority groups and then followed by broader availability to the public throughout 2021. In the 10 Canadian provinces, all adults aged 18 years or older became eligible to receive their first dose in May 2021. By July 2021, Canada had acquired enough doses to fully vaccinate every eligible person. By June 19, 2022, 28.7 million Canadians aged 18 years or older (90.9% of the population) had received at least 1 dose.12
Study sample
The CCHS is a voluntary, annual, cross-sectional, nationally representative survey conducted by Statistics Canada covering people aged 12 years or older living in Canada.13 In September 2020, questions regarding COVID-19 vaccination based on the COVID-19 Vaccination Coverage Survey were added.14 We combined data from 5 collection periods covering June 1, 2021, to June 30, 2022, to examine inequalities in vaccination coverage for at least 1 dose of a COVID-19 vaccine among people living in the 10 Canadian provinces. We combined the data to ensure that a sufficient sample was available for the racialized and Indigenous groups. The 3 territories were not included because the participants surveyed between June 1, 2021, and June 30, 2022, did not constitute a representative sample. Data were collected through computer-assisted telephone interviews, as well as an electronic questionnaire in 2022, for a total of 64 722 respondents and an overall response rate of 31.3% (Table 1). Computer-assisted telephone interview is a widely used data collection method whereby interviewers contact participants via telephone and use a computer-assisted interviewing application to guide the survey flow, ask questions and record responses. The survey was administered in both official languages (English and French). If the respondent did not speak English or French, an attempt was made to have the interview completed by an interviewer fluent in the respondent’s language; if this was not possible, the interviewer asked whether someone in the household or elsewhere could interpret for the respondent. For respondents aged 18 years or older, 98.2% of interviews were completed in English or French, and 0.6% in another language; information about language was missing for 1.2% of interviews.
Response rate by collection period, 10 provinces, adults aged 18 years or older
People living on First Nations reserves, full-time members of the Canadian Armed Forces, people living in institutions, children aged 12–17 years living in foster care, and people living in the Quebec regions of Nunavik and Terres-Cries-dela-Baie-James were excluded from the survey coverage. Altogether, these exclusions represented less than 3% of the Canadian population aged 12 years or older.13
Statistics Canada performed sample selection using a complex survey design — a multistage stratified cluster design — and gave calibrated survey weights based on province, age group and sex to each respondent to ensure representativeness of the Canadian population. Further details on the survey design and methodology, including the questionnaire, are available on Statistics Canada’s website.13
The authors were an ethnically diverse group, including people self-identifying as Black (N.G.), Filipino (D.-J.B., A.M.), Chinese (R.C.) and Red River Métis (S.M.D.), in addition to White (M.G., S.M., È.D., V.L.). Three of the authors (M.G., R.C. and N.G.) had contributed to the development of the COVID-19 questions included in the CCHS.
Measurements
Respondents to the CCHS were asked the following question: “Have you been vaccinated against COVID-19?” They could respond “Yes, received at least 1 dose of a vaccine” or “No.” We used the responses to this question to derive the binary outcome variable vaccination status. People who did not respond to this question (2.4%) were removed from the analysis.
We used receipt of at least 1 dose of vaccine to measure vaccine uptake instead of completion of a primary series because the objective of this analysis was to determine racial inequalities in COVID-19 vaccine uptake rather than vaccine effectiveness. In this analysis, a variable distinguishing people having received at least 1 dose is the most accurate given the different definitions of “fully vaccinated” among the Canadian provinces, different number of dose requirements by vaccine product, and the delayed eligibility of receiving a second dose among younger adults at the start of data collection owing to recommendations on the time interval between doses.
To develop the independent variable “population group,” respondents were asked to self-identify by answering 2 of 3 questions:
First, respondents were asked “Are you an Aboriginal person, that is, First Nations, Métis or Inuk (Inuit)? First Nations includes Status and Non-Status Indians,” to which they could respond “Yes” or “No.”
For those who answered “Yes,” a follow-up question was asked: “Are you First Nations, Métis or Inuk (Inuit)?”; respondents could mark all that applied among “First Nations (North American Indian),” “Métis” and “Inuk (Inuit).”
Respondents who answered “No” were asked to select all racial or cultural groups that applied among 12 categories: “White,” “South Asian (e.g., East Indian, Pakistani, Sri Lankan),” “Chinese,” “Black,” “Filipino,” “Latin American,” “Arab,” “Southeast Asian (e.g., Vietnamese, Cambodian, Malaysian, Laotian),” “West Asian (e.g., Iranian, Afghan),” “Korean,” “Japanese” and “Other – Specify.”
From these questions, we derived a variable for population group with 8 categories: “White,” “off-reserve First Nations,” “Métis,” “Black,” “Arab,” “Chinese,” “South Asian” and “Other or unknown.” Generally, the population groups included respondents who reported a single mark-in or write-in response corresponding to these groups. Because the samples of other specific racialized or Indigenous groups or those with multiple identities were small, we combined these groups with the “Other or unknown” group. A guideline for deriving these population groups is available on Statistics Canada’s website.15
We included additional sociodemographic factors in the analysis. To account for changes in vaccination coverage over time, we included a variable for collection period corresponding to the study’s 5 data collection periods. To account for differences in coverage across the provinces, we included a variable for region of residence with 5 categories: British Columbia, Prairies (Alberta, Saskatchewan and Manitoba), Ontario, Quebec and Atlantic region (New Brunswick, Nova Scotia, Prince Edward Island, and Newfoundland and Labrador). Last, we grouped education into 5 categories: less than secondary, secondary, postsecondary below bachelor’s degree, bachelor’s degree or above, and not applicable or unknown. We set education for those less than 25 years old to “Not applicable” to enable the use and interpretation of education as a socioeconomic variable.
Several steps were taken throughout the CCHS to ensure data quality, such as preventing out-of-range values, controlling flow errors in the computer-assisted interviewing application, and correcting inconsistent reporting after data collection.
Statistical analysis
We computed unweighted frequencies and proportions to describe the full sample. We also included weighted proportions to illustrate the population distribution of all variables of interest. We determined vaccination coverage for at least 1 dose for each racialized group by computing weighted prevalence proportions with adjusted confidence intervals (CIs) using the Wilson method for binomial proportions.16
We used a multiple logistic regression model to determine associations between vaccination status and race. We adjusted the model for data collection period, region of residence and age to control for differences in provincial vaccine rollout plans and vaccination eligibility, as well as for potential confounders (i.e., variables that we considered to conceptually have an association with both race and vaccination status [gender and education]). We chose not to adjust our model for variables representing socioeconomic factors or barriers to accessing health care services, or potentially associated to them (e.g., immigration status, mother tongue, community size) because we reasoned that these variables may be intermediate steps in causal pathways, and, therefore, their inclusion in models might have masked inequalities. We then computed odds ratios (ORs) to compare the risk of being unvaccinated among Indigenous, racialized and White populations. We adjusted the CIs and p values for multiple comparisons using the Dunnett method to account for multiple groups compared to a single reference group.17 We also performed single-predictor logistic regression analysis to estimate unadjusted associations and compute unadjusted ORs for comparison to the adjusted estimates.
Statistics Canada adjusted sampling weights for complete nonresponse and calibrated them by province, age and sex, using demographic projections from 202018 to generate estimates representative of the included population. We also applied bootstrap weights to ensure accurate estimated variances. We used SAS Enterprise Guide 7.1 (SAS 9.4) software and the SURVEYFREQ and SURVEYLOGISTIC procedures (SAS Institute) exclusively to account for the complex study design.
Ethics approval
The CCHS was carried out in compliance with the Statistics Act and other applicable laws and regulations. All experimental protocols were approved by Statistics Canada’s Office of Privacy Management and Information Coordination and its Data Ethics Secretariat, which apply many of the same criteria as an institutional review board when reviewing requests for data sets. In addition, we consulted the Health Canada and Public Health Agency of Canada Research Ethics Board as it would be the institutional review board of record for this study. This study was exempt from research ethics board review pursuant to Article 2.2 of the Tri-Council Policy Statement on Ethical Conduct for Research Involving Humans.19
Informed consent was implied if respondents continued to respond to the telephone survey after the interviewer stated, “Your participation in this survey is voluntary and your responses will be kept confidential.”
Results
The final sample is described in Table 1 and Table 2. There was a large enough sample of 4 racialized populations (Black, Arab, Chinese and South Asian) and 2 Indigenous populations (off-reserve First Nations and Métis) to enable analysis of vaccination coverage (Table 2). The gender category “Other or unknown” was removed from analysis owing to insufficient sample size. We included the education category “Not applicable or unknown” in regression models as a separate category to avoid excluding a large number of observations.
Characteristics of survey respondents
Overall, the proportion of unvaccinated people initially decreased and then stabilized over time: it was 11% (95% CI 10%–12%) in the period June 1–Sept. 5, 2021, 6% (95% CI 5%–6%) in Sept. 1–Nov. 14, 2021, 4% (95% CI 3%–5%) in Nov. 15, 2021–Feb. 7, 2022, and 5% (95% CI 5%–6%) in each of Feb. 9–May 7, 2022, and Apr. 2–June 30, 2022 (Table 3).
Unadjusted and adjusted associations between sociodemographic variables and vaccination status: the weighted odds of being unvaccinated versus having at least 1 dose
Both unadjusted and adjusted logistic regressions models showed that collection period, region of residence, age, gender, education and population group were significantly associated with nonvaccination (Table 3). The final sample for the adjusted model consisted of 63 020 people, with 1702 people (2.6%) removed from the analysis, mainly owing to missing values for vaccination status (n = 1528). After adjustment for collection period, region of residence, age, gender and education, the odds of being unvaccinated were greater for off-reserve First Nations people (adjusted OR 1.8, 95% CI 1.2–2.7) and Black people (adjusted OR 1.7, 95% CI 1.1–2.6) than for White people. Conversely, the odds were lower for South Asian people (adjusted OR 0.3, 95% CI 0.1–0.7) (Table 3, Figure 1).
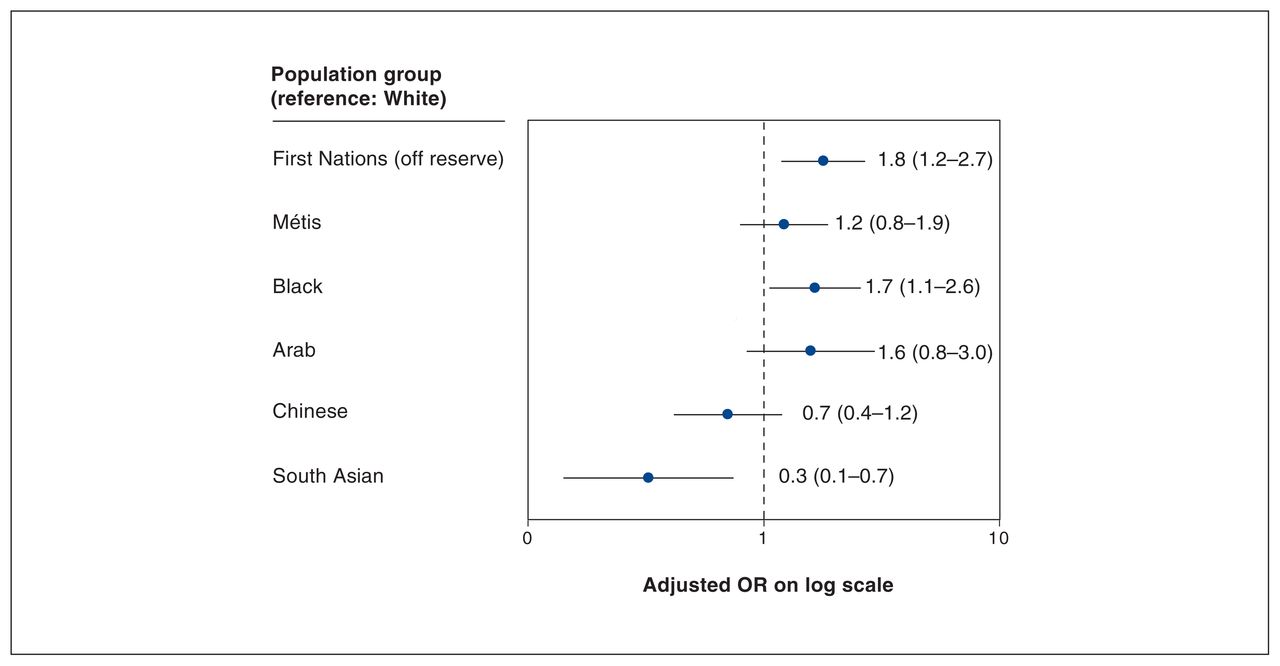
Weighted odds of being unvaccinated versus having at least 1 dose by population group among adults aged 18 years or older, all provinces, June 1, 2021, to June 30, 2022. Note: OR = odds ratio. Error bars represent 95% confidence intervals.
We conducted a sensitivity analysis and performed a multiple logistic regression model without adjusting for education to verify that socioeconomic factors such as education did not mask racial inequalities. The results from this model were similar to those from the model including education, which suggested that education did not mask any effects, even if the highest level of education varied between population groups (Appendix 1, available at www.cmajopen.ca/content/11/6/E1075/suppl/DC1).
Interpretation
We found that nonvaccination against COVID-19 was more frequent among off-reserve First Nations and Black people than among White people. Overall, the estimated COVID-19 vaccination coverage for at least 1 dose between June 2021 and June 2022 among adults aged 18 years or older residing in the 10 provinces was high, at 94%. As expected, vaccination coverage increased initially and then leveled off by the end of the data collection period. Vaccination coverage estimated in this study was slightly higher than that reported by the Canadian COVID-19 Vaccination Coverage Surveillance System, which indicated that, by the beginning of January 2022, 92% of adults had received at least 1 dose of a COVID-19 vaccine. 12 Our overestimation may be due to differences between the CCHS respondents and the general population. It should be kept in mind that the objective of this study was to compare vaccination coverage between Indigenous, racialized and White people, not to estimate coverage in the entire population, a purpose for which surveillance data are more suitable.
Our findings are consistent with those from a recent Ontario study that showed lower vaccine uptake in Indigenous populations, including First Nations, Inuit and Métis, than in the general population.4 First Nations, Inuit and Métis people across geographies are at higher risk for SARS-CoV-2 infection owing to high rates of chronic disease, inadequate housing and barriers to accessing health care services. As a result, many of these populations were prioritized for access to COVID-19 vaccine in most provinces.20 Possible explanations for the higher odds of being unvaccinated among off-reserve First Nations people, despite the prioritization of this group, include provincial policies that delayed access to vaccination among First Nations, Inuit and Métis people living in cities compared to First Nations people living on reserve, as well as mistrust in vaccines and the health care system.4
Similarly, a study from the United States showed lower COVID-19 vaccination coverage among Black populations than among all other racial groups.21 Nguyen and colleagues22 suggested that concerns about possible adverse effects and vaccine effectiveness were significantly higher among Black people as well as other minority groups than among non-Hispanic White people. Distrust in the government and the medical profession has been suggested to be one of the main reasons for vaccine hesitancy among Black people.23
Conversely, in the present study, the risk of being unvaccinated was lower among South Asian people than among White people. This is in keeping with a US study looking at racial and ethnic disparities in COVID-19 vaccination coverage that showed that all racial and ethnic minority groups except for Asian people had lower levels of vaccination coverage than White people.24 Few recent Canadian data are available for this population group. However, using CCHS data collected between 2003 and 2009, Quach and colleagues25 observed similar trends for influenza vaccine.
Further research is needed to understand the structural and systemic factors contributing to lower vaccine uptake among First Nations and Black people in Canada. This information will contribute to the design of targeted public health messaging and programs. Additional research could also explore the protection of the population against COVID-19 and severe outcomes by examining whether the same racial inequalities in vaccine uptake exist among those with a completed primary series or who have received booster doses.
Limitations
This study is one of the few to date that examine COVID-19 vaccination status among Indigenous and racialized populations at the national level in Canada, thus contributing to the growing body of research on COVID-19 vaccine acceptance or hesitancy among different groups. A substantive strength of the CCHS is the sufficiently large sample to allow for analysis by several sociodemographic variables. In addition, because this was a population-based study, and given its complex design and the use of survey weights, the findings are nationally representative and allow us to make inferences about the population of Canada. The CCHS from which we obtained data was not a vaccination survey but, rather, a general health survey in which vaccination was only one subject among many others. Therefore, one’s perception about vaccines and vaccination was unlikely to influence the decision to participate in the survey, thus limiting selection bias from vaccine hesitancy or vaccine refusal.
Nonetheless, the data have limitations that should be considered. Self-reported data, including data from the CCHS, are susceptible to bias, such as social desirability bias, recall bias and nonresponse bias. Interviewers were trained to help minimize response bias and nonresponse bias. For instance, interviewers were instructed to conduct the interview in private whenever possible, to minimize bias and help ensure the quality of participants’ responses. Interviewers were also trained in techniques for maintaining response and refusal conversion. However, these potential biases may have resulted in under-or overestimation of associations. Moreover, excluding on-reserve First Nations people and the small numbers of off-reserve First Nations, Métis and racialized participants are important limitations, as they restricted further analyses beyond simple comparisons between populations. Because Indigenous and racialized people are known to be overrepresented in the groups excluded from the CCHS target population (e.g., people living in institutions), the accuracy of inferences from this analysis to those groups may have been affected. Finally, the COVID-19 pandemic had a negative impact on CCHS response rates: they declined owing to the inability to conduct in-person interviews and pandemic-related collection capacity issues. Survey nonresponse can lead to nonresponse bias. To help minimize the potential for nonresponse bias, Statistics Canada adjusted and calibrated the survey weights using auxiliary information to represent the total population aged 12 years or older living in the 10 provinces; however, nonresponse bias remains possible.
Conclusion
Nonvaccination against COVID-19 was more frequent in off-reserve First Nations and Black people, and less frequent among South Asian people than among White people. These findings highlight the ongoing need to explain and address health inequalities among certain racialized and Indigenous populations in Canada. Further research is needed to understand the sociocultural, structural and systemic facilitators of and barriers to vaccination across racial groups and identify strategies that may increase trust in vaccines and improve vaccine uptake among First Nations and Black people in Canada.
Acknowledgements
The authors are grateful to Haileigh McDonald, Statistics Canada, for assistance in data analysis, and to all survey participants.
Footnotes
Competing interests: None declared.
This article has been peer reviewed.
Contributors: Mireille Guay led the study. Mireille Guay and Nicolas Gilbert conceived and designed the study. Aubrey Maquiling analyzed the data. Mireille Guay, Nicolas Gilbert, Ruoke Chen, Aubrey Maquiling, Donalyne-Joy Baysac and Valérie Lavergne interpreted the data, with contributions from Eve Dubé, Shannon MacDonald and S. Michelle Driedger. Mireille Guay, Aubrey Maquiling, Ruoke Chen, Donalyne-Joy Baysac and Valérie Lavergne drafted the manuscript. All authors revised the manuscript critically for important intellectual content, approved the final version to be published and agreed to be accountable for all aspects of the work.
Funding: No funding was received for this study.
Data sharing: The data set analyzed is available in the Statistics Canada Research Data Centres, https://www.statcan.gc.ca/en/microdata/data-centres.
Disclaimer: All inferences, opinions and conclusions drawn in this manuscript are those of the authors and do not reflect the opinions or policies of the government of Canada.
Supplemental information: For reviewer comments and the original submission of this manuscript, please see www.cmajopen.ca/content/11/6/E1075/suppl/DC1.
This is an Open Access article distributed in accordance with the terms of the Creative Commons Attribution (CC BY-NC-ND 4.0) licence, which permits use, distribution and reproduction in any medium, provided that the original publication is properly cited, the use is noncommercial (i.e., research or educational use), and no modifications or adaptations are made. See: https://creativecommons.org/licenses/by-nc-nd/4.0/
References
- © 2023 CMA Impact Inc. or its licensors
In this issue

Article tools


Related Articles
Cited By...
- No citing articles found.