


Article Figures & Tables
Figures
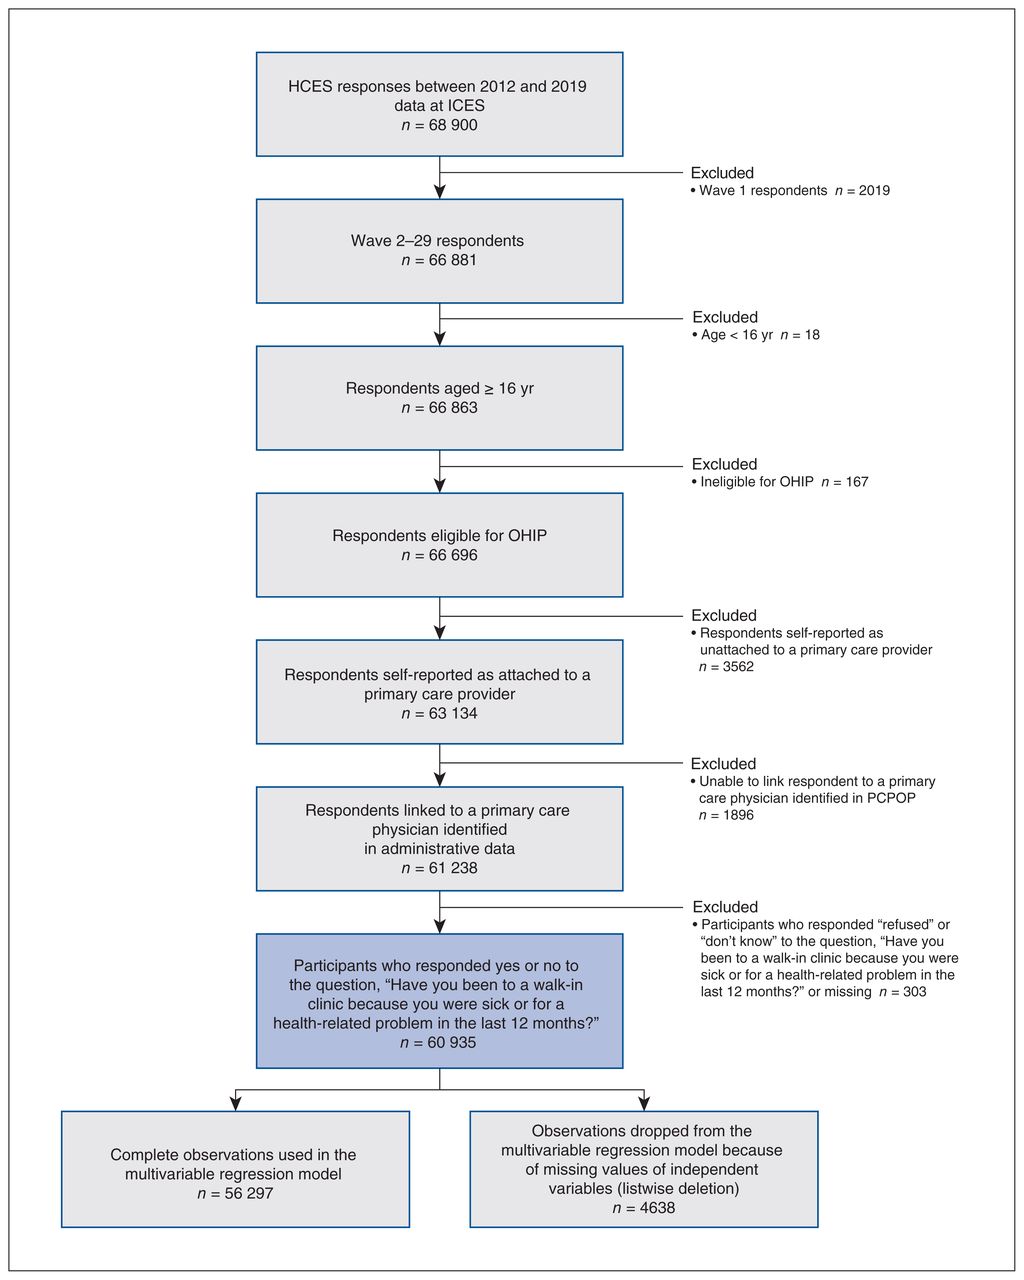
- Figure 1:
Inclusion and exclusion criteria for the study cohort. Note: HCES = Health Care Experience Survey, OHIP = Ontario Health Insurance Plan, PCPOP = Primary Care Population.
Tables
Characteristic No. (%) of respondents*
n = 60 935Sex Female 35 633 (56.9) Male 25 302 (43.1) Age, yr, mean ± SD 53.9 ± 17.3 Rurality Large urban (RIO score 0) 20 915 (40.2) Medium urban (RIO score 1–9) 15 906 (26.7) Small urban (RIO score 10–39) 16 008 (22.8) Rural (RIO score ≥ 40) 8106 (10.3) Self-reported level of education High school 18 979 (29.4) College or bachelor’s degree 34 465 (57.2) Graduate or professional degree 6978 (12.6) Missing 513 (0.8) Self-reported financial situation Very comfortable 9691 (16.1) Comfortable 36 980 (61.1) Tight, very tight or poor 12 566 (19.9) Do not know or refused 1698 (2.9) Multimorbidity (having ≥ 3 chronic conditions) Yes 5839 (8.5) No 55 096 (91.5) Have called or tried to call primary care physician with a medical question or concern during the day on a Monday to Friday Yes 33 874 (54.8) No 26 705 (44.6) Missing 356 (0.6) After-hours access to own primary care physician or clinic Yes 25 373 (41.1) No 35 549 (58.9) Missing 13 (0.02) Saw own physician or clinic on same day or next day when sick Yes 11 978 (21.3) No 18 715 (30.5) Did not see their own physician or clinic 3925 (6.2) Not applicable† 24 691 (39.5) Missing 1626 (2.5) Type of primary care model‡ Virtually enrolled in a fee-for-service practice 2582 (4.7) Enhanced fee-for-service practice 15 990 (29.7) Non-team capitation practice 18 459 (32) Team capitation practice 22 091 (32.5) Other patient enrolment model 1814 (1.1) Total visits to any primary care physician over 2 yr, median (IQR) 8 (4–13) Total visits to any primary care physician over 2 yr, mean ± SD 10.7 ± 11.3 Total visits to the usual primary care physician over 2 yr, median (IQR) 5 (3–9) Total visits to the usual primary care physician over 2 yr, mean ± SD 7.4 ± 8.4 Total visits to a primary care physician other than the usual physician over 2 yr, median (IQR) 2 (0–4) Total visits to a primary care physician other than the usual physician over 2 yr, mean ± SD 3.3 ± 5.2 Self-reported reasons for using walk-in clinics§ Provider was not available or could not get an appointment 6970 (50.8) It was faster to go to the walk-in 3196 (23.1) The walk-in was closer 2339 (18.3) Provider advised or follow-up 357 (2.2) Do not know or refused 125 (0.9) Missing 711 (4.6) Self-reported that the last walk-in visit was for a condition that could have been treated by their primary care provider, if he or she had been available¶ Yes 14 511 (89.9) No 1214 (7.5) Do not know or refused 426 (2.5) Missing 15 (0.1) Self-reported quality of care received in walk-in a clinic when visited¶ Excellent, very good or good 12 906 (79.2) Fair 2119 (13.5) Poor 1053 (6.9) Do not know or refused 88 (0.4) Note: IQR = interquartile range, RIO = Rurality Index for Ontario, SD = standard deviation.
↵* Unless indicated otherwise. Results were weighted.
↵† Included respondents who did not seek any medical care in the previous 12 months.
↵‡ Patients virtually enrolled in a FFS practice were those not formally part of an enrolment model but who received care from a regular primary care physician. Enhanced fee-for-service practices include those using a comprehensive care model and family health groups. Non-team capitation practices include those using capitation models (i.e., family health organization and family health network) that are not signatory to a family health team, which are interdisciplinary models of care. Team capitation practices include those using capitation models (i.e., family health organization and family health network) that are part of a family health team. Other patient enrolment models include smaller, specialized patient enrolment models.
↵§ Added in wave 6 of the survey and calculated for those who reported visiting a walk-in clinic (n = 13 698).
↵¶ Calculated for those who reported visiting a walk-in clinic (n = 16 166).
- Table 2:
Descriptive comparison of those who did and did not report using a walk-in clinic in the previous 12 months
Characteristic No. (%) of respondents* Standardized mean difference Used walk-in clinics
n = 16 166Did not use walk-in clinics
n = 44 769Sex Female 10077 (59.7) 25556 (55.8) 0.08 Male 6089 (40.3) 19 213 (44.2) Age, yr, mean ± SD 45.1 ± 16.9 53.4 ± 16.8 −0.02 Age, yr 16–39 5666 (38.9) 8278 (21.8) 0.37 40–64 7568 (47.5) 21080 (50.1) −0.05 65–84 2723 (12.7) 14054 (26.1) −0.34 ≥ 85 209 (0.9) 1357 (2.0) −0.10 Rurality Large urban (RIO score 0) 6394 (44.5) 14521 (38.5) 0.12 Medium urban (RIO score 1–9) 5723 (35.2) 10183 (23.2) 0.27 Small urban (RIO score 10–39) 3192 (16.5) 12816 (25.4) −0.22 Rural (RIO score ≥ 40) 857 (3.8) 7249 (12.9) −0.33 Self-reported level of education High school 4071 (24.5) 14908 (31.4) −0.16 College or bachelor’s degree 9892 (60.7) 24573 (55.7) 0.10 Graduate or professional degree 2080 (14.1) 4898 (12.0) 0.07 Missing 123 (0.7) 390 (0.9) Self-reported financial situation Very comfortable 2278 (13.7) 7413 (17.1) −0.09 Comfortable 9579 (60.8) 27401 (61.2) −0.01 Tight, very tight or poor 3864 (22.7) 8702 (18.8) 0.10 Do not know or refused 445 (2.8) 1253 (2.9) Multimorbidity (having ≥ 3 chronic conditions) Yes 1412 (7.7) 4427 (8.9) −0.04 No 14754 (92.3) 40342 (91.1) Have called or tried to call primary care physician with a medical question or concern during the day on a Monday to Friday Yes 9560 (57.0) 24314 (53.9) 0.07 No 6524 (42.5) 20181 (45.5) Missing 82 (0.5) 274 (0.6) After-hours access to own primary care physician or clinic Yes 6500 (37.1) 18873 (42.6) −0.11 No 9665 (62.9) 25884 (57.3) Missing 1 (0) 12 (0.1) Saw own physician or clinic on same day or next day when sick† Yes 3398 (36.9) 8580 (40.3) −0.08 No 6030 (58.9) 12685 (54.8) Missing 436 (4.2) 1190 (4.9) Type of primary care models Virtually enrolled in a fee-for-service practice 920 (6.3) 1662 (4.0) 0.09 Enhanced fee-for-service practice 5829 (39.9) 19161 (25.7) 0.31 Non-team capitation practice 5107 (31.4) 13351 (32.2) −0.01 Team capitation practice 4009 (21.5) 18982 (37.0) −0.34 Other patient enrolment models 301 (0.9) 1513 (1.1) −0.02 Total visits to any primary care physician over 2 years, mean ± SD 11.6 ± 11.7 9.8 ± 11.1 0.01 Total visits to any primary care physician over 2 years, median (IQR) 9 (5–15) 7 (4–13) NA Total visits to the usual primary care physician over 2 years, mean ± SD 6.9 ± 8.1 7.3 ± 8.5 0 Total visits to the usual primary care physician over 2 years, median (IQR) 5 (3–9) 5 (3–9) NA Total visits to a primary care physician other than the usual physician over 2 years, mean ± SD 4.7 ± 6.0 2.5 ± 4.7 0.01 Total visits to a primary care physician other than the usual physician over 2 years, median (IQR) 3 (1–6) 1 (0–3) NA Note: IQR = interquartile range, NA = not applicable, RIO = Rurality Index for Ontario, SD = standard deviation.
↵* Unless indicated otherwise. Results were weighted.
↵† Variable excluded those who did not seek any medical care and those who did not see their own primary care physician or clinic (n = 32 319).
- Table 3:
Unadjusted and adjusted measures of association between self-reported walk-in use and other variables (n = 56 297)*
Variable OR (95% CI) Unadjusted model* Adjusted model† Sex Female 1.18 (1.17–1.18) 1.11 (1.04–1.18) Male Ref. Ref. Age, yr (per 1-yr increase) 0.97 (0.97–0.97) 0.97 (0.97–0.97) Rurality Large urban (RIO 0) Ref. Ref. Medium urban (RIO 1–9) 1.31 (1.31–1.31) 1.32 (1.21–1.43) Small urban (RIO 10–39) 0.56 (0.56–0.56) 0.73 (0.67–0.79) Rural (RIO ≥ 40) 0.26 (0.26–0.26) 0.33 (0.30–0.38) Self-reported level of education Graduate or professional degree Ref. Ref. Finished high school 0.66 (0.66–0.67) 0.84 (0.75–0.94) Finished college or university bachelor’s degree 0.92 (0.92–0.92) 0.94 (0.85–1.05) Self-reported financial situation Very comfortable Ref. Ref. Comfortable 1.24 (1.24–1.24) 1.15 (1.07–1.24) Tight, very tight or poor 1.51 (1.51–1.52) 1.22 (1.11–1.35) Multimorbidity (had ≥ 3 chronic conditions) Yes 0.86 (0.85–0.86) 1.28 (1.15–1.43) No Ref. Ref. Tried to contact physician’s office with a medical question or concern during the day on a Monday to Friday Yes 1.13 (1.13–1.13) 1.07 (1.00–1.14) No Ref. Ref. Reported that own primary care physician or clinic offers after-hours access Yes Ref. Ref. No 1.26 (1.26–1.26) 1.14 (1.07–1.21) Saw own physician or clinic on the same day or next day when sick Yes Ref. Ref. No 1.17 (1.17–1.18) 1.23 (1.13–1.34) Did not see their own physician or clinic 2.59 (2.58–2.60) 2.77 (2.49–3.09) Not applicable* 0.53 (0.53–0.53) 0.62 (0.57–0.68) Type of primary care model Team capitation practice Ref. Ref. Virtually enrolled in a fee-for-service practice 1.67 (2.66–2.68) 2.02 (1.76–2.32) Enhanced fee-for-service practice 2.67 (2.66–2.67) 1.94 (1.76–2.14) Non-team capitation practice 1.68 (1.68–1.68) 1.39 (1.28–1.52) Other patient enrolment model 1.35 (1.24–1.36) 2.02 (0.79–5.20) No. of visits to the usual primary care physician (per 1-visit increase) 0.99 (0.99–0.99) 0.99 (0.99–1.00) Note: CI = confidence interval, OR = odds ratio, Ref. = reference category.
* A different number of observations were used in unadjusted models because of missing values in the variable.
↵† Adjusted for sex, age, self-reported level of education, self-reported financial situation, rurality, multimorbidity (≥ 3 chronic conditions), access during office hours Monday to Friday, patient’s type of primary care model and the number visits to the usual primary care physician over 2 years.
↵* Not applicable included those who did not seek any medical care in the last 12 months.
- Table 4:
Association between measures of access and walk-in clinic use among residents of large and medium-sized urban areas (n = 34 110)*
Variables OR (95% CI) Unadjusted model Adjusted model† Reported that own primary care physician or clinic offers after-hours access Yes Ref. Ref. No 1.50 (1.49–1.50) 1.23 (1.14–1.32) Saw own physician or clinic on same day or next day when sick Yes Ref. Ref. No 1.28 (1.28–1.29) 1.25 (1.13–1.38) Did not see their own physician or clinic 3.23 (3.22–3.24) 3.01 (2.64–3.44) Not applicable‡ 0.60 (0.59–0.60) 0.63 (0.58–0.70) Note: CI = confidence interval, OR = odds ratio, Ref. = reference category.
↵* A different number of observations were used because of missing values in the variables.
↵† Adjusted for sex, age, self-reported level of education, self-reported financial situation, rurality, multimorbidity (≥ 3 chronic conditions), access during office hours Monday to Friday, patient’s type of primary care model and the number of visits to the usual primary care physician over 2 years.
↵‡ Included those who did not seek any medical care in the previous 12 months.
- Table 5:
Association between measures of access and walk-in clinic use, stratified by respondent’s primary care model, in large and medium-sized urban areas*
Variables OR (95% CI) Virtually enrolled to a FFS
n = 1691Enhanced FFS
n = 11 873Non-team capitation
n = 11 923Team capitation
n = 8527Reported that own primary care physician or clinic offers after-hours access Yes Ref. Ref. Ref. Ref. No 0.89 (0.67–1.18) 1.14 (1.01–1.30) 1.18 (1.07–1.31) 1.46 (1.26–1.68) Saw own physician or clinic on same day or next day when sick Yes Ref. Ref. Ref. Ref. No 1.04 (0.75–1.45) 1.21 (1.01–1.44) 1.39 (1.22–1.60) 1.25 (1.05–1.49) Did not see their own physician or clinic 2.59 (1.51–4.45) 2.58 (2.04–3.25) 3.48 (2.81–4.30) 3.40 (2.61–4.42) Not applicable† 0.54 (0.39–0.75) 0.61 (0.51–0.71) 0.61 (0.53–0.71) 0.81 (0.67–0.99) Note: CI = confidence interval, FFS = fee-for-service, OR = odds ratio, Ref. = reference category.
↵* Results obtained from separate regression models, adjusted for sex, age, self-reported level of education, self-reported financial situation, multimorbidity (≥ 3 chronic conditions), rurality, access during office hours and the number of visits to the usual primary care physician over 2 years.
↵† Included those who did not seek any medical care in the previous 12 months.
In this issue

Article tools


Related Articles
Cited By...
- No citing articles found.