


Abstract
Background: Physician home visits are essential for populations who cannot easily access office-based primary care. The objective of this study was to describe the characteristics, practice patterns and physician-level patient characteristics of Ontario physicians who provide home visits.
Methods: This was a retrospective cross-sectional study, based on health administrative data, of Ontario physicians who provided home visits and their patients, between Jan. 1, 2019, and Dec. 31, 2019. We selected family physicians who had at least 1 home visit in 2019. Physician demographic characteristics, practice patterns and aggregated patient characteristics were compared between high-volume home visit physicians (the top 5%) and low-volume home visit physicians (bottom 95%).
Results: A total of 6572 family physicians had at least 1 home visit in 2019. The top 5% of home visit physicians (n = 330) performed 58.6% of all home visits (n = 227 321 out of 387 139). Compared with low-volume home visit physicians (n = 6242), the top 5% were more likely to be male and practise in large urban areas, and rarely saw patients who were enrolled to them (median 4% v. 87.5%, standardized mean difference 1.12). High-volume physicians’ home visit patients were younger, had greater levels of health care resource utilization, resided in lower-income and large urban neighbourhoods, and were less likely to have a medical home.
Interpretation: A small subset of home visit physicians provided a large proportion of home visits in Ontario. These home visits may be addressing a gap in access to primary care for certain patients, but could be contributing to lower continuity of care.
Home-based primary care is an essential service for individuals who are homebound and cannot easily access office-based primary care.1–3 Without primary care at home, these individuals have more emergency department visits and hospitalizations.4–6 Among patients at the end of life, physician home visits increase the likelihood of dying at home, which is desired by many.7 Home visits are also perceived positively by patients, caregivers and providers.8
Prior research in Ontario has focused on physicians who perform home visits for patients who are older, are functionally impaired and require home care.6 However, recent evidence suggests that up to half of physician home visits are for low-complexity patients who are younger than 50 years and in self-reported good health.9,10 These patients were least likely to have had a previous encounter with the home-visiting physician and had low levels of previous and subsequent health care utilization.10 Little is known about the physicians who provide home visits to this subset of patients.
Though home visits have been declining since the 1930s,9,11,12 there has been a recent resurgence in the number of physician home visits in both the United States13–15 and Canada.3 However, the overall number of home-visiting US physicians has been decreasing, suggesting that a small number of physicians are performing a high volume of home visits.13,14 Given the rapidly aging Canadian population, there is a need to plan for increasing numbers of homebound and palliative patients, by understanding who is providing home visits and how they practise. In this study, we sought to describe the characteristics and practice patterns of family physicians who provided home visits compared with those who did not provide home visits in Ontario. We hypothesized that high-volume home visit physicians would have different practice patterns from physicians with a low volume of home visits, and we explored this group and the characteristics of their home visit patients.
Methods
Ontario is the most populous province in Canada, with about 14.5 million residents in 2019. The Ontario Health Insurance Plan (OHIP) provides public health insurance to all residents, without premiums or copayments. In Ontario, primary care is mostly provided by family physicians. Most of these practise within a medical home, known in Ontario as a primary care enrolment model,16 where they work in a group of physicians who share accountability for after-hours care, formally enroll patients and receive some blended payments.2,4,6,7,17–19 Physicians not working in a medical home are paid on a fee-for-service basis.16 About 93% of Ontarians aged 16 years or older have a primary care provider, and 82% are formally enrolled in a medical home.16,20 Despite enrolment, patients are not restricted to only seeing their usual physician, and may see other physicians within or outside their medical home. Physicians may choose to provide home visits to their patients for a variety of reasons (e.g., for homebound patients who cannot easily make it to the office), but providing home visits is not a requirement.21 The Ontario Ministry of Health incentivizes physician home visits by offering special visit premiums22 and volume-based bonus payments, which take into account both the number of patients seen and the number of overall encounters (see Appendix 1, Table S1, available at www.cmajopen.ca/content/11/2/E282/suppl/DC1, for volume incentive thresholds).23
Study design and data sources
This was a retrospective, population-based cross-sectional study of family physicians, using administrative health data sets. Data sets were linked using unique encoded identifiers and analyzed at ICES. ICES is an independent, nonprofit research institute whose legal status under Ontario’s health information privacy law allows it to collect and analyze health care and demographic data, without consent, for health system evaluation and improvement. The databases we used included the Client Agency Program Enrolment Database; the Discharge Abstract Database; the Home Care Database; the ICES Physician Database; the Immigration, Refugees, and Citizenship Canada Permanent Resident Database; the National Ambulatory Care Reporting System, OHIP and the Registered Persons Database (see Appendix 1, Table S2 for database descriptions). To aid study reporting, we used the Strengthening the Reporting of Observational Studies in Epidemiology Checklist and the Reporting of Studies Conducted Using Observational Routinely-collected Data guideline.24,25
Study population and physician groups
Home visit physicians
We first identified all Ontario physicians who provided at least 1 home visit between Jan. 1 and Dec. 31, 2019, and then restricted to family physicians. The first home visit per physician was selected as the “index” visit.
Home visit physician volume groups
Based on the distribution of the Lorenz curve and the degree of inequality in home visit volumes observed, we identified that the top 5% of physicians likely practised differently from the bottom 95%.26 These became the high- and low-volume home visit physician groups, respectively. We created additional categories based on home visit volume incentive thresholds from the Ontario Ministry of Health, grouping physicians according to their annual counts of visits and patients served (Appendix 1, Table S1).
Office visit physicians
We evaluated all family physicians in Ontario with an active billing number and who provided at least 1 office visit between Jan. 1 and Dec. 31, 2019, and who did not provide any home visits. We selected each physician’s first office visit as the index visit.
Physician characteristics
Measures included physician age, self-reported gender (as “male” or “female”), location of graduating medical school (Canada or other), location of practice (urban or rural) based on Rurality Index for Ontario scores,27 and type of medical home (primary care enrolment model). We also measured the following aggregated physician-level practice measures from Jan. 1, 2019, to Dec. 31, 2019: number of home visits and unique patients, number of home visits per patient, proportion of total fee-for-service billings from home visits, number of patients seen on a day doing home visits, number of home visits per day with at least 1 home visit and proportion of home visits made during off-hours (evenings, weekends or holidays).
Physician-level home visit patient characteristics
Home visit patient characteristics were aggregated at the physician level, such that for each physician we measured the following: proportion of patients aged 65 years and older, proportion of patients living in a lower-income neighbourhood, proportion of patients residing in a large urban area, proportion of patients who were recent immigrants,28 proportion of patients enrolled to the physician personally or enrolled to a member of the visiting physician’s group, proportion of patients previously known to the physician from an encounter in any setting in the previous 2 years, and proportion of patients not enrolled in a medical home. We then calculated the median (interquartile range [IQR]) proportion across all physicians, for each of these measures. Using the definitions of visit type used previously10 (see Appendix 1, Table S3 for definitions), we also reported the median proportion of home visits that were palliative, to patients who received home care, or neither. As we have previously done, we used receipt of home care as a proxy for a level of functional impairment that could limit the ability to exit the home to attend a medical appointment.10 Although not all home care recipients are homebound, many of them are.29
We examined the physicians’ typical (median) home visit patient’s age, as well as their patients’ health care resource utilization over the previous 2 years (obtained from The Johns Hopkins ACG System version 10) grouped into low (0–2), moderate (3) and high (4–5) ACG System Resource Utilization Bands30 (see Appendix 1, Table S4 for operational definition of all variables).
Statistical analysis
Lorenz curve
To explore the distribution of home visit volumes performed by home visiting physicians, we used a Lorenz curve analysis. 31,32 The greater the deviation of the curve from the diagonal midline, the more inequality there is among physicians, indicating that a small number of physicians provide a high proportion of all home visits. We calculated the Gini coefficient from the Lorenz curve, which is a numerical representation of equality on a scale of 0 to 1, with numbers closer to 1 indicating greater inequality.26,33 The findings from the Lorenz curve guided us in selecting a threshold for the high-volume physicians; around the top 5% we observed a sharp uptick in the proportion of home visits.26 We also examined a graph of the raw number of home visits per home visit physician and found a similar rise at around the top 5% (Appendix 1, Figure S1).
Physician comparisons
We described the characteristics of physicians providing home visits either as physician-level medians of patient proportions (median percentage, IQR) or as counts and frequencies of aggregated patient medians.
We made 2 comparisons based on home visit volumes: high-volume physicians (top 5%) compared with low-volume home visit physicians, and low-volume home visit physicians compared with physicians who did not provide any home visits (i.e., office visit physicians). Statistical comparisons were made using the standardized mean difference (SMD), with 10% (0.1) considered meaningful.34 As an additional sensitivity analysis, we examined physician characteristics across volume incentive thresholds using the Kruskal–Wallis tests for median variables, and χ2 test for categorical variables, at a 2-tailed p < 0.05 significance threshold (Appendix 1, Table S5). In a post-hoc sensitivity analysis suggested by a reviewer, we also compared the top 1% of physicians with the bottom 99% (Appendix 1, Table S6). All comparisons were unadjusted, as we sought to describe and contrast the real-world characteristics and practice patterns of home visit physicians. All analyses were done in SAS software, version 9.4 (SAS Institute Inc.).
Ethics approval
The use of the data in this project is authorized under Section 45 of Ontario’s Personal Health Information Protection Act and does not require review by a research ethics board.
Results
A total of 7211 physicians in Ontario provided at least 1 home visit during the study period, and 6572 of these practised family medicine (Figure 1). There were 8186 family physicians who provided at least 1 office visit and no home visits during the study period. In 2019, 387 139 home visits were performed by 6572 family physicians (Figure 2). In contrast, 44 938 718 office visits were performed by 14 758 family physicians. Home visits represented 0.9% of the total combined office and home visits provided by all family physicians in the cohort. Of home visits, 90% (n = 348 430) were performed by the top 26.8% (n = 1765) of physicians. The top 10% of physicians (n = 658) performed 73.0% of all home visits (n = 282 762), and the top 5% (n = 330) performed 58.6% (n = 227 321, Gini coefficient = 0.82; see Appendix 1, Figure S2 for infographic). The top 5% of home visit physicians were 2.2% of all family physicians in the cohort.

Flowchart for cohort of home-visiting physicians from Jan. 1, 2019, to Dec. 31, 2019.
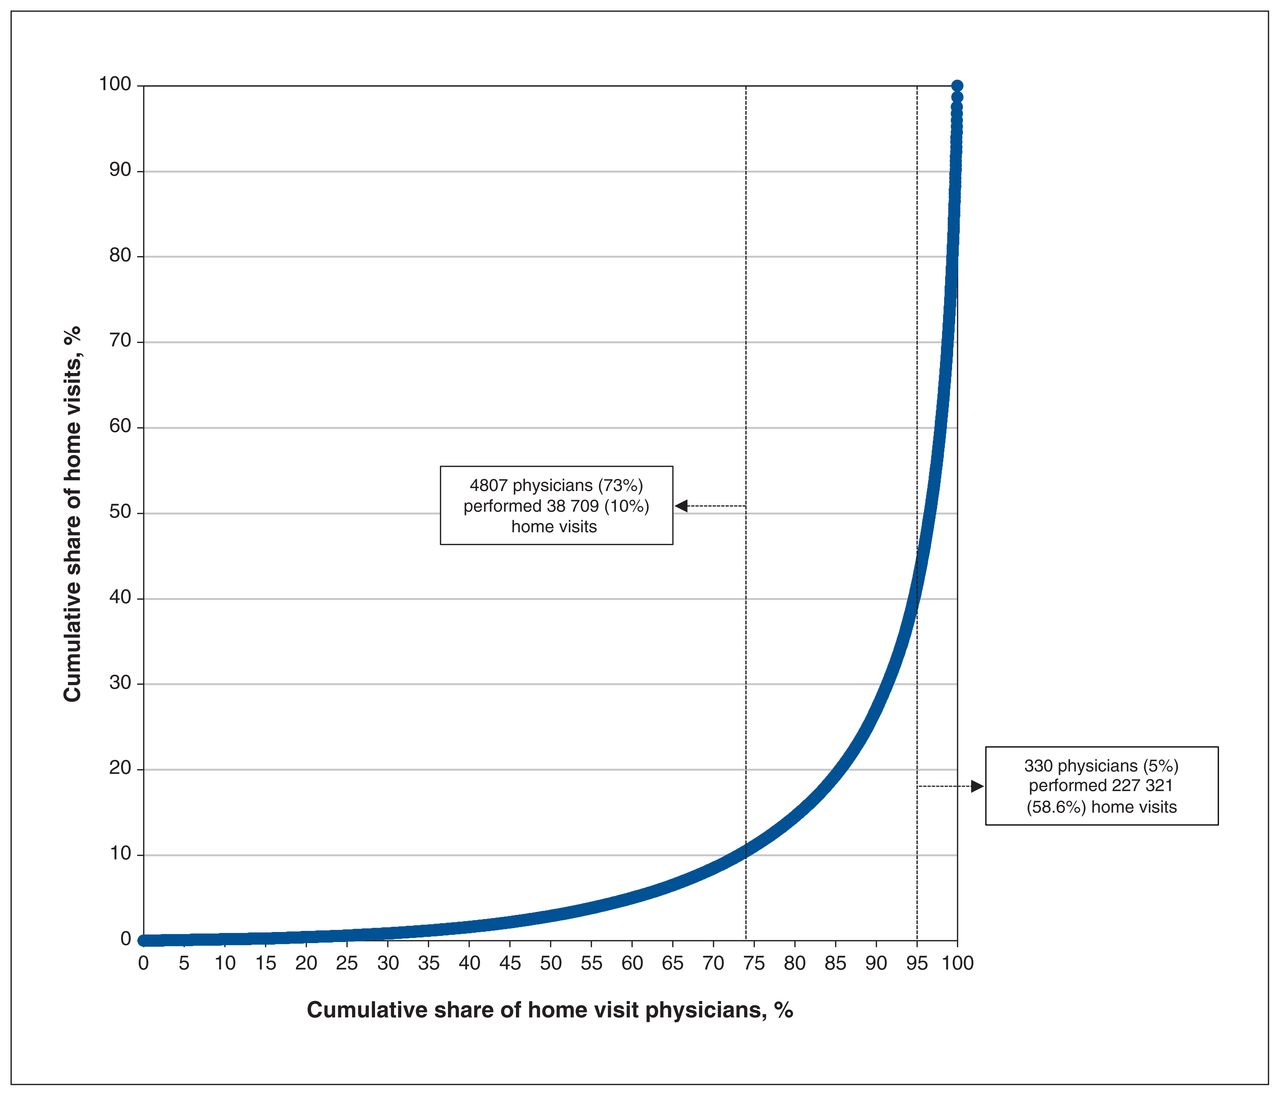
Lorenz curve of home visits and home-visiting family physicians, from Jan. 1 to Dec. 31, 2019, in Ontario, Canada. This curve was generated by rank-ordering family physicians by their volume of home visits, then plotting the cumulative percent of physicians (x-axis) against the cumulative percent of home visits (y-axis).
Characteristics of high-volume compared with low-volume home visit physicians
The top 5% of home visit physicians (n = 330) were more likely to be male (63.3% v. 53.7%, SMD 0.20) and to practise in large urban locations (54.8% v. 43.1%, SMD 0.24). Overall, 83.9% of home-visiting physicians were part of a medical home; however, this was more common in the low-volume group than in the high-volume group (64.5% v. 84.9%, SMD 0.48; Table 1). High-volume physicians were more likely to practise in a fee-for-service model (35.5% v. 15.1%, SMD 0.48).
Characteristics of physicians, practice patterns and patient characteristics for the high-volume home visit physicians (top 5%) compared with low-volume home visit physicians (Jan. 1–Dec. 31, 2019)
A total of 123 103 unique patients received 1 or more home visits during the study period. The high-volume physicians performed a median of 477.5 (IQR 346–813) home visits and saw 126 unique home visit patients (IQR 79–240) in 2019, compared with 9 visits (IQR 2–28) and 5 patients (IQR 2–12) for low-volume physicians (SMD 2.58, 2.5). A median of 31.5% (IQR 16.6%–51.6%) of the high-volume physicians’ total fee-for-service income came from home visits, compared with 0.9% (IQR 0.2%–3.4%) for low-volume physicians (SMD 2.22). Off-hours home visits were performed more often by high-volume physicians (median 17.9% v. 16.7%, SMD 0.27).
High-volume physicians also provided 1 157 947 office visits to 383 989 patients. Home visits were 16.4% of their combined total office and home visits, and 17.7% of patients seen. Low-volume physicians made 21 564 455 office visits to 8 414 740 patients. Home visits were 0.7% of their visits, and 0.9% of their patients seen.
Characteristics of home visit patients of high-volume compared with low-volume physicians
Low-volume home visit physicians were more likely to have home visit patients with a median age of older than 80 years compared with high-volume home visit physicians. Although a median of 73% of the high-volume physicians’ patients belonged to a medical home, only a median of 4% (IQR 0%–56.3%) of the home visits they provided were to patients enrolled to them or their own group, compared with 87.5% (IQR 28.6%–100.0%) for low-volume physicians (SMD 1.12). High-volume physicians saw fewer home visit patients who were previously known to them in the prior 2 years than low-volume physicians (72.3% v. 100%, SMD 1.13). Compared with low-volume physicians, home visit patients of high-volume physicians were more likely to live in lower-income neighbourhoods (physician-level median of 46.4% v. 37.5%, SMD 0.23) and large urban areas (physician-level median of 66.4% v. 6.3%, SMD 0.29), and were more likely to be recent immigrants (physician-level median 0.2% v. 0%, SMD 1.19). Additionally, high-volume physicians saw more palliative patients (physician-level median 7.1% v. 3.8%, SMD 0.30) and patients who neither had a palliative visit nor received home care (physician-level median of 42.6% v. 29.4%, SMD 0.10) than low-volume physicians.
Comparison of low-volume home visiting physicians with office visit physicians who did not provide home visits
Low-volume home visit physicians were older than those who did not provide home visits at all (median 50 yr v. 46 yr, SMD 0.21; Table 2). Low-volume physicians were also more likely to practise in rural (9.9% v. 5.9%, SMD 0.15) or small urban locations (20.8% v. 12.7%, SMD 0.22), and were more likely to belong to a medical home (84.9% v. 48.8%, SMD 0.83) than physicians who did no home visits.
Characteristics of physicians who provided office visits and no home visits, compared with low-volume home visit physicians (Jan. 1–Dec. 31, 2019)
Trends across volume incentive thresholds and top 1% of home visit physicians
Differences across volume incentive thresholds were consistent with the comparison of the top 5% and low-volume home visit physicians. As home visit volume increased, there was a decrease in the proportion of female physicians as well as the proportion of home visits made to physicians’ own enrolled patients or to patients in their group, patients previously known to them, patients with moderate levels of health care usage, home care recipients and palliative home visits (Appendix 1, Table S5). Conversely, we saw an increase in the physician-level proportion of patients who lived in lower-income neighbourhoods or large urban areas, patients who were not in a medical home, and patients who were neither receiving palliative care nor receiving home care services.
A comparison of the top 1% of home visit physicians with the bottom 99% (Appendix 1, Table S6) identified findings similar to the comparison of the top 5% with the bottom 95%, although the magnitude of differences was further accentuated, and the top 1% had a smaller proportion of physicians providing palliative home visits and home visits to home care recipients.
Interpretation
In this population-based study of all family physicians providing home visits in Ontario in 2019, we found that the top 5% of physicians by home visit volume performed more than half of all home visits in the province. A median of only 4% of home visits performed by high-volume physicians were to patients enrolled to them personally or to their group, compared with 87.5% for low-volume home visit physicians. A related finding was that a lower percentage of high-volume physicians belonged to a medical home. Although most patients seen by high-volume physicians were enrolled in a medical home, high-volume physicians still saw more unenrolled patients than the low-volume physician group.
Similar to previous findings, we found high-volume home visit physicians were more frequently male than low-volume physicians.6 Additionally, our findings that low-volume physicians were older and most often practised in rural locations are concordant with research from other provinces35,36 and the US.13 High-volume physicians’ home visit patients were younger, lived in lower-income and large urban neighbourhoods, were more likely to be recent immigrants, and had higher levels of health care utilization than home visit patients of low-volume physicians.
Given that large urban areas have higher population density than rural areas, this could contribute to high-volume physicians’ ability to see so many patients in a year. There is also the possibility that some of the high-volume physicians work in group or retirement homes and can see a large volume of patients without travelling a great distance. However, high-volume physicians also provided many visits in an office setting, suggesting that these physicians may not be working exclusively as home visit doctors.
Low-volume physicians’ visits to patients who were neither receiving palliative care nor receiving home care accounted for 29.4% of their total home visits, compared with 42.6% for high-volume physicians.10 From previous findings, we know that these “other” home visit patients (i.e., neither palliative care nor home care recipients) are most commonly diagnosed with acute conditions, such as bronchitis and nasopharyngitis, which often may not require longitudinal care.10 Some of the home visits by high-volume physicians could consist of on-demand home visits marketed directly to patients by companies such as HippoMD, MD Home Call and Medvisit. In this model, service is driven by patients who determine where and when they receive care.37 Yet, on-demand home visit services may also provide a low-barrier option for those without a family physician, as well as those with disabilities, without transportation or without alternative child care — who cannot access their usual physician for an acute condition. Given high-volume physicians’ patient characteristics (i.e., younger, lower income, higher health care utilization and a greater percentage of recent immigrants), these services may be addressing a gap in equitable access to primary health care.
The finding that 83.9% of home visit physicians belonged to a medical home is important because it suggests the bonus incentives are working mostly as intended — by encouraging enrolling physicians to provide home visits to their enrolled patients, longitudinally. Home visits within existing primary care relationships support access while also maintaining care continuity. Greater patient–physician continuity is associated with fewer emergency department visits and hospitalizations, as well as higher levels of patient and physician satisfaction. 38,39 Additionally, there is evidence that home care patients who are enrolled to physicians who provide more home visits have lower rates of emergency department use and hospital admissions than those who are enrolled to physicians who provide no home visits.6 Here, we found that high-volume physicians rarely saw patients who were enrolled to them or their group — the benefits of a home visit with someone other than the enrolling physician may not be the same, and are as yet unknown.
It may not always be possible for the patient’s own enrolling physician to provide home visits themselves, and our findings suggest that home visit physicians may fill this gap. A physician-level median of 72.3% of the high-volume physicians’ home visit patients were known to them in the prior 2 years, suggesting fairly high relational continuity with the home visit physician, if not with their enrolling physician. Though our study does not provide direct insight into informational continuity, we do know that it is not a requirement for home visit physicians to communicate with the patient’s enrolling physician. Policy-makers could consider strengthening informational continuity by requiring home visit physicians to share notes with the patient’s enrolling physician, or through a shared electronic patient record, which is not universal in Ontario.
Some physicians who provide a high volume of home visits may also be specializing in home visits. Policy-makers might consider how high-volume home visit physicians fit into existing payment structures and professional practice standards. Such home visit specialists may benefit from a focused practice designation, allowing for unique continuing medical education opportunities, competencies and oversight.
Whereas previous studies of home visit physicians focused on specific patient populations (e.g., palliative, homebound, frail or older patients2,4,6,7,17–19), we examined all family physicians who provided home visits. However, our finding that high-volume physicians saw more patients receiving palliative care than low-volume physicians suggests this is a growing area of care. Indeed, the volume of palliative home visits from 2005 to 2019 increased more than sevenfold and accounted for the largest proportion of overall growth in home visit volume. 10 Given Canada’s aging population, more home visit physicians who specialize in palliative care will likely be needed in the future.
To better understand the reasons why Ontario physicians may choose to provide home visits, additional qualitative work is necessary. Our findings suggest that financial incentives likely play a role; however, this is not the full picture. For example, physicians may be motivated to offer home visits by the characteristics of individual patients (i.e., homebound or palliative), by patient requests or their own personal preferences for care delivery. Conversely, physicians may choose not to provide home visits for reasons such as a lack of home visit training, little back-up support or long travel times.21 Another area for future research is measuring the outcomes (including subsequent health care utilization) of lower-complexity patients after home visits with physicians to whom they are not enrolled.
Limitations
There are several limitations to our study. Health administrative data sources do not show the detailed reasons why or how high-volume physicians see so many patients — all we can observe is their billing patterns. We did not examine quality-of-care indicators, such as the efficiency or effectiveness of home visits. In using health administrative data, we cannot know patients’ perspectives and why they may have sought a home visit rather than an office visit with their enrolled physician. Although we can hypothesize that they may face barriers in accessing their family physician, we do not have the qualitative data to support this. Our findings are set in Ontario and may not be generalizable to settings without public funding coverage for physician home visits. Finally, our study period occurred before the COVID-19 pandemic. Given a shift to providing telehealth and virtual visits during the pandemic,40,41 more research is needed to evaluate how the practice patterns of physicians who provide home visits have changed over time.
Conclusion
We found that the top 5% of home visit physicians provided more than half of all home visits in 2019. These high-volume home visit physicians rarely saw patients who were enrolled to them or their group — in fact, many of their patients were enrolled to other family physicians. Patients of high-volume physicians were younger, lived in lower-income and large urban neighbourhoods, and were more likely to be recent immigrants. Physicians who provide home visits may enhance access to primary care for those who face barriers to attending office visits or who are otherwise unattached. Our findings can be used to inform further research and policies to support optimal integration of physician home visits into comprehensive primary care.
Footnotes
Competing interests: None declared.
This article has been peer reviewed.
Contributors: Lauren Lapointe-Shaw, Christine Salahub, Tara Kiran and Noah Ivers contributed to the conception and design of the work. Lauren Lapointe-Shaw, Christine Salahub and Yingbo Na analyzed the data. Lauren Lapointe-Shaw and Christine Salahub created the first draft. All authors interpreted the data, revised it critically for important intellectual content, gave final approval of the version to be published, and agreed to be accountable for all aspects of the work.
Funding: Lauren Lapointe-Shaw is supported by the University of Toronto Department of Medicine, the Toronto General Hospital Research Institute, the Women’s College Institute for Health System Solutions and Virtual Care, and the Peter Gilgan Centre for Women’s Cancers at Women’s College Hospital, in partnership with the Canadian Cancer Society. Tara Kiran is the Fidani Chair of Improvement and Innovation at the University of Toronto and is supported as a clinician scientist by the Department of Family and Community Medicine at St. Michael’s Hospital and the University of Toronto. Noah Ivers is supported by a Canada Research Chair in Implementation of Evidence-based Practice and a Clinician Scholar Award from the Department of Family and Community Medicine at Women’s College Hospital and the University of Toronto. Nathan Stall is supported by the Department of Medicine’s Eliot Phillipson Clinician-Scientist Training Program and the Clinician Investigator Program at the University of Toronto and the Vanier Canada Graduate Scholarship. Andrew Costa is Schlegel Research Chair in Clinical Epidemiology and Aging at McMaster University.
Data sharing: The data set from this study is held securely in coded form at ICES. While legal data-sharing agreements between ICES and data providers (e.g., health care organizations and government) prohibit ICES from making the data set publicly available, access may be granted to those who meet prespecified criteria for confidential access, available at https://www.ices.on.ca/DAS (email: das{at}ices.on.ca). The full data set creation plan and underlying analytic code are available from the authors on request, understanding that the computer programs may rely on coding templates or macros that are unique to ICES and are therefore either inaccessible or may require modification.
Disclaimer: This study was supported by ICES, which is funded by an annual grant from the Ontario Ministry of Health (MOH) and the Ministry of Long-Term Care (MLTC). Parts of this material are based on data and information compiled and provided by MOH, MLTC, Immigration, Refugees and Citizenship Canada current to December 2021, and Canadian Institute for Health Information. The analyses, conclusions, opinions and statements expressed herein are solely those of the authors and do not reflect those of the funding or data sources; no endorsement is intended or should be inferred.
Supplemental information: For reviewer comments and the original submission of this manuscript, please see www.cmajopen.ca/content/11/2/E282/suppl/DC1.
This is an Open Access article distributed in accordance with the terms of the Creative Commons Attribution (CC BY-NC-ND 4.0) licence, which permits use, distribution and reproduction in any medium, provided that the original publication is properly cited, the use is noncommercial (i.e., research or educational use), and no modifications or adaptations are made. See: https://creativecommons.org/licenses/by-nc-nd/4.0/
References
- © 2023 CMA Impact Inc. or its licensors
In this issue

Article tools


Related Articles
Cited By...
- No citing articles found.