


Abstract
Background: It is unknown how much of current physician home visit volume is driven by low-complexity or low-continuity visits. Our objectives were to measure physician home visit volumes and costs in Ontario from 2005/06 to 2018/19, and to compare patient characteristics and postvisit use of health care services across home visit types.
Methods: This was a retrospective cross-sectional study using health administrative data. We examined annual physician home visit volumes and costs from 2005/06 to 2018/19 in Ontario, and characteristics and postvisit use of health care services of residents who received at least 1 home visit from any physician in 2014/15 to 2018/19. We categorized home visits as palliative, provided to a patient who also received home care services or “other,” and compared characteristics and outcomes between groups.
Results: A total of 4 418 334 physician home visits were performed between 2005/06 and 2018/19. More than half (2 256 667 [51.1%]) were classified as “other” and accounted for 39.1% ($22 million) of total annual physician billing costs. From 2014/15 to 2018/19, of the 413 057 home visit patients, 240 933 (58.3%) were adults aged 65 or more, and 323 283 (78.3%) lived in large urban areas. Compared to the palliative care and home care groups, the “other” group was younger, had fewer comorbidities, and had lower rates of emergency department visits and hospital admissions in the 30 days after the visit.
Interpretation: About half of physician home visits in 2014/15 to 2018/19 were to patients who were receiving neither palliative care nor home care, a group that was younger and healthier, and had low use of health care services after the visit. There is an opportunity to refine policy tools to target patients most likely to benefit from physician home visits.
Homebound people face challenges accessing preventive, chronic and acute care, which leads to adverse health effects and an overreliance on emergency and hospital-based services.1–3 Home-based primary care4 can reduce the use of emergency department visits and hospital admissions for homebound older adults,5–8 can provide essential information about patients’ needs and home life,9 and is perceived positively by patients, caregivers and providers.10–12 For many homebound older adults, strengthening primary care at home has the twin benefits of shifting care out of hospitals and delaying the need for residential long-term care.13 Similarly, patients near the end of life have complex health care needs, yet often prefer to spend their last days at home with loved ones rather than in a residential hospice setting.14 Physician home visits may also increase the likelihood of death occurring at home, which is preferred by many patients.15,16
Access to physician home visits is essential to meet the needs of those receiving palliative care and other homebound patients. Although rates of physician home visits are still declining in some regions, financial incentives have driven a resurgence in these visits in the United States.17–19 Yet, to our knowledge, there have been no population-based studies of physician home visit provision in Canada aside from 2 studies in specific subgroups (palliative care16 and home care8 recipients). Financial incentives for physician home visits were introduced in 2005 and 2012 in Ontario, Canada’s most populous province.20,21 However, incentives may reward providers and companies that aim to maximize profits by offering short, low-complexity visits, disconnected from patients’ existing health care teams.
It is unknown how much of current physician home visit volume and billing costs are driven by low-complexity or low-continuity visits. Our objectives were to measure physician home visit volumes and billing costs in Ontario from 2005/06 to 2018/19, and to compare patient characteristics and postvisit use of health care services across home visit types. We hypothesized that many recipients of physician home visits were receiving neither palliative care nor additional home care, and aimed to explore how this group’s characteristics and postvisit use of health care services differed from those of the palliative and home care groups.
Methods
Study design and setting
This retrospective cross-sectional study used health administrative data sets linked by means of unique encoded identifiers and analyzed at ICES in Ontario. ICES holds information on physician and emergency department visits, hospital stays and publicly funded home health care in Ontario (databases used are listed in Appendix 1, Table S1, available at www.cmajopen.ca/content/10/3/E732/suppl/DC1). Because of the universal nature of coverage of physician and hospital services under the Ontario Health Insurance Plan, this study was population based.
With 14.5 million residents, Ontario accounts for more than 38% of Canada’s total population.22 Public health insurance is provided without premium or copay through the Ontario Health Insurance Plan. Overall, 93% of Ontario residents report having a primary care provider, with 82% formally enrolled to a physician working in a Patient Enrolment Model,23 a model in which physicians work in groups, have shared responsibility for after-hours care, and receive some blended payments and incentives. Primary care physicians not practising in a patient enrolment model work independently and are paid on a fee-for-service basis.24
To incentivize the provision of physician home visits, the Ontario Ministry of Health has long offered special visit premiums for visits in a home setting. However, in 2005, a more remunerative special visit premium was introduced for palliative home visits, with a dollar value 3 times that of the corresponding code for a regular home visit.20 In 2012, additional annual bonus payments were introduced, paying physicians who provide the highest volume of nonpalliative primary care home visits up to an additional $8000 annually (Appendix 1, Tables S2A and S2B).21
We used the STROBE checklist for cross-sectional, observational studies.25
Study population
For our population-level analysis of physician home visits over time, we included all Ontario residents with a valid health card and at least 1 home visit between Apr. 1, 2005, and Mar. 31, 2019. We defined a physician home visit using a combination of dedicated home visit billing codes (Appendix 1, Table S3) and other assessment codes with a location of “home.”26 Physicians who performed home visits could be from any specialty (family medicine or other).
For our patient-level analysis, we further narrowed the inclusion period to the 5 most recent years (2014/15 to 2018/19), as these would be most relevant to current policymaker decision-making. We selected the first physician home visit per patient and excluded all others.
Measures
Stratification of physician home visits
We categorized physician home visits by the type of recipient (palliative care, home care or other). We used billing codes to determine whether the visit was palliative (Appendix 1, Table S3). We categorized recipients as receiving home care if they had 2 or more services in the previous 30 days provided by personal support workers, nurses or other allied health care professionals, but not physicians. We used home care as a proxy for a level of functional impairment that would impede attendance at medical appointments outside of a home setting. We defined “other” visits as visits that were neither palliative nor to a home care recipient. We did not know a priori what types of visits would be included in this group, although on-demand appointments for viral illnesses were likely candidates.
Home visit volume and cost over time
We used Statistics Canada’s Ontario population estimates to calculate annual physician home visit volume per 10 000 people. 22 We also measured the annual total cost of physician billings associated with encounters that had at least 1 home visit code, stratified by type (palliative, home care or other).
Patient characteristics and postvisit use of health care services
Patient-level baseline characteristics included the following demographic characteristics: age, sex, urban versus rural residence, 27 census-based neighbourhood income quintile, immigrant status28 and limited proficiency in English or French (available for all immigrants landing in Ontario after 1985). We also included the count of comorbidities over the previous 2 years using Johns Hopkins Aggregated Diagnosis Groups;29 use of health care services over the previous 2 years, grouped into low (≤ 2), moderate (3) and high (4–5) Resource Utilization Bands;29 emergency department visits in the previous 30 days; hospital discharge in the previous 30 days; count of outpatient physician visits in the previous year; home care in the previous 30 days; emergency department visit or hospital admission for a mental health condition in the previous 2 years;30 history of dementia,31 asthma,32,33 diabetes,34 chronic obstructive pulmonary disease35 or congestive heart failure;36 and postpartum status.37 We also included information on primary care attachment. Operational definitions of all variables are provided in Appendix 1, Table S4.
The Resident Assessment Instrument – Home Care is a validated tool covering social, functional and health dimensions. 38–40 This tool is used for the roughly 40% of Ontario home care recipients who are “long-stay” or expected to have care needs beyond 60 days, and is typically completed every 6 months.41–43 For the subgroup of patients who had a Resident Assessment Instrument – Home Care completed within 6 months before the index home visit, we reported whether the recipient had hearing impairment, vision impairment or a caregiver in the home, used an assistive device or was dependent on others for locomotion, as well as their homebound status.3
We included the following variables relating to relational continuity between patient and physician: whether the patient was formally enrolled to the home visiting physician, whether the patient was enrolled to a physician in the same group as the home visiting physician, and whether the patient was known to the home visiting physician from another encounter in the previous year. In addition, we reported patient events after the index physician home visit: repeat home visits in the subsequent year, and office physician visit, emergency department visits or urgent hospital admission within 30 days.
Statistical analysis
We plotted the annual count of home visits per 10 000 Ontarians and the annual total cost of physician home visit billings over time, stratified by type of recipient (palliative care, home care or other).
In our patient-level analysis, we described baseline, patient–physician dyad and postvisit characteristics using counts and frequencies, as well as medians and interquartile range. We reported pairwise comparisons using standardized mean differences, with a threshold of 0.1 (10%) considered meaningful.44 All analyses were executed in SAS software, version 9.4 (SAS Institute).
Subgroup analyses
We examined 2 subgroups: rural residents and patients less than age 18 years at the time of the index home visit. For the latter group, we determined whether each patient had a history of a pediatric complex chronic medical condition.45
Ethics approval
This study was exempt from ethics review under section 45 of Ontario’s Personal Health Information Protection Act.
Results
Physician home visit volume and cost
A total of 4 418 334 physician home visits were performed between 2005/06 and 2018/19. The population-adjusted annual home visit volume was 224 per 10 000 people in 2005/06. It declined slightly from 2005/06 to 2007/08, remained stable from 2007/08 to 2012/13, and then increased to a maximum of 307 per 10 000 people in 2018/19, an increase of 37% relative to 2005/06 (Figure 1). Although palliative visits accounted for only 906 468 (20.5%) of all physician home visits, the volume of palliative visits per 10 000 people increased more than sevenfold and accounted for 88.5% of the growth in home visit volume over the study period. Home care recipients received 1 255 199 (28.4%) of all physician home visits, and patients in the “other” group received 2 256 667 visits (51.1%).

Annual physician home visits per 10 000 people in Ontario, 2005/06 to 2018/19, by type of visit. Dotted vertical lines at 2005/06 and 2012/13 mark the introduction of premium billing codes for palliative home visits and higher-volume incentives for primary care home visits, respectively.
The total annual cost of billings for physician home visits peaked at $56.3 million in 2018/19 (Figure 2). Palliative visits accounted for 40.7% ($22.9 million) of this cost, home care visits for 20.2% ($11.4 million), and “other” visits for 39.1% ($22 million).
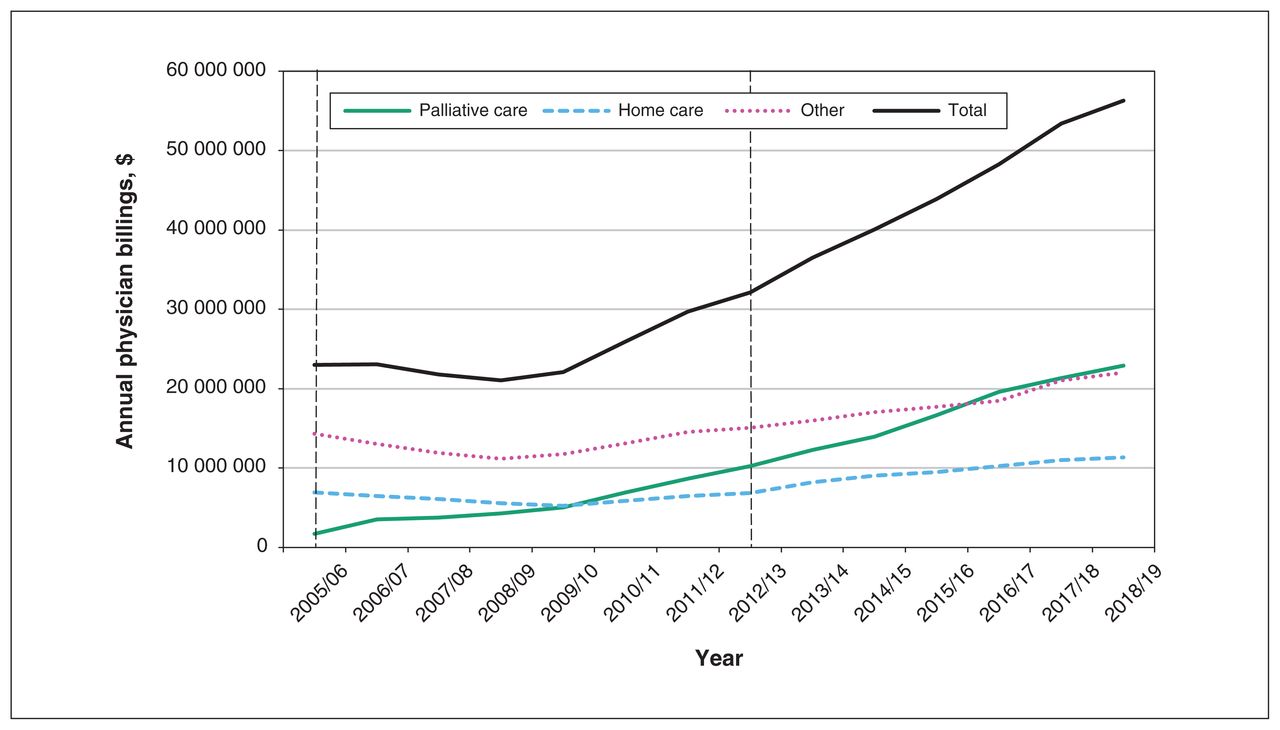
Annual total physician billings for home visits in Ontario, 2005/06 to 2018/19, by type of visit. Dashed vertical lines at 2005/06 and 2012/13 mark the introduction of premium billing codes for palliative home visits and higher-volume incentives for primary care home visits, respectively.
Patient characteristics
Of the 4 418 334 physician home visits, 2 445 955 occurred before Apr. 1, 2014, 1005 were excluded because the health card number was invalid or the patient was ineligible for the Ontario Health Insurance Plan, and 1 558 317 were visits other than the index visit. The remaining 413 057 patients received at least 1 physician home visit from 2014/15 to 2018/19. Of the 413 057, 71 963 (17.4%) received 1 repeat home visit in the subsequent year, and 131 338 (31.8%) received 2 or more repeats visits in the subsequent year.
Of the 413 057 patients, 53 997 (13.1%) were children, 118 127 (28.6%) were adults less than age 65, and 240 933 (58.3%) were adults aged 65 or more (Table 1). More than half (238 087 [57.6%]) were female, and the majority (323 283 [78.3%]) resided in large urban settings. More than half (239 274 [57.9%]) were high health care users, but the majority (261 465 [63.3%]) had not received any home care in the previous month. Three-quarters (307 637 [74.5%]) were formally enrolled to a primary care physician; however, the physician who made the home visit(s) was their primary care physician or another physician in the same group in only 133 830 cases (32.4%).
Characteristics of patients who received a physician home visit in Ontario from Apr. 1, 2014, to Mar. 1, 2019
Comparison between physician home visit types
Of all patients who received a first physician home visit in 2014/15 to 2018/19, 78 463 (19.0%) had a palliative visit, and 83 151 (20.1%) received home care; the remaining 251 443 patients (60.9%) were classified as receiving “other” care. Compared to palliative care and home care recipients, the “other” group contained more children and young adults, more people living in a large urban setting and more immigrants (Table 1). They also had fewer comorbidities, with over a third (94 372 [37.5%]) in the lowest comorbidity category. Although the proportion of patients with a history of dementia in the “other” group was lower than that in the palliative care and home care groups, it was still substantial, at 10.3% (n = 25 997). The “other” group also had the lowest rates of health care use over the previous 2 years, including fewer outpatient physician visits in the previous year and lower proportions with an emergency department visit or hospital discharge in the previous 30 days. Notably, fewer patients in the “other” group were formally enrolled to a primary care physician, and this group also had the highest proportion of patients with no primary care visits in the previous 2 years.
Only 62 722 other home visits (24.9%) were with the patient’s primary care provider, similar to the palliative care group but considerably less than the home care group (37 522 [45.1%]) (Table 1). Patients in the “other” group had fewer home visits with a physician who was known to them from any visit in the previous year than patients in the palliative care and home care groups.
Of the 413 057 patients, 82 375 (19.9%) had a long-stay home care assessment completed in the previous 6 months (Table 2). The values for the palliative care group, home care group and “other” group were 20 518 (26.1%), 51 210 (61.6%) and 10 647 (4.2%), respectively. Among these, patients in the “other” group were least likely to have a caregiver in the home, use an assistive device, depend on others for locomotion or be homebound.
Characteristics of baseline assessment of long-stay home care
The most common diagnoses in the palliative care group were lung cancer (10 719 [13.7%]), other malignant neoplasm (5508 [7.0%]) and dementia (3497 [4.4%]); 7 of the 10 most frequent diagnoses were cancer-related (Appendix 1, Table S5). The most common diagnoses in the home care group were dementia (8693 [10.5%]), congestive heart failure (3093 [3.7%]) and hypertension (2921 [3.5%]) (Appendix 1, Table S6), and in the “other” group, acute nasopharyngitis (36 397 [14.5%]), acute bronchitis (11 825 [4.7%]) and mental health conditions (10 929 [4.3%]) (Appendix 1, Table S7).
The majority of patients (150 694 [59.9%]) in the “other” group had no repeat physician home visits. They had lower rates of 30-day emergency department visits (33 424 [13.3%]) and hospital admissions (11 496 [4.6%]) than patients in the palliative care and home care groups (Table 3).
Postvisit use of health care services
Subgroup analysis
Rural patients
Of the 413 057 patients who received a first physician home visit, 23 704 (5.7%) resided in a rural setting. They represented 7.7% (n = 6011) of the palliative care group, 7.5% (n = 6202) of the home care group and 4.6% (n = 11 491) of the “other” group. Differences between the palliative care, home care and “other” groups were similar in direction to those observed in the larger cohort, but the magnitude of the difference was attenuated (Table 4). For example, although patients in the “other” group were younger than those in the palliative care and home care groups, the difference was less than in the broader cohort. A similar pattern was observed for postvisit use of health care services. One notable difference was that 7142 visits (62.2%) in the “other” group were with the patient’s enrolled primary care physician or another physician in the same group, compared to 69 163 visits (27.5%) in the “other” group for the overall cohort.
Characteristics and postvisit use of health care services of patients residing in a rural setting
Pediatric patients
The 53 997 patients aged less than 18 years represented 1.1% (n = 843) of the palliative group, 0.4% (n = 326) of the home care group and 21.0% (n = 52 828) of the “other” group. Nearly all pediatric home visits (52 828 [97.8%]) were classified as other (Table 5). Nearly all patients (50 035 [94.7%]) in the “other” group lived in large urban areas. Similar to findings in the larger cohort, patients in the “other” group had lower rates of pre- and postvisit use of health care services than those in the palliative care and home care groups. Patients in the “other” group were least likely to have a home visit with a physician who was their enrolling primary care physician or any physician known to them from another visit in the previous year. The most common diagnoses for patients in the “other” group were similar to those for the “other” group in the overall cohort: acute nasopharyngitis (17 331 [32.8%]), other viral diseases (3186 [6.0%]) and serous otitis media (2745 [5.2%]) (Appendix 1, Table S8).
Characteristics and postvisit use of health care services of patients less than age 18 years
Interpretation
After a plateau from 2007/08 to 2012/13, the annual rate of physician home visits in Ontario increased to 307 per 10 000 people in 2018/19. Overall, 61% of patients who received their first physician home visit received neither palliative care nor home care. This “other” group was younger and urban, and had fewer comorbidities and lower rates of prior health care use than those receiving palliative home visits or home care. This group also had the least repeat physician home visits, subsequent emergency department visits and hospital admissions. These findings suggest that patients who receive physician home visits for neither palliative care nor home care are an overall younger, healthier population that may access physician home visits for reasons other than a physical inability to leave home.
Patients in the “other” group had the lowest rate of previous encounters with the home visiting physician. As has been described for walk-in clinic encounters,46 we found the most common diagnoses in the “other” group were acute viral illnesses. Rural patients had lower volumes of “other” visits, and the “other” visits they did have were more often with their own physician. On-demand physician home visits, marketed in urban areas, come at the cost of relational and informational discontinuity with the usual primary care provider. Whether because of a lack of attachment to a primary care provider, insufficient after-hours access to their usual provider or a desire for convenience, this trade-off may be acceptable to patients.47
A greater proportion of the “other” group than the palliative care and home care groups were immigrants, which may reflect the urban setting where on-demand home visit services are offered. Alternatively, it may suggest that broad availability of physician home visits contributes to equity of access for those with inflexible work hours or caregiving responsibilities. Notably, many patients in the “other” group lacked a usual provider of primary care. Physician home visit companies offer low-barrier medical care to those who otherwise might present to an emergency department. Beyond access, it is not known how such visits contribute to other dimensions of quality health care, such as efficiency and effectiveness.48
Since 2005, when palliative special visit premiums were introduced in Ontario,20 the volume of palliative home visits has increased steadily. This is good news, as many patients receiving palliative care have a high symptom burden, limited mobility outside the home and high health care needs.49,50 The annual volume of physician home visits also had a notable inflection point in 2012/13, when volume bonuses for primary care home visits were increased substantially.21 After 2012/13, we observed a steady rise in the annual volume of home care visits and other visits. Still, this may not be enough to meet the needs of the growing homebound population.3 European countries have much higher rates of home visit provision than North America: more than 60% of primary care physicians surveyed in the United Kingdom, the Netherlands and Switzerland reported providing home visits commonly, compared to 19% in Canada and 6% in the US.51 The volume of physician home visits in the US has risen substantially over the past 20 years, as a result of increased fee-for-service payments through Medicare, special funding through demonstration projects and health care reform prioritizing high-value care.17 Notably, hospitals and accountable care organizations have found home visits to be cost-saving owing to avoided readmissions, and fewer hospital and nursing home bed-days.9,12,17
Until 2019, Ontario’s particular incentive structure did little to ensure that patients who received physician home visits were those who would otherwise have had high health care use. In 2019, the physician fee schedule was changed to limit home visit premiums to “frail elderly or housebound” patients.52 This should reduce the number of “other” home visits; however, the interpretation of any subsequent changes in visit volumes will be confounded by the onset of the COVID-19 pandemic: in spring 2020, the number of physician home visits had declined by 60% compared to the previous year.26 Since the onset of COVID-19, direct-to-consumer telemedicine, as well as virtual visits with one’s usual provider, may have partly replaced physician home visits. It will be essential to examine how and whether physician home visits rebound, to evaluate the effect of the 2019 fee schedule change and to ensure that the needs of Ontario’s growing homebound population3 are met. Additional policy changes to target home visits to needy populations could include linking home visit remuneration to palliative care training or home care rosters, while ensuring access for those who rely on unpaid or private home care supports.
Limitations
We could not capture home visits provided by salaried nurse practitioners, who often work in team-based primary care models. As a result, our results underestimate the total number of home visits by all primary care providers in Ontario. We used receipt of home care as a proxy for functional dependency or homebound status. However, we could not identify receipt of private home care or support by unpaid caregivers. We reported only costs for home visit billing codes, not total health care system costs. Home visits may reduce other health care use, including emergency department visits. We did not measure changes over time in the distribution of home visit diagnoses, nor did we attempt to determine whether palliative care codes were being overused. The home visits codes used in our study have not been validated against chart review. Fraudulent claims (i.e., for home visits that never occurred) are expected to be very rare. Finally, although our findings are from Ontario, they are likely generalizable to settings with similar physician payment structures, that is, physician remuneration through fee-for-service and capitation-based models.
Conclusion
We found that physician home visits increased by 37% from 2005/06 to 2018/19 in Ontario. Most of this growth was explained by a more than sevenfold increase in palliative home visits. Yet, 51% of all physician home visits were to patients who were receiving neither palliative care nor home care. This group was younger and healthier, and had lower levels of use of health care services than their comparators. Such home visits may facilitate access at the expense of continuity of care. Our findings will inform payment models and regulatory frameworks to support the provision of physician home visits to those who are most likely to benefit. Further research is needed on the efficiency and effectiveness of low-complexity and low-continuity home visits, and to monitor the recovery of necessary physician home visits in the wake of the COVID-19 pandemic.
Acknowledgment
The authors thank Dr. Christine Salahub for assistance with revisions, as well as table and figure preparation.
Footnotes
Competing interests: Nathan Stall is an associate editor of CMAJ. He was not involved in the editorial decision-making process for this article. No other competing interests were declared.
This article has been peer reviewed.
Contributors: Lauren Lapointe-Shaw and Yingbo Na acquired and analyzed the data. Lauren Lapointe-Shaw, Aaron Jones, Tara Kiran and Katherine Nelson interpreted the data. Lauren Lapointe-Shaw drafted the manuscript. All of the authors contributed to the conception and design of the study, revised the manuscript critically for important intellectual content, approved the final version to be published and agreed to be accountable for all aspects of the work.
Funding: This study was supported by the Toronto General Hospital Research Institute and by ICES, which is funded by an annual grant from the Ontario Ministry of Health. Lauren Lapointe-Shaw is supported by the University of Toronto Department of Medicine, the Toronto General Hospital Research Institute, the Women’s College Hospital Institute for Health System Solutions and Virtual Care, and the Peter Gilgan Centre for Women’s Cancers, Women’s College Hospital, in partnership with the Canadian Cancer Society. Tara Kiran is the Fidani Chair in Improvement and Innovation, University of Toronto. She is supported as a Clinician Scientist by the Department of Family and Community Medicine, St. Michael’s Hospital and the University of Toronto. Noah Ivers is supported by a Canada Research Chair in Implementation of Evidence-based Practice and a Clinician Scholar award from the Department of Family and Community Medicine, Women’s College Hospital and University of Toronto. Nathan Stall is supported by the Eliot Phillipson Clinician-Scientist Training Program, Department of Medicine, University of Toronto, the Clinician Investigator Program, University of Toronto, and a Vanier Canada Graduate Scholarship.
Data sharing: The data set from this study is held securely in coded form at ICES. Although legal data-sharing agreements between ICES and data providers (e.g., health care organizations and government) prohibit ICES from making the data set publicly available, access may be granted to those who meet prespecified criteria for confidential access, available at https://www.ices.on.ca/DAS (email: das{at}ices.on.ca). The full data set creation plan and underlying analytic code are available from the authors on request, with the understanding that the computer programs may rely on coding templates or macros that are unique to ICES and are therefore either inaccessible or may require modification.
Disclaimer: This study was based on data compiled by ICES. However, the analyses, conclusions, opinions and statements expressed herein are those of the authors and not necessarily those of ICES. Parts of this material are based on data and information compiled and provided by the Ontario Ministry of Health, the Ontario Association of Community Care Access Centres, Immigration, Refugees and Citizenship Canada, and the Canadian Institute for Health Information. The analyses, conclusions, opinions and statements expressed herein are solely those of the authors and do not reflect those of the funding or data sources; no endorsement is intended or should be inferred.
Supplemental information: For reviewer comments and the original submission of this manuscript, please see www.cmajopen.ca/content10/3/E732/suppl/DC1.
This is an Open Access article distributed in accordance with the terms of the Creative Commons Attribution (CC BY-NC-ND 4.0) licence, which permits use, distribution and reproduction in any medium, provided that the original publication is properly cited, the use is noncommercial (i.e., research or educational use), and no modifications or adaptations are made. See: https://creativecommons.org/licenses/by-nc-nd/4.0/
References
- © 2022 CMA Impact Inc. or its licensors
In this issue

Article tools


