


Abstract
Background: Few studies have categorized high-cost patients (defined by accumulated health care spending above a predetermined percentile) into distinctive groups for which potentially actionable interventions may improve outcomes and reduce costs. We sought to identify homogeneous groups within the persistently high-cost population to develop a taxonomy of subgroups that may be targetable with specific interventions.
Methods: We conducted a retrospective analysis in which we identified adults (≥ 18 yr) who lived in Alberta between April 2014 and March 2019. We defined “persistently high-cost users” as those in the top 1% of health care spending across 4 data sources (the Discharge Abstract Database for inpatient encounters; Practitioner Claims for outpatient primary care and specialist encounters; the Ambulatory Care Classification System for emergency department encounters; and the Pharmaceutical Information Network for medication use) in at least 2 consecutive fiscal years. We used latent class analysis and expert clinical opinion in tandem to separate the persistently high-cost population into subgroups that may be targeted by specific interventions based on their distinctive clinical profiles and the drivers of their health system use and costs.
Results: Of the 3 919 388 adults who lived in Alberta for at least 2 consecutive fiscal years during the study period, 21 115 (0.5%) were persistently high-cost users. We identified 9 subgroups in this population: people with cardiovascular disease (n = 4537; 21.5%); people receiving rehabilitation after surgery or recovering from complications of surgery (n = 3380; 16.0%); people with severe mental health conditions (n = 3060; 14.5%); people with advanced chronic kidney disease (n = 2689; 12.7%); people receiving biologic therapies for autoimmune conditions (n = 2538; 12.0%); people with dementia and awaiting community placement (n = 2520; 11.9%); people with chronic obstructive pulmonary disease or other respiratory conditions (n = 984; 4.7%); people receiving treatment for cancer (n = 832; 3.9%); and people with unstable housing situations or substance use disorders (n = 575; 2.7%).
Interpretation: Using latent class analysis supplemented with expert clinical review, we identified 9 policy-relevant subgroups among persistently high-cost health care users. This taxonomy may be used to inform policy, including identifying interventions that are most likely to improve care and reduce cost for each subgroup.
A small proportion of patients account for a disproportionate amount of health care spending in developed countries with advanced health care systems. Specifically, patients in the top 1% of health care spending in North America account for 25% to 40% of total health care expenditures in a given year.1,2 Increasing age, receipt of end-of-life care, multimorbidity, mental health conditions and social disadvantage are each associated with high-cost health system use.2 However, the heterogeneous nature of this patient population makes it difficult to develop and implement strategies to improve care and curb health care spending for all high-needs, high-cost patients.3,4 Further complicating this goal, two-thirds of the high-cost population in a given fiscal year are not high-cost in the following year, making it difficult to identify the appropriate target population for intervention.1
There is growing interest in stratifying high-cost populations into subgroups to facilitate targeted interventions.5–9 A recent Canadian study of high-cost patients described the clinical and demographic profiles of the top 10% of individuals by cumulative cost accrued during a 2-year window.10 They identified 7 high-cost subgroups: “long-term care,” “palliative care,” “major acute illness,” “major chronic diseases,” “major cancer,” “major newborn” and “mental health.” These subgroups were mutually exclusive segments of the high-cost population but were clinically heterogeneous and did not support the design of strategies to improve care and reduce costs.
A recent study of a US Kaiser Permanente cohort in northern California used latent class analysis to identify 7 sub-groups of medically complex patients.11 However, the authors developed their classification scheme in a subset of patients with high comorbidity and high likelihood of acute care use, rather than in the general population.
The studies of high-cost users in Canada10 and of medically complex patients in northern California11 both defined their populations for a single time period (i.e., episodic health care use) rather than for those who were continually high-cost users in multiple subsequent years, and who arguably had the greatest potential for targeted interventions and cost savings.12
Much of the previous work in this area lacks granularity and neglects the high turnover in the high-cost population over time. Statistical techniques such as latent class analysis, applied over several consecutive years at a population level, may allow for more precise characterization of subgroups in the heterogenous population of those with persistently high health care costs. Such an approach would facilitate the design of strategies to meet the distinctive needs of each subgroup.
To this end, we sought to identify homogeneous groups of persistently high-cost patients from longitudinal, multiyear, population-based data in Alberta, Canada, using latent class analysis and expert clinical opinion to develop a taxonomy of subgroups that may be targetable with specific interventions.
Methods
Study design and setting
We used a retrospective cohort design with population-level data from Alberta. Individuals were eligible for inclusion in the cohort based on registration in the Alberta Health Care Insurance Plan (AHCIP) for at least 2 consecutive fiscal years in the study window. The AHCIP is a publicly funded health care plan that provides coverage for medically necessary physician services, along with some dental and oral surgical services; about 99% of the Alberta population is eligible based on permanent residence in Alberta.13 We linked this population to administrative health care data in the province.14
We followed the guidelines of the Reporting of Studies Conducted Using Observational Routinely-collected Data (RECORD) statement.15
Study population
We identified adults (≥ 18 yr) who lived in Alberta between April 2014 and March 2019. We then calculated each individual’s cumulative cost for all health care encounters in each fiscal year (April to March). To create a focused population of only the most consistently expensive patients, we defined those in the top 1% of cumulative spending as “high-cost.” An individual was defined as “persistently high-cost” if their annual cumulative spending was in the top 1% of costs for at least 2 consecutive fiscal years1 between 2014 and 2019.
Data sources
We used the previously described Alberta Kidney Disease Network administrative health data repository14 to define 4 types of health system encounters: inpatient encounters from the Discharge Abstract Database; emergency department and hospital-based ambulatory encounters from the Ambulatory Care Classification System; outpatient primary care and specialist encounters from Practitioner Claims; and medication dispensation records from the Pharmaceutical Information Network.14 Hospital and emergency department information was based on the International Statistical Classification of Diseases and Health Related Problems, Tenth Revision (ICD-10), and outpatient physician visits were based on ICD-9-CM coding. The accuracy and completeness of the data sources has been validated in Alberta.16 We obtained demographic information from the Alberta Health Registry, linked to neighbourhood-level 2016 Canadian census data.17
Variable definitions and classifying characteristics
We estimated encounter costs for the 4 types of health system encounters (defined above) and used these to identify persistently high-cost patients. For hospital and emergency department encounters, and for hospital-based ambulatory care encounters, we multiplied the resource intensity weight of the encounter (an estimate of the relative cost associated with elements of a given encounter, including demographic characteristics, diagnoses and procedures18) by the mean provincial cost of a typical encounter. Physician visits were costed using the Alberta Health Schedule of Medical Benefits, which determines the reimbursement rate for physicians for each encounter, including interpretation fees. Medication costs were estimated by multiplying the quantity of medication dispensed by the provincial formulary’s list price for that medication (including relevant dispensing fees and commercial markups). We estimated all costs using information for the fiscal year in which they took place.
We used Andersen’s Behavioral Model of Health Care Utilization to identify a set of relevant variables to inform our classification scheme.19 These included characteristics that predisposed an individual to health system contact (age, sex, urban or rural status, history of homelessness); enabling characteristics that influenced the likelihood of (further) health care utilization (primary care provider attachment, previous specialist visits, long-term care residence); and characteristics related to health care need (e.g., pre-existing chronic conditions).19
Demographic characteristics that predisposed individuals to health system contact were available from the Alberta Health Registry and the Canadian census, except for history of homelessness, which we defined based on the presence of the ICD-10 code Z59.0 in hospital or emergency department records in the previous year, or 45 days subsequent to the index date.20
Enabling characteristics that influenced the likelihood of (further) health care utilization were as follows. We defined primary care provider attachment as the proportion of all primary care visits made to the most commonly visited provider in a 2-year period, categorized as less than 50%, 50% to 74%, and 75% or more of all visits.21 We defined previous specialist visits based on at least 2 visits to providers of the same type within the previous year (defined for 30 classified specialist types and accounting for 98% of all encounters that were not primary care). We defined a history of long-term care residence as a discharge disposition from hospital to a continuing care facility; a “delivery centre” type of “long-term care” for an outpatient physician visit record; or residence in a postal code assigned to a continuing care facility.
For characteristics related to health care need, we ascertained the presence of 13 chronic comorbidities using validated algorithms in the administrative health data and ICD-9 or ICD-10 coding. We included alcohol misuse, depression, schizophrenia, chronic obstructive pulmonary disease, dementia, diabetes, coronary artery disease, heart failure, hypertension, chronic kidney disease, autoimmune conditions, stroke and cancers.22 The data sources for all variables are included in Appendix 1, Table S1, available at www.cmajopen.ca/content/10/2/E390/suppl/DC1.
Data analysis
Latent class analysis
Among persistently high-cost individuals, we used latent class analysis to identify and group patients who shared similar characteristics. The value of latent class analysis lies in its ability to classify individuals in a heterogeneous population into (latent) subgroups where no further context beyond the content of the data are available.23 In statistical terms, latent class analysis is a maximum likelihood method in which observed variables are used to categorize individuals from a heterogeneous sample into otherwise unobserved homogeneous “classes” through patterns of conditional probabilities for each individual.23 A latent class model estimates the proportion of the overall cohort that fits best in each class and the probability of each classifying characteristic in a particular latent class.
Using the classifying characteristics described above, we began by specifying a model with 2 classes (representing subgroups) and added classes iteratively until the Bayesian information criterion was minimized, indicating the appropriate number of classes to maximize model fit and minimize the potential for overfitting.24 Subgroups were mutually exclusive, in that each individual in the cohort was assigned to a single subgroup that best represented their characteristics.
To aid in the identification of important characteristics for each subgroup, we tabulated the prevalence of classifying characteristics, including demographics, measures of system use, relational continuity of care and specialty involvement, and comorbidities; we also calculated the ratio of the prevalence of the characteristic in the subgroup compared to its overall prevalence across all subgroups. We presented the differences across subgroups for select characteristics graphically by plotting the standardized differences between each subgroup and the overall cohort. We determined the proportion of cost attributable to each type of encounter (inpatient, emergency department, outpatient, medication), as well as the most costly and most frequent diagnoses and medications within each subgroup. All analyses were conducted using Stata 16 (StataCorp).
Expert opinion
Used in isolation, latent class analysis is open to issues of reification, where the set of identified subgroups may be erroneously interpreted to form a complete and literal representation of all types (i.e., classes) of individuals in a population.25 Such interpretation is at odds with clinical context, because patients with disparate classifying characteristics may require similar clinical care. Combining the results from latent class analysis of administrative data with clinical judgment ensures that the identified subgroups are clinically relevant and potentially actionable. It also ensures that experts start with an objective view of the population that is unbiased by clinical gestalt and pre-existing notions. To this end, we developed a method of combining the previously described latent class analysis with expert opinion.
We assembled a panel of 6 content experts with expertise in epidemiology (B.H., P.R.), health economics (B.M.), health policy (B.M., R.B.) and health services research (B.H., D.C., B.M., M.T., P.R.); 4 of the panel members were also specialists in internal medicine (endocrinology [D.C.], general internal medicine [F.M.] and nephrology [B.H., B.M., M.T.]). Panel members were invited to participate based on their clinical and research expertise, and they were part of a larger interdisciplinary research network, the Interdisciplinary Chronic Disease Collaboration.
The panel reviewed the compiled analyses to determine key similarities and differences between subgroups, whether each subgroup represented a clinically meaningful population, and whether multiple subgroups identified in the latent class analysis could be combined based on similar characteristics, clinical need and potential care pathways. We repeated this process until we achieved consensus, at which point we described the demographic and clinical characteristics, details of health system use and costs for each of the finalized subgroups, using proportions or means with standard deviations.
Ethics approval
The University of Calgary Conjoint Health Research Ethics Board approved this study.
Results
For each fiscal year from April 2014 to March 2019, we identified 3.4 to 3.7 million adults (≥ 18 yr) who lived in Alberta. We identified 136 554 (3.5%) adults who were high-cost in at least 1 fiscal year, and 21 115 (0.5%) who were persistently high-cost, based on high-cost status in at least 2 consecutive fiscal years (99th percentile of cost in a given year 2014/15: $46 399; 2015/16: $47 367; 2016/17: $48 145; 2017/18: $48 908; 2018/19: $49 783; Figure 1; Appendix 1).

Identification of persistently high-cost individuals across at least 2 consecutive fiscal years. Persistently high-cost users were those in the top 1% of health care spending in at least 2 consecutive fiscal years. Episodic high-cost users were those who were in the top 1% of health care spending for 1 year only, or for nonconsecutive years.
Derivation of persistently high-cost subgroups
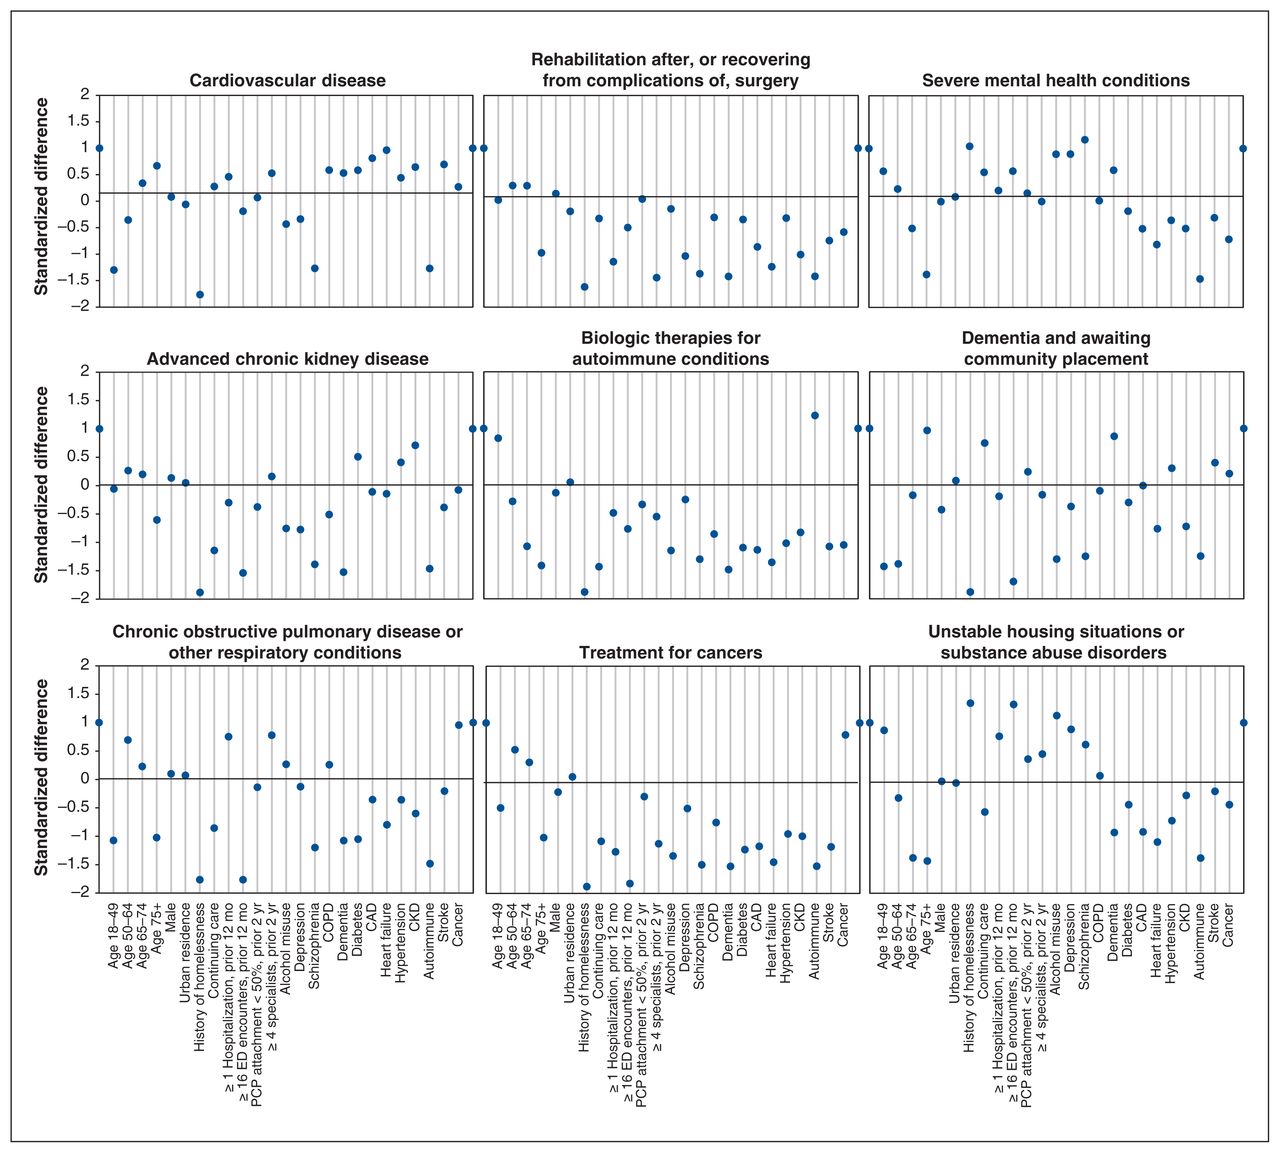
Using latent class analysis, we identified 21 potential subgroups of persistently high-cost individuals based on 20 classifying variables (Appendix 1, Tables S2 and S3). Consultation with clinical experts led us to decrease the number of clinically meaningful persistent high-cost subgroups from 21 to 9, based on similarities in patient characteristics and clinical needs (Figure 2).

Standardized difference of classifying characteristics for each group relative to the overall population. Note: CAD = coronary artery disease, CKD = chronic kidney disease, COPD = chronic obstructive pulmonary disease, ED = emergency department, PCP = primary care provider.
The taxonomy of 9 subgroups was as follows: patients with cardiovascular disease (e.g., coronary artery disease or heart failure; 21.5%, n = 4537); patients receiving rehabilitation after surgery or recovering from complications of surgery (16.0%, n = 3380); patients with severe mental health conditions (e.g., schizophrenia or other psychosis; 14.5%, n = 3060); patients with advanced chronic kidney disease (12.7%, n = 2689); patients receiving biologic therapies for autoimmune conditions (e.g., inflammatory bowel disease, rheumatoid arthritis or multiple sclerosis; 12.0%, n = 2538); patients with dementia and awaiting community placement (11.9%, n = 2520); patients with chronic obstructive pulmonary disease or other respiratory conditions (4.7%, n = 984); patients receiving treatment for cancers (3.9%, n = 832); and patients with unstable housing situations, substance use disorders or both (2.7%, n = 575).
Sources of health care costs
The persistent high-cost population (n = 21 115) was responsible for $2.8 billion (adjusted to 2018 dollars) in health care spending annually, and subgroup costs ranged from $112 000 per person per year for patients receiving biologic therapies for autoimmune conditions to $179 000 per person per year for patients with severe mental health conditions (Table 1).
Characteristics of persistently high-cost subgroups
Across all subgroups hospitalizations accounted for 48.3% of costs, medication use for 26.5%, emergency department encounters for 15.0% and outpatient physician encounters for 10.2%. However, each subgroup had a distinctive distribution of health care spending. For example, among patients with dementia and awaiting community placement, 69.1% of health care spending was attributable to hospital encounters; among patients with advanced chronic kidney disease, 33.7% of costs were attributable to emergency department encounters; and among patients with severe mental health conditions, 40.3% of costs were related to prescription medications (Figure 3).
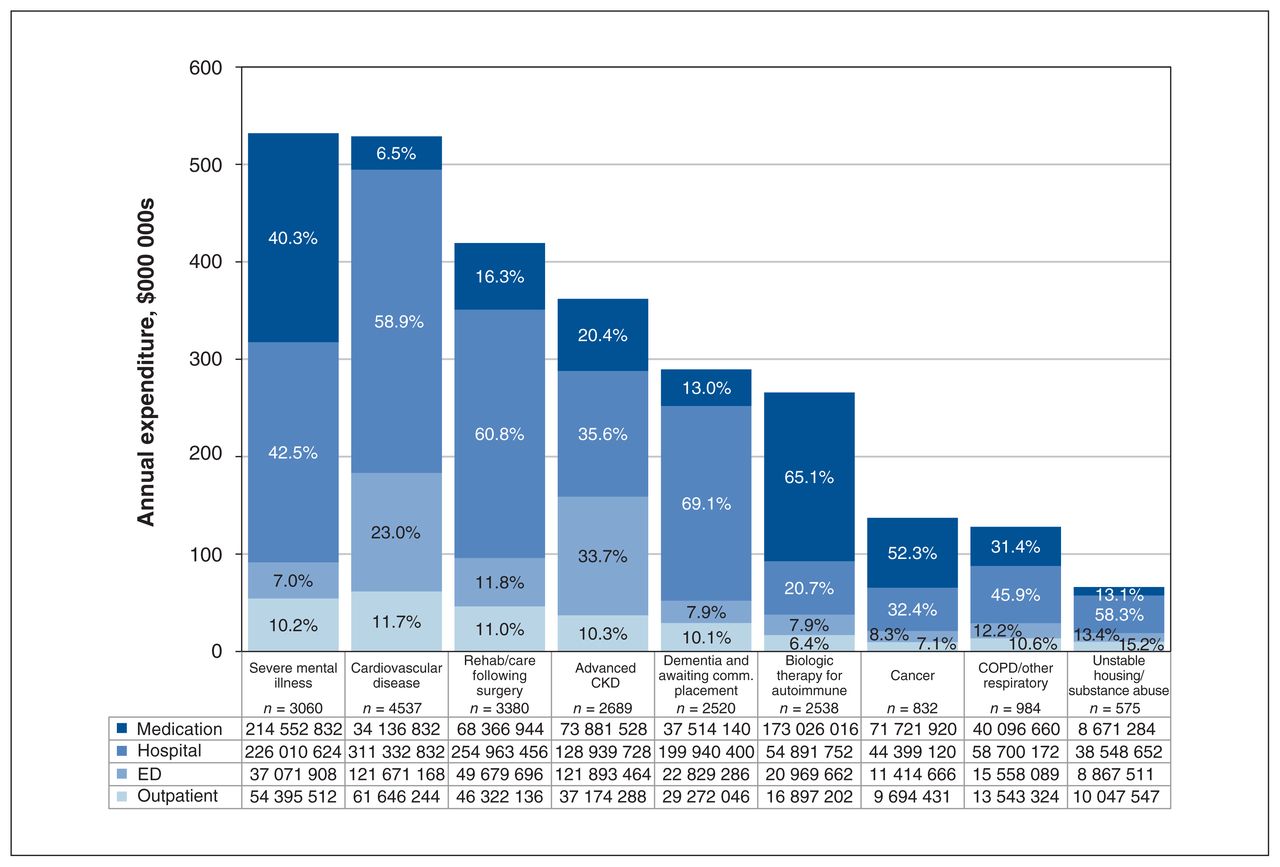
Breakdown of health care spending for each high-cost subgroup, by encounter type. Note: CKD = chronic kidney disease, comm. = community, COPD = chronic obstructive pulmonary disease, ED = emergency department.
Characteristics of persistently high-cost subgroups
Age varied across the 9 subgroups, from a mean age of 41.8 years (patients receiving biologic therapies for autoimmune conditions) to 81.1 years (patients with dementia and awaiting community placement), for an overall mean ± standard deviation of 60.2 ± 18.4 years. Sex distribution also varied, from 34.6% male (patients with dementia and awaiting community placement; n = 871) to 62.1% male (patients receiving rehabilitation after surgery or recovering from complications of surgery; n = 2098), for an overall proportion of 53.9% male (n = 11 371) for the entire cohort.
Measures of health system contact varied across subgroups; overall, 42.3% (n = 8933) of high-cost patients had no emergency department visits in the previous year (proportions varied from 0.0% to 76.7%). Approximately one-third of persistently high-cost patients had 1 or more hospitalizations in the previous 12 months (36.9%, n = 7570; range 4.0% to 85.7%). About two-thirds (66.5%, n = 14 037) had poor relational continuity of care with a primary care provider (i.e., < 50% of all primary care visits with the most commonly seen provider; 45.3% in the most attached group and 96.3% in the least attached group). Almost one-fifth had not received care from a medical specialist (19.4%, n = 4089; range 0.0% to 72.5%; Table 1).
We tabulated the most prevalent and costly diagnoses for hospital, emergency department, and physician encounters, as well as prescribed medications for each subgroup (Appendix 1, Table S4).
Interpretation
We defined a population of persistently high-cost patients in Alberta based on high health care spending over consecutive years. Using latent class analysis supplemented by expert opinion, we defined a taxonomy of 9 clinically relevant subgroups based on demographic and clinical characteristics, relational continuity of care, and measures of system use. We examined how health care spending was distributed in each subgroup. This classification is a first step toward developing targeted interventions in the persistently high-cost population.
Previous literature exploring the persistently high-cost population has focused on specific subgroups (e.g., severe mental health26) rather than on creating clear classifications of the broader population. Efforts have been made to classify nonpersistent (i.e., episodic) high-cost populations; however, because most high-cost users in any given year are not high-cost users in subsequent years, interventions targeting these groups are less feasible. For example, Anderson and colleagues10 used the population grouping methodology from the Canadian Institute for Health Information to define subgroups of the high-cost population in Saskatchewan, Canada. They defined 16 mutually exclusive health profiles and considered 8 to be the most costly: “long-term care,” “palliative,” “major acute,” “major chronic,” “major cancer,” “major newborn,” “major mental health” and “moderate chronic,” based on measures of health system use, comorbidity and socioeconomic status. Cancer and mental health were key characteristics in 2 subgroups of their population, and long-term care was a key determinant of another; each were important factors in our study as well. However, the final stratification of the high-cost population in that study lacked specificity. For example, although an individual’s high-cost status may result from 1 or more chronic conditions, the strategies needed to improve care or reduce cost might differ substantially depending on specific condition(s); more information would be needed to define targeted interventions.
Latent class analysis allows for the development of a more precise taxonomy. In a population of medically complex adult patients, Grant and colleagues11 used latent class analysis in 1 year of data for the Kaiser Permanente Northern California population. They identified 7 classes of complex patient profiles: “less engaged,” “older patients with cardiovascular complications,” “frail elderly,” “pain management,” “psychiatric illness,” “high acuity” and “cancer treatment.” Three of these groups also appeared in our analysis: patients with cardiovascular disease, patients with severe mental health conditions and patients receiving treatment for cancers. However, rather than defining the high-cost population based on a single year, in the present study, we applied latent class methodology to a persistently high-cost population. This approach allowed us to develop a taxonomy that permitted a more precise approach to improving care for persistently high-cost patients by offering avenues for prioritization to match the right intervention to the right population at the right time.
Many interventions can be matched to each subgroup to improve patient outcomes and reduce health care costs (examples of proposed interventions for each subgroup are outlined in Appendix 2, available at www.cmajopen.ca/content/10/2/E390/suppl/DC1). These interventions relate broadly to pharmaceutical policy, decreased reliance on inpatient services and improved care in the community. For example, patients receiving biologic therapies for autoimmune conditions could benefit from a policy intervention that promotes the use of biosimilars over their more costly brand-name counterparts. Among patients with inflammatory bowel disease, the brandname form of infliximab costs twice as much as the equivalent biosimilar, and the switch from brand-name to generic pharmaceuticals is generally well tolerated by patients.27,28
Because inpatient encounters tend to be more costly than community-based alternatives, interventions that decrease reliance on hospital services may be promising in all subgroups where viable (acknowledging that not every inpatient encounter is avoidable). Matching patients with cardiovascular disease to outpatient-based cardiac function clinics, and intensive case management programs such as hospital-at-home services may serve to improve patient outcomes and quality of life, as may improving outpatient support for self-management for individuals living with the condition.29–31
For patients with advanced chronic kidney disease, a discussion of all available treatment options, including conservative care and kidney transplantation where appropriate, may reduce health care costs. Among those for whom in-centre hemodialysis is the only option, satellite hemodialysis units may reduce costs as a result of lower staffing levels.32,33 Such interventions, while discussed as promising in the literature, would naturally require feasibility assessment in local contexts, including consideration of barriers and facilitators to implementation.
Limitations
Our results should be interpreted in the light of the following limitations. We created a clinical classification using a population-based cohort and multiple cost sources, but other data sources — including long-term care costs and important measures of the social determinants of health (e.g., education level, food insecurity) — were not captured. Further, our definition of homelessness captured only those who received hospital-based care and may have missed a subset of this population with different health care needs and utilization patterns.
Although each individual was assigned to the group that fit them best in latent class analysis, they may have been eligible for another group. For example, a patient in the group whose health system use was driven by advanced chronic kidney disease might also have had encounters related to mental health conditions, and vice versa. Still, identifying the key characteristics of each subgroup highlighted areas for potential cost containment.
Finally, the decision to use a combination of latent class models and clinical expertise to develop our taxonomy may have introduced some subjectivity into the process. Another clinical panel may have interpreted the latent class information differently given their areas of expertise and clinical understanding of each high-cost subgroup. Further, from a statistical standpoint, this method did not provide a statistically representative Bayesian information criterion value that could be used to assess model fit. However, we believe that the face validity and clinical relevance of this final taxonomy minimizes these concerns and provides a pragmatic approach to the creation of high-cost patient subgroups that can be matched to potential interventions.
Conclusion
In this population-based study, we identified a taxonomy of 9 subgroups of persistently high-cost patients defined by differences in demographic and clinical characteristics, continuity and management of care, and measures of system use. Recognizing that no single intervention will reduce the health care needs of all persistent high-cost users, these subgroups can be used to match patients to a variety of subgroup-specific interventions that have been evaluated in the medical literature. Applying this methodology to high-cost populations has the potential to provide needed precision to care for this diverse group that drives health care spending.
Footnotes
Competing interests: None declared.
This article has been peer reviewed.
Contributors: James Wick, David Campbell, Finlay McAlister, Braden Manns, Marcello Tonelli, Reed Beall, Brenda Hemmelgarn, Andrew Stewart and Paul Ronksley designed the study. Braden Manns, Marcello Tonelli, Brenda Hemmelgarn and Paul Ronksley acquired the data, which James Wick analyzed. James Wick and Paul Ronksley wrote the article, which David Campbell, Finlay McAlister, Braden Manns, Marcello Tonelli, Reed Beall, Brenda Hemmelgarn and Andrew Stewart reviewed. All of the authors revised the article critically for important intellectual content, gave final approval of the version to be published and agreed to be accountable for all aspects of the work.
Funding: David Campbell is supported by a Clinician Fellowship from Alberta Innovates. Finlay McAlister is funded by an Alberta Health Services Chair in Cardiovascular Outcomes Research. Braden Manns is supported by the Svare Chair in Health Economics. Marcello Tonelli is supported by the David Freeze Chair in Health Services Research. The funding sources had no role in study design, data collection, analysis, reporting, or the decision to submit for publication.
Disclaimer: The interpretation and conclusions contained herein are those of the researchers and do not necessarily represent the views of the Government of Alberta or Alberta Health Services. Neither the Government of Alberta, Alberta Health or Alberta Health Services express any opinion in relation to this study.
Data sharing: This study is based in part on data provided by Alberta Health and Alberta Health Services. We are not able to make our data set available to other researchers due to our contractual arrangements with the provincial health ministry (Alberta Health), who is the data custodian.
Supplemental information: For reviewer comments and the original submission of this manuscript, please see www.cmajopen.ca/content/10/2/E390/suppl/DC1.
This is an Open Access article distributed in accordance with the terms of the Creative Commons Attribution (CC BY-NC-ND 4.0) licence, which permits use, distribution and reproduction in any medium, provided that the original publication is properly cited, the use is noncommercial (i.e., research or educational use), and no modifications or adaptations are made. See: https://creativecommons.org/licenses/by-nc-nd/4.0/
References
- © 2022 CMA Impact Inc. or its licensors
In this issue

Article tools


Related Articles
Cited By...
- No citing articles found.