


Abstract
Background: Amid rising concern about opioid use across Canada, Métis leaders in Manitoba are seeking information on prescription opioid dispensing in Red River Métis populations to assist with planning and implementing appropriate evidence-based harm-reduction strategies in their communities. We examined patterns of prescription opioid dispensing among Red River Métis and compared them to those among other residents of Manitoba.
Methods: We conducted a population-based retrospective cross-sectional study for fiscal years 2006/07–2018/19 using administrative data from the Manitoba Population Research Data Repository and a study designed in partnership with researchers from the Manitoba Métis Federation. We compared age- and sex-adjusted rates of prescription opioid dispensing and mean morphine equivalents (MEQ) between Red River Métis and all other Manitobans aged 10 years or older, in accordance with Indigenous data sovereignty principles. To better understand what was driving any differences in patterns of prescription opioid dispensing between the 2 groups, we stratified the groups by age, sex, urbanicity, number of comorbidities, income quintile and opioid type, and compared patterns in MEQ/person.
Results: The 2018/19 cohort included 76 755 Red River Métis and 1 117 854 other Manitobans. Other Manitobans were more likely than Red River Métis to be in higher income quintiles and to live in urban areas, and were less likely to have been diagnosed with a mood or anxiety disorder or a substance use disorder in the previous 5 years. The rate of prescription opioid dispensing and the opioid-associated MEQ/person were consistently higher among Red River Métis than among other Manitobans in each study year (p < 0.001). The rate of prescription opioid dispensing declined and the MEQ/person rose among other Manitobans over the study period but did not change among Red River Métis.
Interpretation: The rate of prescription opioid dispensing and the potency of prescribed opioids were higher among Red River Métis in Manitoba than among other Manitobans. Further investigation into the different dispensing patterns between the 2 groups and the potential opioid-related harms they may herald is warranted.
The opioid crisis in Canada is well documented.1–3 Recent estimates of harms associated with opioid use show a 55% rise in opioid-related deaths from 2016 to 2018, with a total of 4382 deaths in 2018.4 Hospital admissions due to opioid poisonings increased by 5% from 2016 to 2018, with 17.6 per 100 000 people admitted to hospital in 2018.1,4 The highly addictive nature of opioids and often inappropriate opioid prescribing practices are major contributors to the worsening opioid crisis.5
Certain Canadian populations are at high risk for being negatively affected by prescribed opioids. Indigenous people have been shown to have higher rates of hospital admission due to opioid poisoning than other Canadians.1 However, there is limited information on the impact of the opioid crisis among Métis specifically. The Red River Métis are descendants of First Nations and European settlers who once governed a distinct nation in the northwest part of North America. Canadian colonial laws and policies dispossessed the Red River Métis of their lands and subjected them to many other damaging injustices. Despite these challenges, the Red River Métis remain resilient and resourceful, celebrating a rich cultural and social history,6 and they maintain their rights to self-determination and self-government.
Métis leaders consider the health and well-being of their people to be a top priority. However, the lack of data specific to the Red River Métis on health issues such as prescription opioid use hinders leaders’ ability to understand the details of the medical care their people receive, including what opioids are prescribed and at what dosage. Without this information, Métis health leadership is unable to plan effective public health strategies specific to the Red River Métis context that recognize the unique cultural legacy of the Red River Métis and their negative experiences of colonialism and racism in the health care system.6
To address this gap in knowledge and to support the development of harm-reduction and intervention strategies among Red River Métis, we conducted a study comparing patterns of prescription opioid dispensing between Red River Métis in Manitoba, Canada, and all other Manitobans.
Methods
Study setting and design
We conducted a retrospective longitudinal cross-sectional study of prescription opioid dispensing in Manitoba using administrative data. We compared the rate of opioid dispensing and the dosage of opioid-associated morphine equivalents (MEQ) among Red River Métis in Manitoba and all other Manitobans from fiscal years 2006/07 to 2018/19.
To gain a deeper understanding of what was driving any differences in opioid dispensing patterns between the 2 groups, we examined time trends in MEQ by age group, sex, income quintile, urbanicity, number of comorbidities and opioid type. Opioid-associated MEQ, which are a measure of the cumulative intake of an opioid drug over a 24-hour period, allow for a standardized comparison of different types of opioids with different potency levels. In this study, we used MEQ to compare the potency of different types of opioids. We reported the study results according to the Reporting of Studies Conducted Using Observational Routinely-collected Health Data (RECORD) statement.7
We developed the study design in partnership with Red River Métis researchers from the Manitoba Métis Federation, who emphasized the importance of a distinctions-based approach, one that recognizes and respects the Red River Métis as an Indigenous group distinct from First Nations and Inuit. Our decision to draw comparisons between Red River Métis and other Manitobans only was at our Métis partners’ insistence that it would not be appropriate to compare the outcomes of one Indigenous group to another. This approach aligns with the guiding principles of Indigenous data sovereignty, which assert that Indigenous nations are rights-holders of their own data and the ways in which they are analyzed and presented.8,9
Data sources
The data were derived from the Manitoba Population Research Data Repository at the Manitoba Centre for Health Policy, University of Manitoba.10,11 The repository comprises more than 90 databases that can be linked at the individual and family level across databases, across health sectors and over time. It includes de-identified records for virtually every contact Manitobans make with the health care system, as well as information on prescription drug dispensations from community pharmacies for more than 99% of Manitoba residents, including members of the Red River Métis.
The databases used in the study were the Manitoba Health Insurance Registry (demographic information such as sex and birthdate for Manitoba residents registered for publicly funded health care); the Manitoba Métis Registry (a registry of Red River Métis living in Manitoba); the Hospital Discharge Abstract Database (demographic and clinical information on inpatients, including reason for admission); Medical Services (claims for physician visits in offices, hospitals and outpatient departments, fee-for-service components for tests such as laboratory and radiographic procedures performed in offices and hospitals, and payments for on-call agreements); the Drug Program Information Network (prescriptions dispensed from community pharmacies); and data at the small geographic area level from Canada census years 2006, 2011 and 2016 (to examine socioeconomic status) (Appendix 1, Table S1, available at www.cmajopen.ca/content/10/1/E288/suppl/DC1).12 The repository data have been used extensively in research, and their validity for population health studies has been well documented.13–16
Study cohort
The study cohort included all people who were living in Manitoba at some point between 2006/07 and 2018/19 and who were registered for health insurance. We excluded children younger than age 10 years. With permission from the Manitoba Métis Federation, we identified citizens of the Red River Métis by linking the Manitoba Métis Registry to the Manitoba Population Research Data Repository. Other Manitobans included non-Indigenous residents of Manitoba, as well as Inuit, First Nations and other people who were not listed in the Métis Registry. Further information on the ethnic origins of the population of Manitoba is available from Statistics Canada.17
Measures
Descriptive characteristics
To examine the study cohort’s sociodemographic characteristics, comorbidities and mental health, we used information on age and sex from the Manitoba Health Insurance Registry. We derived urbanicity codes from postal codes available in the Canada census public use data. We created income quintiles using income data for average small geographic areas (i.e., dissemination areas) from the Canada census public use data. We ordered the Manitoba population from lowest to highest income and then categorized the population into 5 groups (quintiles).18
We assessed comorbidities using the Elixhauser Comorbidity Index, which categorizes patient comorbidities based on 31 different sets of International Classification of Diseases diagnosis codes.19,20 The mental health indicators we examined were mood or anxiety disorder, personality disorder, psychotic disorder, substance use disorder and suicide attempt(s). We obtained diagnosis codes for these measures from the Drug Program Information Network, the Medical Services database and the Hospital Discharge Abstracts Database (see Appendix 1, Table S2 for definitions and diagnosis codes).
Outcomes
The 2 primary outcomes were rate of prescription opioid dispensing and mean opioid-associated MEQ/person. We examined these 2 outcomes first among Red River Métis and other Manitobans in 2006/07 and 2018/19, and then for each year in this range using time trend analyses. To better understand what was driving any differences in patterns of prescription opioid dispensing between the 2 groups, we then stratified the groups by age, sex, urbanicity, number of comorbidities, income quintile and opioid type, and compared patterns in MEQ/person.
Definitions
We defined “opioid dispensation” using data from the Drug Program Information Network; we included all drug dispensations with ATC codes N02A and N01AH, and used a 180-day washout period after each newly dispensed prescription. We used MEQ as the conversion factor to calculate the strength of an opioid using morphine dosage. We assigned conversion factors for MEQ product groups21 based on generic product type. We then calculated MEQ conversion factors for individual dosages by multiplying the group conversion factor and individual dosage strength for each product. We calculated total MEQ per prescription by multiplying the quantity of doses dispensed by the dosage conversion factor.
Statistical analysis
We tested for differences between 2006/07 and 2018/19 in dispensing rates and MEQ using generalized models. Models included a Métis identity indicator, a binary year indicator, and an interaction between year and Métis identity to test for differences between the start and end of the study, and for differences between Red River Métis and other Manitobans. We then used longitudinal time trend analyses to determine whether the different patterns in dispensing rates and MEQ were statistically significant over time.
We modelled dispensing rates by a generalized linear model with a log link, negative binomial distribution and the log of population for a given year as an offset. The total number of dispensations during the time period was the dependent variable. For MEQ, we used a general linear model with a normal distribution. Both measures were adjusted for age and sex. We used a time-by-Métis identity interaction to test whether trends differed between Red River Métis and other Manitobans. For MEQ, we tested both linear and nonlinear (quadratic) time trends. We tested the t-statistic of each group’s slope coefficient and its associated p value at p = 0.05 to determine whether the estimated slope was different from 0. We assessed model fit using residual plots. All analyses were done in SAS Version 9.4 (SAS Institute).
Ethics approval
The study was approved by the University of Manitoba Human Research Ethics Board (HS22883 – H2019:218), and the Manitoba Métis Federation cabinet provided a letter of support. The Health Information Privacy Committee of the Manitoba government also reviewed and approved the study (HIPC 2019/20–16).
Results
There were 1 702 996 Manitobans registered for health insurance from 2006/07 to 2018/19. After we excluded children younger than age 10 years (n = 202 056) and nonresidents of Manitoba (n = 227), the final study cohort included 1 500 713 people, 88 699 Red River Métis and 1 412 014 other Manitobans. A summary of the sociodemographic and health characteristics of the cohort for 2006/07 and 2018/19 is presented in Table 1. These characteristics and all 31 categories of the Elixhauser Comorbidity Index for additional years are presented in Appendix 1, Tables S3 to S7. Although many characteristics were similar between the groups, other Manitobans were more likely than Red River Métis to live in urban areas and be in the highest income quintiles. A greater proportion of Red River Métis than of other Manitobans had been diagnosed with a mental health disorder, such as a mood or anxiety disorder, or a substance use disorder, within the previous 5 years.
Sociodemographic, comorbidity and mental health characteristics of Red River Métis and all other Manitobans, 2006/07 and 2018/19
Table 2 presents an overview of the 2 primary outcomes: the rate of prescription opioid dispensing and the MEQ/ person at the beginning (2006/07) and end (2018/19) of the study period. There were no significant differences between Red River Métis and other Manitobans in either measure in these 2 years.
Relative differences in the rate of prescription opioid dispensing and mean morphine equivalents/person among Red River Métis and all other Manitobans between 2006/07 and 2018/19
The age- and sex-adjusted rates of prescription opioid dispensing were significantly higher among Red River Métis than among other Manitobans in each study year (p < 0.001) (Figure 1A). (We present age- and sex-adjusted measures in Figure 1 to ensure fair comparisons between the 2 groups. The unadjusted prescription opioid dispensing rates and mean MEQ/person are available in Appendix 1, Figure S1).
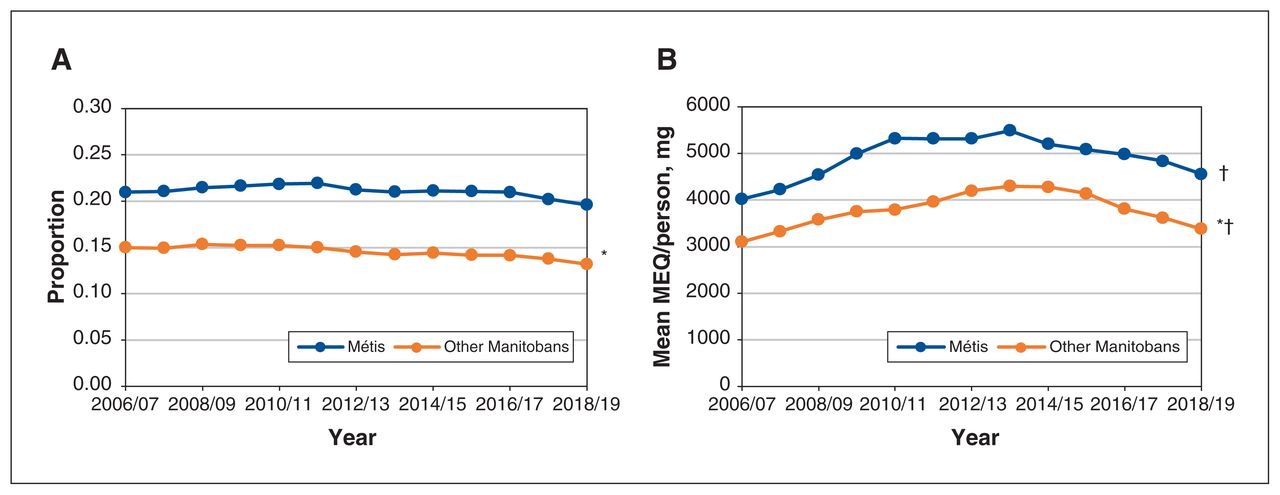
Time trends in the rate of prescription opioid dispensing and mean morphine equivalents (MEQ)/person among Red River Métis and all other Manitobans aged 10 years or older, 2006/07–2018/19. A) Time trends in age- and sex-adjusted rate of prescription opioid dispensing. p < 0.001 for difference between Métis and other Manitobans in each year. *Linear time trend p < 0.001. B) Time trends in age- and sex-adjusted mean MEQ/person. p < 0.001 for difference between Métis and other Manitobans in each year. *Linear time trend p < 0.001. †Non-linear time trend: Métis p < 0.001, other Manitobans p < 0.001.
Linear time trend analyses showed that the rate of dispensing decreased among other Manitobans from 2006/07 to 2018/19 (p < 0.001) but did not change among Red River Métis (p = 0.07). The age- and sex-adjusted mean MEQ/ person was higher among Red River Métis than among other Manitobans in each study year (p < 0.001) (Figure 1B). The linear time trend was significant for other Manitobans only, and the nonlinear time trend was significant for both groups (both p < 0.001). This means that, in both groups, MEQ/ person initially increased and then decreased over the study period; among other Manitobans only, it was higher at the end of the study period than at the beginning of the study period (p < 0.001).
Variations in opioid-associated morphine equivalents by study cohort characteristics
We examined relative differences between the 2 groups and time trends in MEQ by age group, number of comorbidities, income quintile and opioid type (Figure 2). The p values associated with the linear and nonlinear time trends are given in Appendix 1, Table S8. The results of 2 additional time trend analyses for MEQ/person (sex and urbanicity) are presented in Appendix 1, Figures S2 and S3.
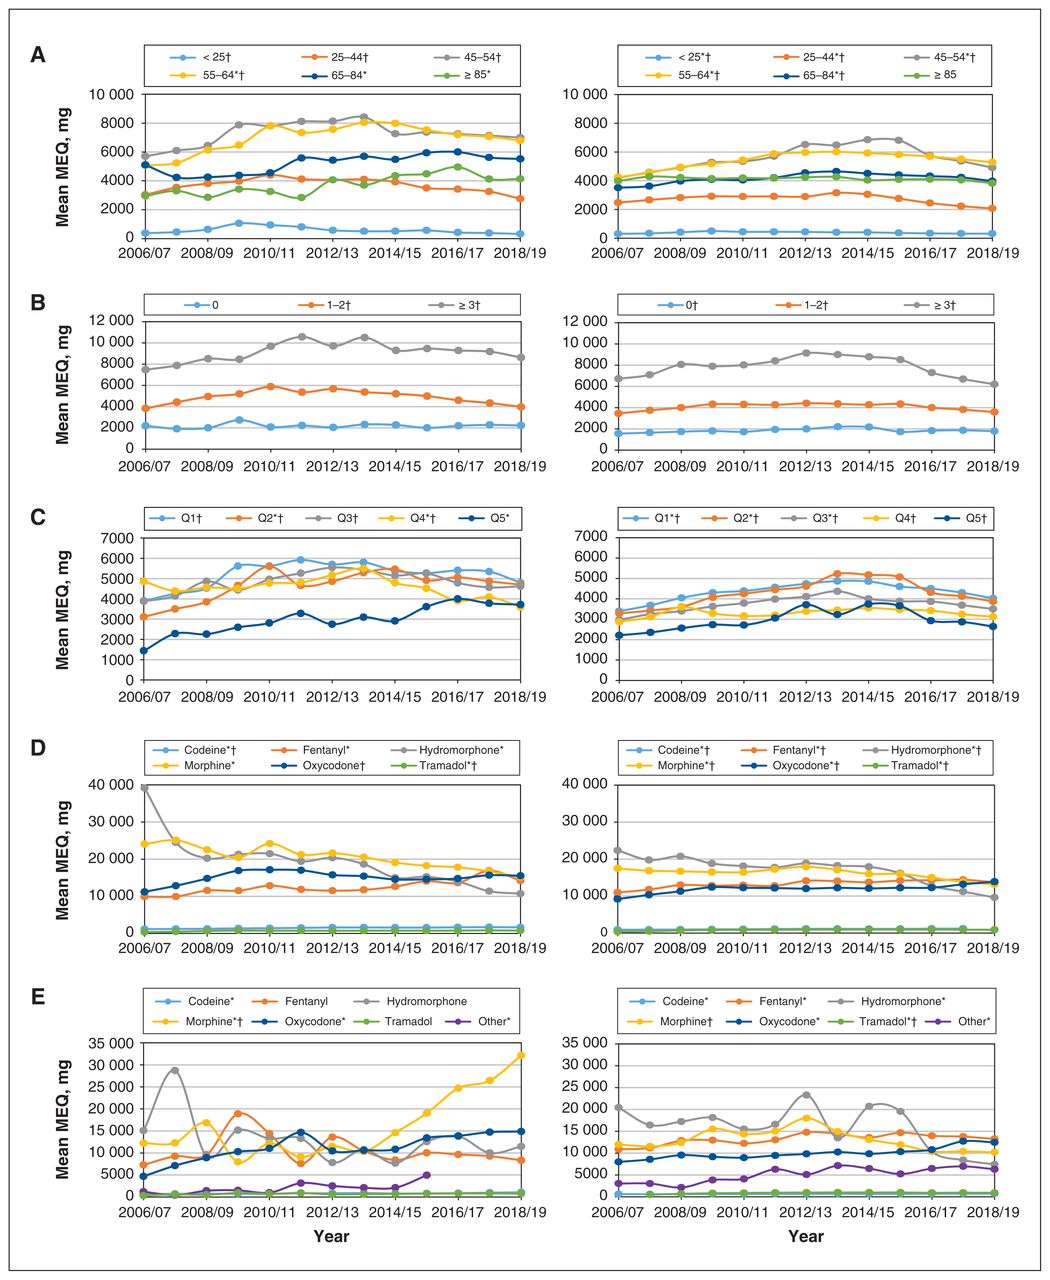
Time trends in prescription opioid morphine equivalents (MEQ) among Red River Métis (left) and all other Manitobans (right). A) Time trends by age group (years). B) Time trends by number of comorbidities. C) Time trends by income quintile (Q1 = lowest, Q5 = highest). D) Time trends by opioid type. E) Time trends for people in income quintile 5 only, by opioid type. p < 0.001 for difference between Métis and other Manitobans for each opioid type. Note: p < 0.001 for difference between Métis and other Manitobans for all comparisons. *Linear trend significant. †Nonlinear trend significant.
Age
The mean MEQ/person was higher among Red River Métis than among all other Manitobans for each age group (p < 0.001) (Figure 2A). In both groups, people less than 25 years of age had the lowest MEQ/person, and those aged 45–54 and 55–64 had the highest MEQ/person. Among Red River Métis, there was an upward linear trend in MEQ/person in the 3 oldest age groups (55–64 yr, 65–84 yr and ≥ 85 yr); there was a nonlinear trend in MEQ/person in the 4 youngest age groups (< 25 yr, 25–44 yr, 45–54 yr and 55–64 yr), which meant that MEQ/ person rose and then declined during the study period, ending up higher in 2018/19 than in 2006/07 for people aged 55–64 only. Among other Manitobans, both the upward linear and nonlinear time trends were significant for all age groups except people aged 85 or more.
Comorbidities
The mean MEQ/person was higher among Red River Métis than among other Manitobans for each subgroup of number of comorbidities (p < 0.001) (Figure 2B). In both groups, those with more comorbidities tended to have higher MEQ. There were no linear trends in either group, but there were nonlinear trends for nearly all subgroups, which means that, for each of these subgroups, the MEQ/person initially rose and then declined back to its value at the beginning of the study period.
Income quintile
The mean MEQ/person was higher among Red River Métis than among other Manitobans for each income quintile (p < 0.001) (Figure 2C). Among Red River Métis, there was an upward linear trend in MEQ/person in quintiles 2 and 5; among other Manitobans, there was an upward linear trend in quintiles 1–3 and a nonlinear trend in all 5 quintiles. These findings indicate increasing MEQ/person in these selected income quintiles.
Opioid type
The mean MEQ/person was higher among Red River Métis than other Manitobans for each type of opioid dispensed (p < 0.001) (Figure 2D). In both groups, there was an upward linear trend in MEQ/person for nearly all types of opioids examined (with the exception of oxycodone among Red River Métis).
We examined the mean MEQ/person by opioid type in the highest income quintile alone because of the notable patterns observed in Figure 2D. Among Red River Métis, MEQ/ person for codeine, morphine and oxycodone increased over the study period; among other Manitobans, MEQ/person for all opioid types except morphine increased over the study period (Figure 2E).
Interpretation
From 2006/07 to 2018/19, the rate of prescription opioid dispensing remained stable among Red River Métis but declined among other Manitobans. The MEQ/person of opioids prescribed to other Manitobans increased but did not change among Red River Métis. A large proportion of Manitobans with an opioid prescription were older (45–64 yr) and were experiencing multiple health challenges. Although there was generally an inverse relation between mean MEQ/person and income level, the MEQ for certain prescription opioids increased rapidly among people in the highest income quintile in the last several years of the study.
The different patterns suggest that Red River Métis were prescribed higher opioid dosages or higher-potency opioids, or both, than other Manitobans, particularly at certain ages and income quintiles. Further study is warranted to explore whether the differences between groups may herald potential opioid-related harms for both Red River Métis and other Manitobans.
There are many reasons why Métis may receive higher rates of opioid prescriptions, such as a higher prevalence of chronic disease requiring pain medication, as suggested by the significantly higher numbers of comorbidities observed among Red River Métis than among other Manitobans, and in other reports from Manitoba.22 Care providers may prescribe opioids to Métis at an inappropriately high rate: higher rates of opioid prescribing to Indigenous people in Canada, particularly those living remotely without a regular care provider, has been previously documented.23–25 The finding that the rate of prescription opioid dispensing decreased among other Manitobans over the study period is in contrast to growing opioid use in many other parts of Canada, including British Columbia, Alberta, Yukon and the Northwest Territories.2,3,26
Our study also showed that mean MEQ/person was higher among Red River Métis than among other Manitobans and that, for some types of opioids, it rose among Métis in the higher income quintiles over the study period. In a recent profile describing a cohort of prescription opioid users from British Columbia, long-term users accounted for only 3% of prescription opioid episodes but 88% of the total MEQ, and had a higher prevalence of higher-potency opioids (including hydromorphone, oxycodone, fentanyl and morphine) than other users.27
Prescribing of high-dose and high-potency opioids has been shown to be strongly associated with opioid-related morbidity and mortality.28 Gomes and colleagues3 found that, among Manitobans with active opioid prescriptions, 62.9% experienced an accidental overdose, 35.3% experienced an intentional overdose, and 52.2% had a hospital visit related to overdose; these proportions were among the highest in the country. Patients with opioid use disorder also tend to be prescribed high-dose opioids and may be more likely to take opioids in a hazardous manner compared to patients taking opioids for pain.29 However, against this backdrop, our findings still suggest a need to examine why some dispensations for prescription high-potency opioids increased over the study period.
Our findings will help the Red River Métis health leadership address the upstream determinants of opioid use, particularly in the context of the COVID-19 pandemic. The findings provide critical information for the health leadership to plan interventions and advocate for better resources and supports for people at risk for becoming dependent on opioids and experiencing opioid-related harms. The research team is currently working with the Manitoba Métis Federation to integrate the study findings into the current health policy landscape and develop Métis-specific strategies to eliminate the burden of the opioid crisis in these populations. We plan to explore in more detail the patterns of health and social outcomes associated with prescription opioid dispensing (e.g., rates of hospital admission and opioid use disorder), as well as physician prescribing practices. It would also be valuable to examine the epidemiologic features of pain-related disease and the various biologic, psychologic and sociocultural mechanisms that drive people to seek health care for pain management.
Limitations
The use of an administrative data repository as our main data source meant that we used prescription opioid dispensations as a proxy for opioid use; we did not have any information on whether dispensed opioids were taken as directed, nor could we be certain that the prescriptions given were appropriate.
Red River Métis who were not registered with the Manitoba Métis Federation may have been misclassified as other Manitobans. However, a report on the development and use of the Manitoba Métis Registry shows this would have affected only a very small number of people22 and would have had the effect of biasing our findings toward the null, possibly causing us to understate the significance of our findings.
Although the time trends end in 2018/19, they reflect the most up-to-date data available at the time of analyses, and there is very little to suggest that the opioid crisis in Manitoba has lessened substantially or even plateaued since then. It is likely that opioid use has increased since the onset of the COVID-19 pandemic, as suggested by recent reports of opioid-related deaths from across Canada.30–33
Conclusion
Although Canada is facing a widespread national opioid crisis, there is potential for prescription opioid use to contribute to opioid-related harms that disproportionately affect Red River Métis populations in Manitoba, especially older people, lower-income people and those with multiple comorbidities. The present findings highlight an urgent need for more research, more resources and the political will to tackle the Manitoba opioid crisis definitively.
Acknowledgements
The authors acknowledge the Manitoba government agencies and departments that provided the data used to conduct this study, including Manitoba Health and Seniors Care, Vital Statistics and the Winnipeg Regional Health Authority. They also acknowledge the support for this study provided by the president and cabinet of the Manitoba Métis Federation.
Footnotes
Competing interests: None declared.
This article has been peer reviewed.
Contributors: Nathan Nickel, Julianne Sanguins, Dan Chateau, S. Michelle Driedger, Jennifer Enns and Frances Chartrand conceptualized the study. Nathan Nickel, Julianne Sanguins, Dan Chateau, S. Michelle Driedger and Jennifer Enns led the study design and oversaw data acquisition. Carole Taylor and Gilles Detillieux analyzed the data. Carrie O’Conaill, Nathan Nickel and Jennifer Enns drafted the manuscript. All of the authors interpreted the data, revised the manuscript critically for important intellectual content, approved the final version to be published and agreed to be accountable for all aspects of the work.
Funding: This study was funded by the Public Health Agency of Canada through an agreement with the Manitoba Métis Federation.
Data sharing: Data used in this study were derived from administrative health and social data as a secondary use. The data were provided to the Manitoba Centre for Health Policy (MCHP) under specific data-sharing agreements only for approved use at MCHP. The original source data are not owned by the authors or the MCHP and as such cannot be provided to a public repository. Where necessary, source data specific to this article or project may be reviewed at MCHP with the consent of the original data providers, along with the required privacy and ethical review bodies.
Disclaimer: The Manitoba Centre for Health Policy was contracted by the Manitoba Métis Federation to complete the analyses in this manuscript (UM project #54147). The funders had no input into the study design or implementation, or interpretation of the findings. The results and conclusions are those of the authors, and no official endorsement by the funders, Manitoba Health and Seniors Care or other data providers is intended or should be inferred.
Supplemental information: For reviewer comments and the original submission of this manuscript, please see www.cmajopen.ca/content/10/1/E288/suppl/DC1.
This is an Open Access article distributed in accordance with the terms of the Creative Commons Attribution (CC BY-NC-ND 4.0) licence, which permits use, distribution and reproduction in any medium, provided that the original publication is properly cited, the use is noncommercial (i.e., research or educational use), and no modifications or adaptations are made. See: https://creativecommons.org/licenses/by-nc-nd/4.0/
References
- © 2022 CMA Impact Inc. or its licensors
In this issue

Article tools


