


Abstract
Background: Surgical delay may result in unintended harm to patients needing cardiac surgery, who are at risk for death if their condition is left untreated. Our objective was to derive and internally validate a clinical risk score to predict death among patients awaiting major cardiac surgery.
Methods: We used the CorHealth Ontario Registry and linked ICES health administrative databases with information on all Ontario residents to identify patients aged 18 years or more who were referred for isolated coronary artery bypass grafting (CABG), valvular procedures, combined CABG–valvular procedures or thoracic aorta procedures between Oct. 1, 2008, and Sept. 30, 2019. We used a hybrid modelling approach with the random forest method for initial variable selection, followed by backward stepwise logistic regression modelling for clinical interpretability and parsimony. We internally validated the logistic regression model, termed the CardiOttawa Waitlist Mortality Score, using 200 bootstraps.
Results: Of the 112 266 patients referred for cardiac surgery, 269 (0.2%) died while awaiting surgery (118/72 366 [0.2%] isolated CABG, 81/24 461 [0.3%] valvular procedures, 63/12 046 [0.5%] combined CABG–valvular procedures and 7/3393 [0.2%] thoracic aorta procedures). Age, sex, surgery type, left main stenosis, Canadian Cardiovascular Society classification, left ventricular ejection fraction, heart failure, atrial fibrillation, dialysis, psychosis and operative priority were predictors of waitlist mortality. The model discriminated (C-statistic 0.76 [optimism-corrected 0.73]). It calibrated well in the overall cohort (Hosmer–Lemeshow p = 0.2) and across surgery types.
Interpretation: The CardiOttawa Waitlist Mortality Score is a simple clinical risk model that predicts the likelihood of death while awaiting cardiac surgery. It has the potential to provide data-driven decision support for managing access to cardiac care and preserve system capacity during the COVID-19 pandemic, the recovery period and beyond.
Waitlist management for patients at high risk such as those needing cardiac surgery is an ongoing challenge for clinicians and administrators in Canada and other countries with publicly funded health care systems, where access to these procedures is limited by surgical capacity.1 The cardiac surgery waitlist has grown during the COVID-19 pandemic through lengthening wait times2 and delayed disease presentation owing to missed cardiac specialist visits.3,4 During the first wave of the pandemic, nonemergent cardiac procedures were deferred to ensure that sufficient resources were available to treat patients with COVID-19,2 which created surgical backlogs around the globe.5 As the pandemic evolves, evidence-based criteria are needed to facilitate timely and efficient resource allocation to address this surgical backlog.
The growing backlog of patients with advanced cardiac disease needing surgery creates a dilemma for clinicians and administrators, as these patients require monitoring in the intensive care unit after surgery and may potentially compete with patients with severe COVID-19 for resources. Our group recently developed and externally validated the CardiOttawa LOS Score as an evidence-based decision-support tool to identify high and low users of intensive care unit resources after cardiac surgery.6 However, safe triage decision-making goes beyond knowing patients’ postoperative health care resource needs: it also requires an accurate estimation of the risks they will face in waiting for surgery.
Published waitlist risk models are limited to specific populations, such as patients undergoing coronary artery bypass grafting (CABG).7 The only population-based study of death among patients awaiting cardiac surgery that we were able to identify included a small number of events and was focused on the identification of risk factors rather than the prediction of risk.1 Consequently, current recommendations for waitlist management8 were developed based on expert opinion rather than clinical evidence. Therefore, the objective of this population-based study was to derive and internally validate a clinical model to predict death among patients awaiting cardiac surgery in Ontario, Canada.
Methods
Design, setting and population
We conducted a population-based, retrospective cohort study of adult patients (aged ≥ 18 yr) who were awaiting CABG, valvular surgery, combined CABG–valvular surgery, or surgery on the thoracic aorta in Ontario between Oct. 1, 2008, and Sept. 30, 2019. Ontario is the most populous province in Canada, with roughly 14.6 million residents, and it is one of the most ethnically diverse jurisdictions in the world.9
We excluded patients who were awaiting transcatheter procedures, as well as those requiring rescue procedures, defined as emergent cardiac surgeries to treat acute myocardial ischemia or failed transcatheter interventions.10,11 For patients with multiple cardiac procedures during the study period, only the index procedure was included in the analysis.
Data sources
Using unique confidential identifiers, we deterministically linked the clinical registry of CorHealth Ontario and population-level administrative health care databases available at ICES. ICES is an independent, nonprofit research institute whose legal status under Ontario’s health information privacy law allows it to collect and analyze health care and demographic data, without consent, for health system evaluation and improvement. CorHealth Ontario maintains a detailed prospective registry of all patients who undergo invasive cardiac diagnostic and therapeutic procedures in Ontario, including demographic, comorbidity and procedure-related information. CorHealth Ontario data are collected prospectively from the time of surgical referral, and undergo selected chart audits and core laboratory validation.6,12–20
We linked the CorHealth Ontario cardiac registry (detailed surgical referral and waitlist data, date and type of cardiac procedure, physiologic and comorbidity data) with the Canadian Institute for Health Information Discharge Abstract Database (comorbidities, hospital admissions and in-hospital procedures), the Ontario Health Insurance Plan database (physician service claims) and the Registered Persons Database (vital statistics) using unique confidential identifiers.
We chose potential covariates considered in the analyses on the basis of review of the literature on death and complications among patients on the cardiac surgery waitlist,1,7,21,22 as well as the consensus of clinicians on the project team. These covariates included demographic, physiologic (e.g., hemoglobin concentration, serum creatinine level), anatomic (e.g., location of coronary stenosis, valvular function) and comorbidity data, as well as information regarding the proposed procedure (operative priority status, recommended surgical wait time, preoperative cardiogenic shock, redo sternotomy and type of surgery).
As in our previous studies,6,12–20,23–26 we obtained height, weight, operative priority and information pertaining to left ventricular ejection fraction, valvular disease and coronary anatomy from the CorHealth Ontario registry. In addition, we identified comorbidities from the CorHealth Ontario registry; when these data were missing, we supplemented them with data within 5 years before the index procedure from the Discharge Abstract Database and Ontario Health Insurance Plan using International Statistical Classification of Diseases and Related Health Problems, 10th Revision, enhanced Canadian version codes27 according to validated algorithms (Appendix 1, Supplemental Table S3, available at www.cmajopen.ca/content/10/1/E173/suppl/DC1).28–31
Outcome
The primary outcome was all-cause mortality that occurred between the date of acceptance onto the waitlist and the date of removal from the waitlist.
Statistical analysis
All analyses were performed at ICES. We compared baseline characteristics between survivors and nonsurvivors. We tested differences using the 2-sample t test for normally distributed variables, the Wilcoxon rank-sum test for other continuous variables, and the χ2 test for categoric variables. All tests were 2-sided without adjustment for multiplicity.
We imputed missing values using multiple imputations with fully conditional (Markov chain Monte Carlo) methods.32 Specifically, we used logistic regression modelling to generate 5 imputed data sets using the MI procedure of SAS/STAT software (SAS Institute), where missing values were predicted drawing on all candidate covariates. Each imputation provided a complete data set, reflecting the distributions and correlations between variables. The current recommendation for multiple imputations is to generate 2–10 data sets.33 We routinely generate 5 data sets for our studies to support a good number of imputations while accommodating the computing requirement of our large dataset.
We used a hybrid approach of the random forest method for initial variable selection, followed by stepwise logistic regression for clinical interpretability and parsimony.34,35 Details of the random forest method have been described elsewhere.36–38 In short, we used a bootstrap sample of the data to build each of the classification trees. A random subset of variables was selected at each split, thereby constructing a large collection of decision trees with controlled variation. The trees are left unpruned to minimize bias. Every tree in the forest casts a “vote” for the best classification (survival v. death) for a given observation, and the class receiving the most votes results in the prediction for that specific observation. We first sampled the data set to create an in-bag partition (two-thirds of the derivation sample) to construct the decision tree, and a smaller out-of-bag partition (one-third of the derivation sample) to test the constructed tree to evaluate its performance. The random forest method calculates estimates of variable importance for classification using the permutation variable importance measure,36 which is based on the decrease of classification accuracy when values of a variable in a node of a tree are permuted randomly. Our model was based on 500 classification trees and 6 variables available for splitting at each tree node.
We identified a subset of the top 30 predictor variables out of the 40 candidate variables on the basis of variable importance from the random forest model and incorporated them into a logistic model. We entered the predictor variables into a multivariable backward stepwise logistic regression model based on both clinical and statistical significance, with p < 0.1 for entry and p < 0.05 for retention. The final prediction model was termed the CardiOttawa Waitlist Mortality Score.
We evaluated model discrimination using the C-statistic. We obtained an optimism-corrected C-statistic from 200 bootstrap samples drawn with replacement from the study sample. We reported sensitivity, specificity, positive predictive value and negative predictive value using the cut-point that maximized the sum of sensitivity and specificity (Youden index).39 We assessed calibration using the Hosmer–Lemeshow χ2 statistic and the Brier score40 (a calibration plot comparing observed versus expected mortality rates within deciles of expected risk in the overall cohort), as well as a comparison of observed versus expected mortality rates across different subgroups according to type of surgery.
We used the random Forest package for R version 3.6.3 (R Foundation for Statistical Computing), as well as SAS version 9.4. Statistical significance was defined by a 2-sided p value of < 0.05.
Sensitivity analysis
We conducted 2 post hoc sensitivity analyses to test the robustness of our findings. First, we investigated the procedures for which operative priority was unknown. We found that all of these cases were booked as thoracic aorta surgery. We then imputed the operative priority status for these procedures and followed the modelling approach described above. We then modelled death on the waitlist as a function of time. Specifically, candidate variables were entered into a multivariable backward stepwise Cox proportional hazards model with an entry threshold of p < 0.1 and were retained in the model if they had a significance threshold of < 0.05. We treated adherence to the wait time recommended by the Canadian Cardiovascular Society8 as a time-varying covariate in this model. We assessed model performance at 30 and 90 days, using the C-statistic for discrimination and the Brier score calibration plots of observed versus expected mortality rates within deciles of expected rate in the overall cohort and across each type of surgery for calibration.
Ethics approval
The data set from this study is held securely in coded form at ICES. The use of data was authorized under section 45 of Ontario’s Personal Health Information Protection Act, which does not require review by a research ethics board.16
Results
Of the 112 266 patients referred for cardiac surgery, 269 (0.2%) died while awaiting surgery: 118/72 366 (0.2%) while awaiting isolated CABG, 81/24 461 (0.3%) while awaiting valvular procedures, 63/12 046 (0.5%) while awaiting combined CABG–valvular procedures, and 7/3393 (0.2%) while awaiting thoracic aorta procedures. The median wait time was 13 (interquartile range [IQR] 4–38) days overall and was 7 (IQR 3–26) days for CABG, 32 (IQR 12–62) days for valvular surgery, 21 (IQR 7–46) days for combined CABG–valvular surgery and 35 (IQR 9–64) days for thoracic aorta procedures.
Compared to patients who survived the waitlist period, those who died were older and more likely to have had a high-risk acute coronary syndrome; to have reduced left ventricular ejection fraction, heart failure, aortic or mitral regurgitation warranting operative intervention, severe aortic stenosis, and comorbidities such as diabetes, cerebrovascular disease, peripheral arterial disease, renal and liver dysfunction, anemia and psychosis; to be scheduled for urgent, reoperative valvular or combined CABG–valvular surgery with shorter recommended wait times; and to present with unexpected cardiogenic shock before the scheduled procedure (Table 1).
Baseline and operative characteristics of patients awaiting isolated CABG, valvular surgery, combined CABG and valvular surgery, or surgery on the thoracic aorta in Ontario, Oct. 1, 2008, to Sept. 30, 2019, by mortality status
Predictors of waitlist mortality
Left ventricular ejection fraction was missing for 3197 patients (2.8%), preoperative serum creatinine value for 5021 (4.5%), height for 5795 (5.2%) and weight for 5464 (4.9%). No other data were missing.
The error rate of the random forest model, defined as the proportion of times the result is not accurate in the overall sample, was 24%. The resulting top 30 predictor variables are summarized in Appendix 1, Supplemental Figure S1. After we applied stepwise logistic regression to achieve parsimony, the final model consisted of 11 variables (Table 2). Sex, type of surgery, left main coronary artery equivalent disease anatomy and Canadian Cardiovascular Society classification were forced into the model on the basis of clinical importance. Other multivariable predictors of waitlist mortality were age, left ventricular ejection fraction, history of heart failure, atrial fibrillation, dialysis, psychosis and operative priority.
Multivariable predictors of death while awaiting surgery
Model performance
The C-statistic of the multivariable model was 0.76. After optimism correction, the C-statistic was 0.73, the Hosmer–Lemeshow χ2 statistic was 10.76 with 8 degrees of freedom (p = 0.2), and the Brier score was 0.0024. Figure 1A shows the observed versus expected waitlist mortality rates according to decile of expected rate. The lowest risk decile had a waitlist mortality rate of 0.018% (95% confidence interval 0.0%–0.045%), and the highest risk decile had a rate of 0.99% (95% confidence interval 0.82%–1.15%). The observed and predicted numbers of waitlist deaths were similar across all probability deciles. The model was highly calibrated across each type of surgery (Figure 1B).
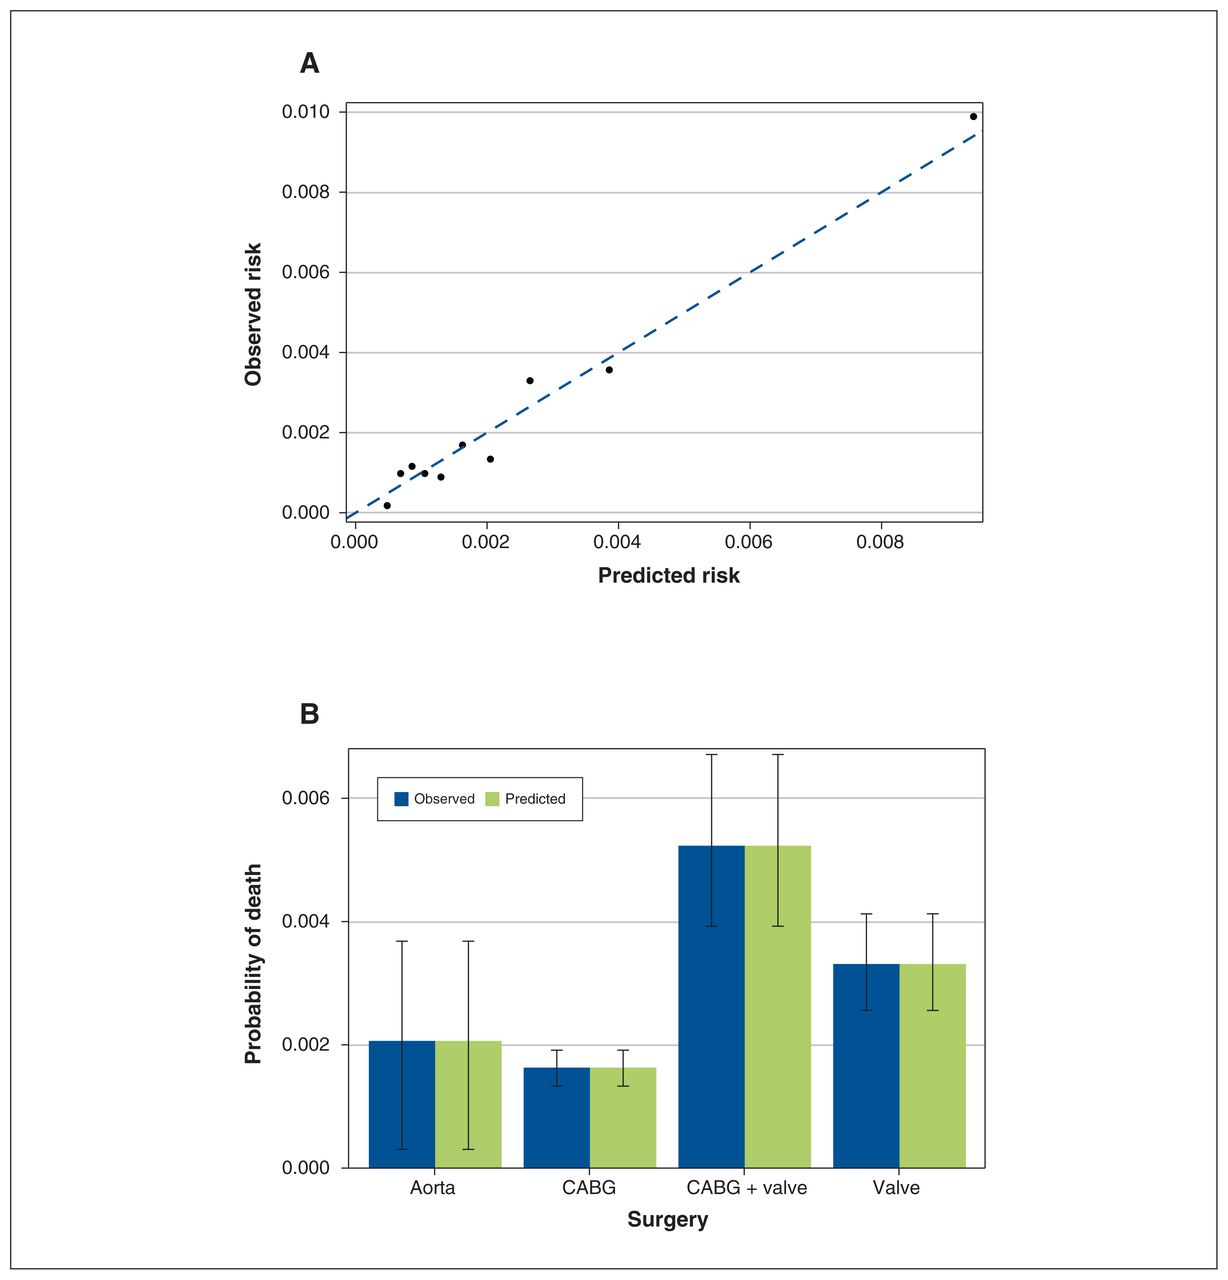
(A) Calibration plot of observed versus expected rate of waitlist mortality according to decile of expected rate. (B) Observed versus expected rate of waitlist mortality by type of cardiac surgery. Error bars indicate 95% confidence intervals, obtained through 200 bootstraps. Note: CABG = coronary artery bypass grafting.
The receiver-operating characteristic curve for the CardiOttawa Waitlist Mortality Score is presented in Figure 2. The cut-point that maximized the Youden index on the curve was at a predicted probability of 0.24%, with sensitivity of 69.1%, specificity of 72.1%, positive predictive value of 0.59% and negative predictive value of 99.9%.
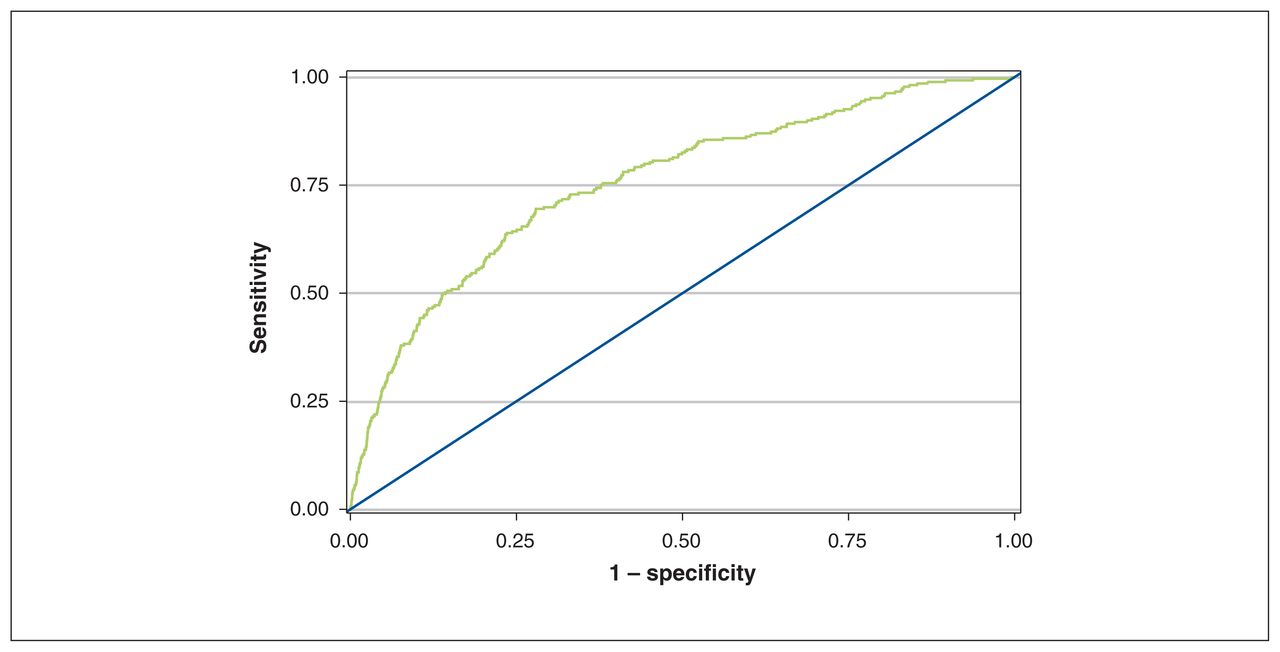
Receiver-operating characteristic curve of the CardiOttawa Waitlist Mortality Score.
CardiOttawa Waitlist Mortality Score
The β-coefficients for the final model are presented in Table 2.
Sensitivity analysis
The model with imputed unknown operative priority (Appendix 1, Supplemental Table S1) was similar to the original model, with a C-statistic of 0.75 (0.72 after optimism correction), Hosmer–Lemeshow χ2 statistic of 8.00 with 8 degrees of freedom (p = 0.4) and Brier score of 0.0024. The time-to-event model was also similar to the original model (Appendix 1, Supplemental Table S2). The model C-statistic was 0.82 (optimism-corrected, 0.80) at 30 days and 0.78 (optimism-corrected, 0.76) at 90 days. Brier scores at 30 and 90 days were 0.0029 and 0.0061, respectively. The model tends to overestimate in the highest risk decile in the overall cohort (Appendix 1, Supplemental Figure S2) and overpredicts across all types of surgery, especially in those awaiting CABG and combined CABG–valvular procedures (Appendix 1, Supplemental Figure S3).
Interpretation
We developed the CardiOttawa Waitlist Mortality Score to provide triage decision support for patients awaiting cardiac surgery using variables that are readily available at the time of surgical referral. The model was derived and validated in a large, representative population. It discriminates moderately, has excellent calibration across all types of surgery and applies to a broad range of cardiac surgical procedures.
In comparison, Senaratne and colleagues1 found that wait times recommended by the Canadian Cardiovascular Society poorly discriminated waitlist mortality across a similar variety of proposed cardiac procedures (C-statistic = 0.577). A smaller, single-centre Scandinavian study that produced a mortality risk score from 42 deaths among patients awaiting CABG did not report performance metrics for the model.7
The few existing waitlist risk algorithms were single-centre, included small numbers of events, or were tailored to specific populations such as patients awaiting CABG or heart transplantation.7,21,43–45 The only contemporary study of waitlist mortality broadly encompassing major types of cardiac procedures that we were able to identify was limited to risk factor identification.1 The current Canadian benchmarks for cardiac surgery wait times were developed based on expert opinion in 2005 and have limited ability to prevent death among patients on the waitlist.8 In their study investigating 101 deaths among patients awaiting cardiac surgery in Alberta, Canada, Senaratne and colleagues1 found that many patients died within the waitlist time frames recommended by the Canadian Cardiovascular Society. A recent statement from the Canadian Society of Cardiac Surgeons highlighted that “it is critically important that cardiac surgeons ensure the presence of a robust wait-times database at their institutions that captures rates of adverse events in these patients while on the wait list so that decisions around the reallocation of resources may be made in a timely fashion.”46 Despite the need for a data-driven waitlist assessment tool to improve patient care, the triage classification system proposed in this statement had not been tested with real-world data.47
Current recommended wait times are based primarily on anatomic factors such as coronary and valvular heart disease.8 The CardiOttawa predictor variables are consistent with those identified in the literature1,7,21,22 and capture important information on baseline patient factors (demographic characteristics, medical conditions, hemodynamic stability) as well as proposed surgical information, in addition to anatomic factors. Whereas the wait times for cardiac procedures recommended by the Canadian Cardiovascular Society8 are likely too long to ensure patient safety, the CardiOttawa Waitlist Mortality Score has the potential to reduce patient mortality through better risk stratification at the time of referral. The waitlist mortality score could be combined with the CardiOttawa LOS Score6 to identify patients at high risk and enable evidence-based surgical scheduling to optimize postoperative use of intensive care unit resources. The combined risk calculator, termed the CardiOttawa 2.1: COVID Triage Tool, can be accessed at https://cardiottawa.ottawaheart.ca. The caveat that applies to all decision-support tools is pertinent because the CardiOttawa Waitlist Mortality Score is intended to assist the clinician, who should ultimately synthesize the predictive score with clinical judgment in making decisions.
Limitations
Major strengths of our waitlist mortality tool are its derivation from a large, ethnically diverse population, its high degree of calibration across a broad spectrum of cardiac procedures and its suitability for use at the time of surgical referral. As the model is intended to guide waitlist triage decisions, it is important that it be validated in a patient sample that is representative of the population for which the tool will be used.
Because universal drug coverage is available in Ontario only to residents aged 65 years or more (as well as certain other eligible groups), we were not able to include information on prescription medications for all patients in the modelling process. However, medications have not routinely been incorporated in models of cardiac surgical risk to date. In addition, model simplicity is an important element of decision-support tools, and thus it is better to carefully select potential factors rather than incorporate an exhaustive list.
The low event rates within each type of surgery precluded procedure-specific modelling. Nonetheless, a multicentre, omnibus risk model is efficient and practical, as operating time is a shared resource. Certain detailed physiologic measures such as brain natriuretic peptide level were lacking in the databases used. However, brain levels of this hormone are not routinely measured in the perioperative setting. There were advances in transcatheter techniques over the course of the study period. Further research is needed to identify how the advent of these minimally invasive procedures may have influenced the referral process and outcomes.
We performed optimism correction on the logistic regression model alone, and not on the random forest model. As death while awaiting cardiac surgery is rare, we were unable to account for nonlinearity of the continuous variables or to split our cohort into derivation and validation samples. Our model should ideally be validated in the contemporary pandemic era to evaluate its performance in the setting of prolonged wait times.
Conclusion
The CardiOttawa Waitlist Mortality Score is a simple clinical risk model that predicts the likelihood of death among patients awaiting major cardiac surgery. It included a population-based sample and had excellent calibration across all procedure types. It could be validated during the present era of prolonged waitlist times and be combined with the CardiOttawa LOS Score to provide rapid, data-driven decision support for clinicians, hospital administrators and policymakers as they manage access to cardiac care and preserve system capacity during the COVID-19 pandemic, the recovery period and beyond.
Acknowledgment
The authors acknowledge the use of data compiled and provided by the Canadian Institute for Health Information.
Footnotes
Competing interests: None declared.
This article has been peer reviewed.
Contributors: Louise Sun conceived and designed the study and drafted the manuscript. Louise Sun and Anan Bader Eddeen acquired, analyzed and interpreted the data. All of the authors revised the manuscript critically for important intellectual content, approved the final version to be published and agreed to be accountable for all aspects of the work.
Funding: This study was supported by an Innovation grant from the Ontario Ministry of Health (MOH). Louise Sun was named National New Investigator by the Heart and Stroke Foundation of Canada and is supported by a Tier 2 Clinical Research Chair in Big Data and Cardiovascular Outcomes at the University of Ottawa. Harindra Wijeysundera is supported by a Phase 2 Clinician-Scientist award from the Heart and Stroke Foundation of Canada, Ontario Office. Douglas Lee is supported by a Mid-Career Investigator Award from the Heart and Stroke Foundation. Marc Ruel and Thierry Mesana are supported by endowed research chairs at the University of Ottawa Heart Institute. This study was also supported by ICES, which is funded by an annual grant from the Ontario MOH and the Ontario Ministry of Long-Term Care.
Data sharing: The data set from this study is held securely in coded form at ICES. Although legal data-sharing agreements between ICES and data providers (e.g., health care organizations and government) prohibit ICES from making the data set publicly available, access may be granted to those who meet prespecified criteria for confidential access, available at https://www.ices.on.ca/DAS (email: das{at}ices.on.ca). The full data set creation plan and underlying analytic code are available from the authors on request, with the understanding that the computer programs may rely on coding templates or macros that are unique to ICES and are therefore either inaccessible or may require modification.
Disclaimer: The opinions, results and conclusions reported in this article are those of the authors and are independent from the funding and sources. No endorsement by ICES or the Ontario Ministry of Health (MOH) is intended or should be inferred. Parts of this material are based on data and information compiled and provided by the Canadian Institute for Health Information. The authors acknowledge that the clinical registry data used in this analysis are from participating hospitals through CorHealth Ontario, which serves as an advisory body to the Ontario MOH and is funded by the Ontario MOH.
Supplemental information: For reviewer comments and the original submission of this manuscript, please see www.cmajopen.ca/content/10/1/E173/suppl/DC1.
This is an Open Access article distributed in accordance with the terms of the Creative Commons Attribution (CC BY-NC-ND 4.0) licence, which permits use, distribution and reproduction in any medium, provided that the original publication is properly cited, the use is noncommercial (i.e., research or educational use), and no modifications or adaptations are made. See: https://creativecommons.org/licenses/by-nc-nd/4.0/
References
- © 2022 CMA Impact Inc. or its licensors
In this issue

Article tools


Related Articles
Cited By...
- No citing articles found.