


Article Figures & Tables
Figures
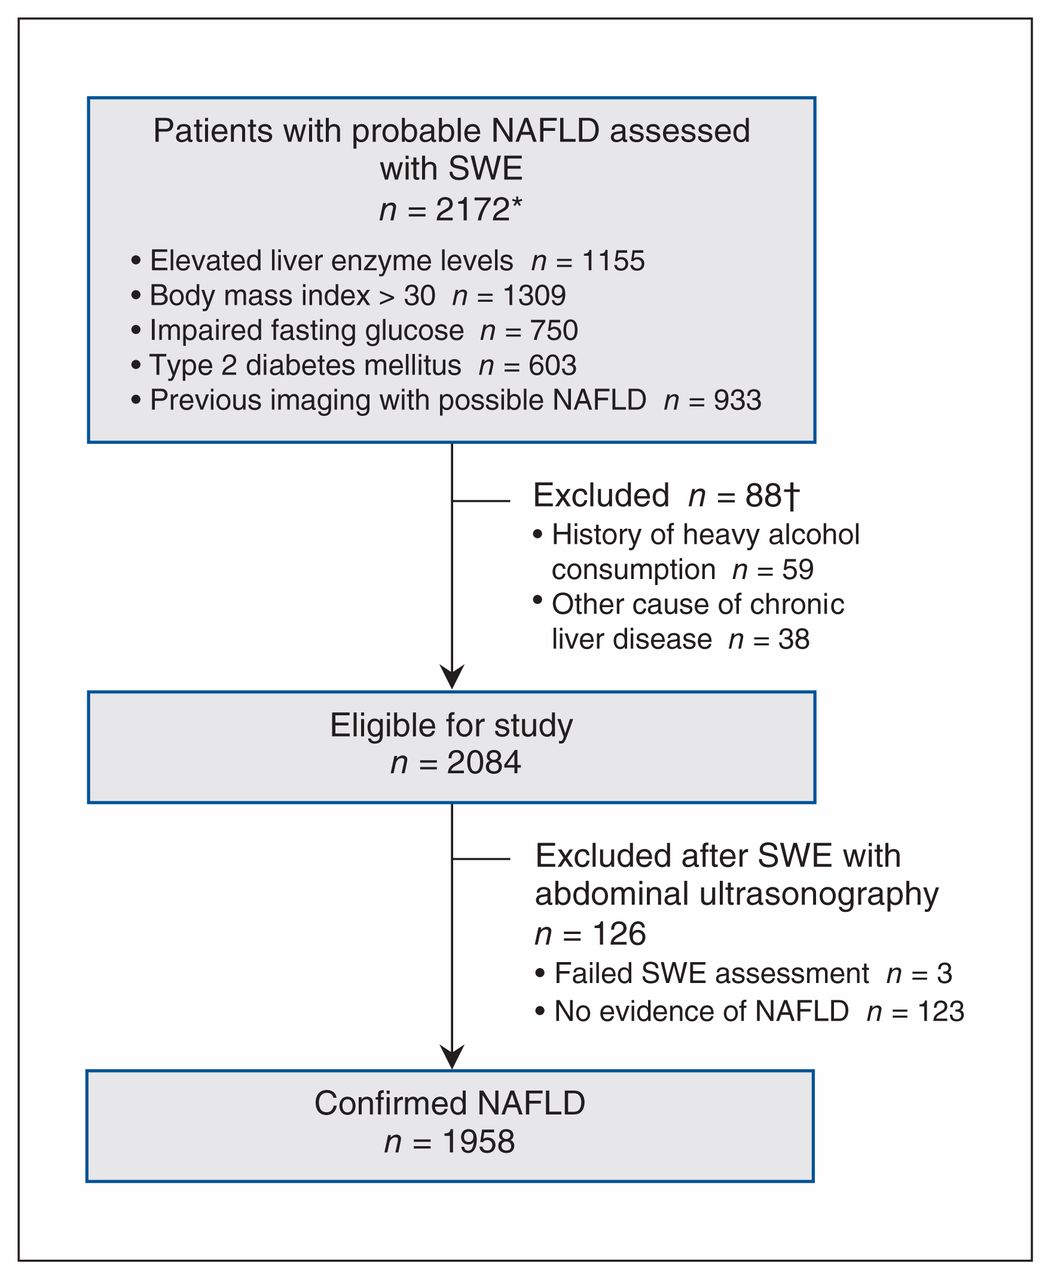
- Figure 1:
Flow chart showing selection of study cohort. Note: NAFLD = nonalcoholic fatty liver disease, SWE = shear wave elastography. *Some patients had more than 1 condition. †Some patients had both exclusion criteria.
Tables
- Table 1:
Characteristics of patients with nonalcoholic fatty liver disease according to shear wave elastography result
Characteristic Group; no. (%) of patients* p value† Total cohort
n = 1958SWE value ≥ 8 kPa
n = 67Inconclusive result
n = 100SWE value < 8 kPa
n = 1791Age, yr, median (IQR) 55 (45–63) 61 (49–69) 57 (47–65) 54 (45–63) 0.004 Female sex 1052 (53.7) 44 (65.7) 55 (55.0) 953 (53.2) 0.1 Body mass index, median (IQR) (n = 1764) 32.0 (28.0–36.6) 37.2 (31.7–40.8) 40.6 (33.4–47.2) 31.6 (27.8–35.9) < 0.001 Baseline laboratory investigations, median (IQR) ALT, U/L (n = 1944) 38 (25–60) 37 (21–63) 31 (20–52) 38 (25–61) 0.05 AST, U/L (n = 1273) 29 (21–42) 36 (23–56) 27 (19–50) 29 (21–41) 0.06 Albumin, g/L (n = 1473) 39 (37–41) 37 (36–39) 37 (34–39) 39 (37–41) < 0.001 ALP, U/L (n = 1667) 77 (64–94) 91 (68–107) 85 (71–118) 76 (63–93) < 0.001 GGT, U/L (n = 1627) 45 (27–87) 87 (36–133) 48 (29–138) 45 (27–82) < 0.001 INR (n = 875) 1.0 (1.0–1.1) 1.0 (1.0–1.1) 1.0 (1.0–1.2) 1.0 (1.0–1.0) < 0.001 Platelet count, 10 × (9)/L (n = 1922) 250 (209–294) 214 (169–255) 234 (179–295) 252 (211–295) < 0.001 Triglycerides, mmol/L (n = 1830) 1.80 (1.28–2.61) 1.79 (1.23–2.37) 1.71 (1.28–2.30) 1.81 (1.28–2.64) 0.2 Cholesterol, mmol/L (n = 1831) 4.75 (4.01–5.48) 4.04 (3.44–4.70) 4.01 (3.42–4.87) 4.81 (4.10–5.53) < 0.001 HDL, mmol/L (n = 1831) 1.16 (0.95–1.39) 1.11 (0.90–1.34) 1.10 (0.92–1.31) 1.16 (0.96–1.39) 0.09 LDL, mmol/L (n = 1831) 2.61 (1.95–3.27) 2.07 (1.57–2.55) 2.10 (1.62–2.71) 2.66 (2.03–3.33) < 0.001 Creatinine, mmol/L (n = 1895) 74 (60–87) 67 (51–79) 66 (54–79) 74 (61–88) < 0.001 Hemoglobin A1c, % (n = 1810) 5.7 (5.5–6.2) 6.2 (5.6–7.2) 6.1 (5.6–7.1) 5.7 (5.4–6.2) < 0.001 Diabetes mellitus 562 (28.7) 38 (56.7) 50 (50.0) 474 (26.5) < 0.001 Impaired fasting glucose 657 (33.6) 12 (17.9) 24 (24.0) 621 (34.7) 0.002 Hypertension 798 (40.8) 41 (61.2) 63 (63.0) 694 (38.7) < 0.001 Fibrosis-4 index score, median (IQR) (n = 1251) 0.99 (0.69–1.48) 1.71 (1.03–2.63) 1.19 (0.77–2.05) 0.96 (0.68–1.41) < 0.001 Note: ALP = alkaline phosphatase, ALT = alanine aminotransferase, AST = aspartate aminotransferase, GGT = γ-glutamyl transpeptidase, HDL = high-density lipoprotein, INR = international normalized ratio, IQR = interquartile range, LDL = low-density lipoprotein, SWE = shear wave elastography.
↵* Except where noted otherwise.
↵† For comparison between cohort subgroups (3 groups).
- Table 2:
Classification of patients with nonalcoholic fatty liver disease who had available fibrosis-4 index scores according to fibrosis-4 index score and shear wave elastography value
SWE value, kPa FIB-4 index score; no. (%) of patients ≥ 1.30
n = 396< 1.30
n = 855≥ 8.0 34 (8.6) 21 (2.5) < 8.0 362 (91.4) 834 (97.5) Note: FIB-4 = fibrosis-4, SWE = shear wave elastography.
- Table 3:
Independent predictors of shear wave elastography result of 8 kPa or greater and need for hepatology referral*
Characteristic Predictors of SWE value ≥ 8 kPa, OR (95% CI) Predictors of inconclusive result or SWE value ≥ 8 kPa, OR (95% CI) Univariate analysis Multivariate model Univariate analysis Multivariate model Age > 60 yr 2.05 (1.26–3.34) 1.33 (0.75–2.37) 1.49 (1.08–2.05) 0.88 (0.60–1.31) Female sex 1.68 (1.00–2.80) 1.40 (0.80–2.48) 1.28 (0.93–1.77) 1.14 (0.79–1.64) Elevated ALT or AST level at baseline 1.61 (0.97–2.68) NS 0.96 (0.70–1.32) NS Body mass index ≥ 30 2.11 (1.10–4.04) 1.93 (1.01–3.75) 3.19 (2.02–5.06) 2.94 (1.85–4.69) Diabetes mellitus type 2 3.42 (2.09–5.60) 2.22 (1.13–4.36) 3.10 (2.24–4.27) 2.33 (1.50–3.63) Impaired fasting glucose 0.42 (0.22–0.79) 0.75 (0.33–1.67) 0.52 (0.35–0.76) 0.91 (0.55–1.49) Hypertension 2.36 (1.43–3.89) 2.18 (1.19–3.98) 2.61 (1.88–3.62) 2.38 (1.62–3.50) Note: ALT = alanine aminotransferase, AST = aspartate aminotransferase, CI = confidence interval, NS = not significant in univariate analysis, OR = odds ratio, SWE = shear wave elastography.
↵* Adjusted for age and sex in multivariate models even if either variable was not significant in univariate models.
In this issue

Article tools


Related Articles
Cited By...
- No citing articles found.