


Article Figures & Tables
Figures
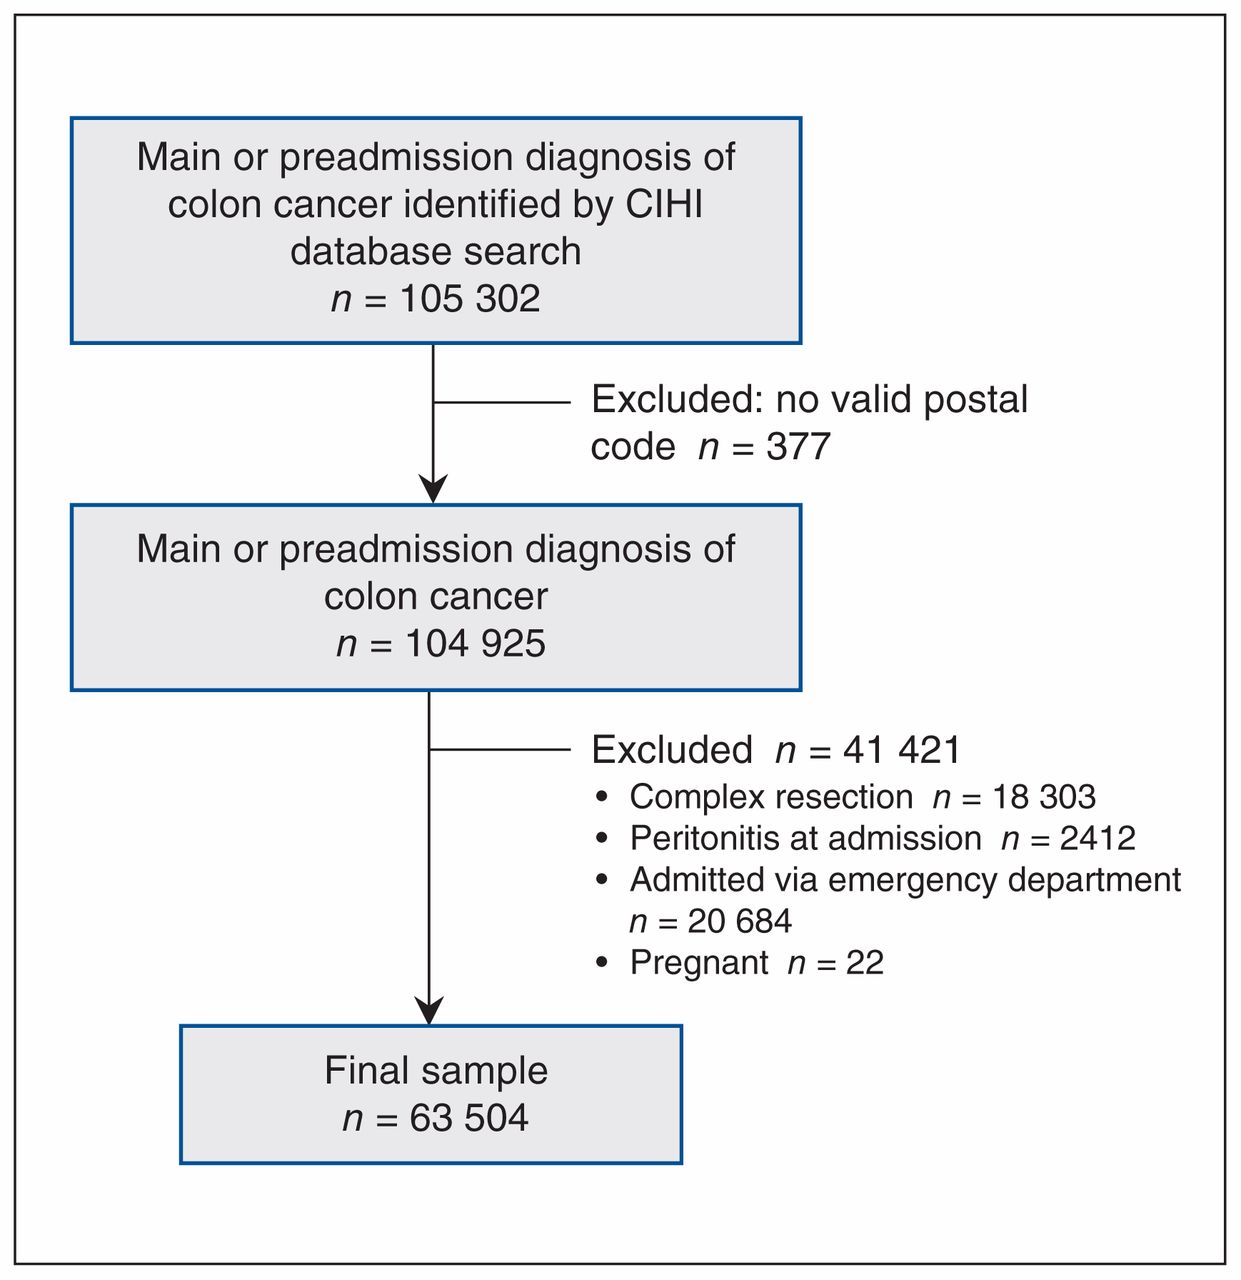
- Figure 1:
Flow diagram showing cohort selection. Note: CIHI = Canadian Institute for Health Information.
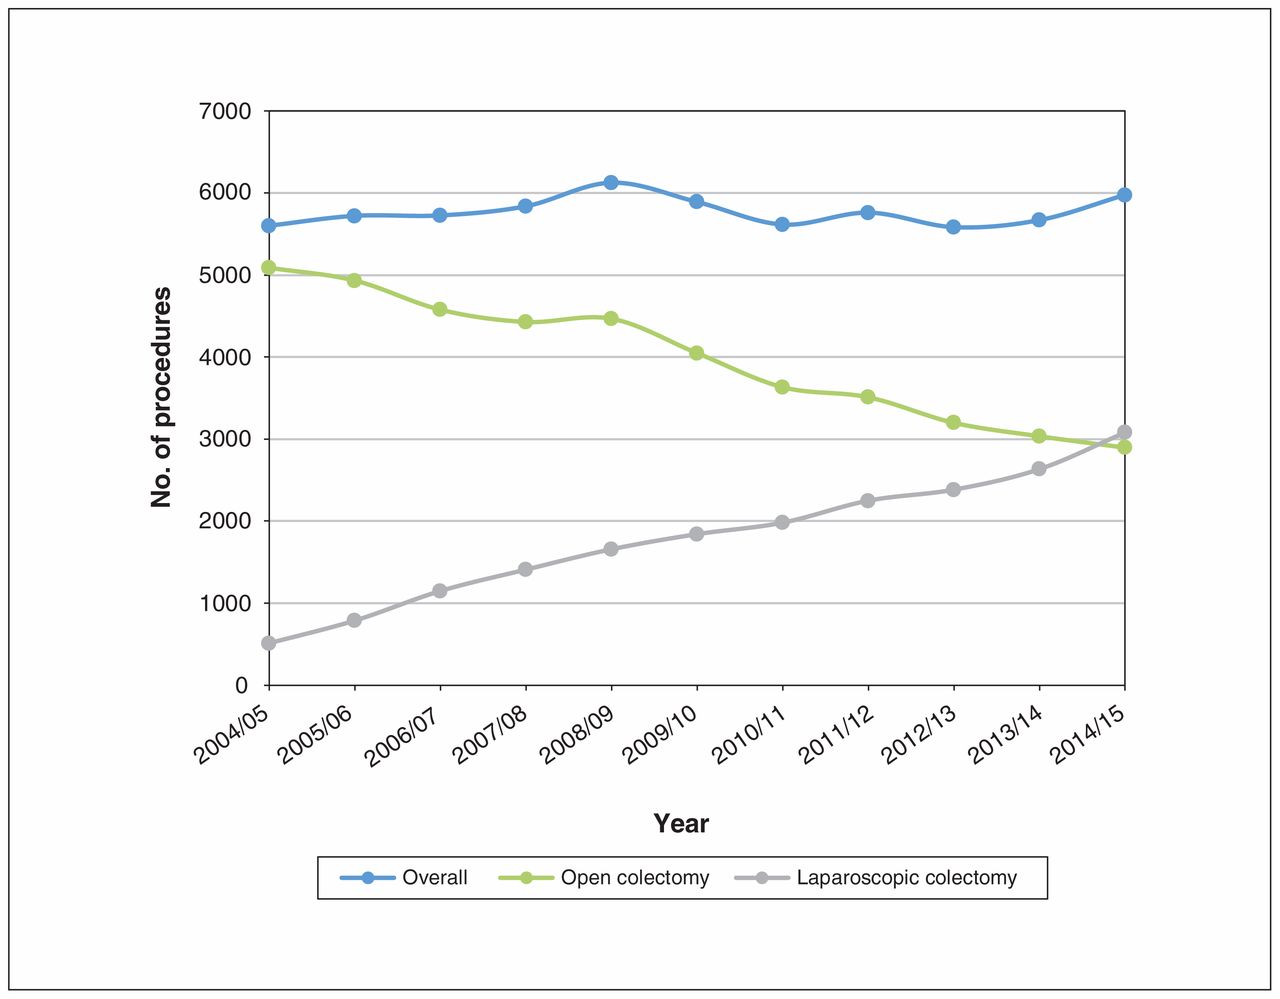
- Figure 2:
Number of overall, open and elective laparoscopic colectomy procedures for colon cancer in Canadian provinces except Quebec, 2004/05 to 2014/15.
- Figure 3:
Annual proportion of elective laparoscopic colectomy procedures by province, 2004/05 to 2014/15.

Tables
- Table 1:
Patient demographic and clinical characteristics and system characteristics for patients who underwent elective laparoscopic or open colectomy for colon cancer between 2004/05 and 2014/15 in Canada (excluding Quebec)
Variable Group; no. (%) of patients*
(95% CI)Laparoscopic
n = 19 691Open
n = 43 813Age, yr, mean ± SD 69 ± 12
(68.8–69.1)70 ± 12
(69.8–70.1)Sex Male 10 416 (52.9)
(52.2–53.6)24 158 (55.1)
(54.7–55.6)Female 9275 (47.1)
(46.4–47.8)19 655 (44.9)
(44.4–45.3)Elixhauser Comorbidity Index score 0 12 854 (65.3)
(65.0–66.0)28 176 (64.3)
(64.0–65.0)1–3 6714 (34.1)
(33.4–34.8)15 297 (34.9)
(34.5–35.4)> 3 123 (0.6)
(0.5–0.8)340 (0.8)
(0.7–0.9)Residence Rural 3253 (16.5)
(16.0–17.1)10 560 (24.1)
(23.7–24.5)Urban 16 438 (83.5)
(82.9–83.9)33 253 (75.9)
(75.5–76.3)Surgeon volume Low (1–7) 5771 (29.3)
(28.7–29.9)17 681 (40.4)
(39.9–40.8)High (8–37) 13 920 (70.7)
(70.1–71.3)26 132 (59.6)
(59.2–60.1)Hospital volume Low (1–36) 5301 (26.9)
(26.3–27.5)20 100 (45.9)
(45.5–46.4)High (37–102) 14 390 (73.1)
(72.5–73.7)23 713 (54.1)
(53.7–54.6)Resection type Right hemicolectomy 10 004 (50.8)
(50.1–51.5)19 902 (45.4)
(44.9–45.9)Left hemicolectomy 5809 (29.5)
(28.9–30.1)12 200 (27.8)
(27.4–28.3)Anterior resection 2706 (13.7)
(13.3–14.2)8403 (19.2)
(18.8–19.6)Other 1172 (6.0)
(5.6–6.3)3308 (7.6)
(7.3–7.8)Note: CI = confidence interval, SD = standard deviation.
↵* Except where noted otherwise.
- Table 2:
Univariate and multivariate logistic regression of factors associated with elective laparoscopic colectomy for colon cancer
Variable OR* (95% CI) Univariate Multivariate Year (2014/15 relative to 2004/05) 7.55 (7.12–8.00) 9.31 (8.60–10.09) Female sex (reference) 1.00 1.00 Male sex 0.92 (0.88–0.95) 0.94 (0.90–0.98) Age, yr 66–80 (reference) 1.00 1.00 18–50 1.19 (1.11–1.28) 1.15 (1.07–1.24) 51–65 1.11 (1.06–1.15) 1.14 (1.09–1.19) > 80 0.93 (0.89–0.98) 0.87 (0.83–0.92) Province Ontario (reference) 1.00 1.00 Newfoundland and Labrador 0.12 (0.10–0.14) 0.14 (0.12–0.16) New Brunswick 0.15 (0.13–0.17) 0.16 (0.14–0.19) Prince Edward Island 0.14 (0.11–0.20) 0.23 (0.17–0.32) Manitoba 0.36 (0.33–0.39) 0.39 (0.36–0.43) Saskatchewan 0.42 (0.38–0.46) 0.54 (0.49–0.60) Nova Scotia 0.44 (0.40–0.48) 0.53 (0.48–0.59) Alberta 0.64 (0.60–0.67) 0.57 (0.53–0.60) British Columbia 0.86 (0.82–0.90) 0.89 (0.85–0.93) Residence Rural (reference) 1.00 1.00 Urban 1.68 (1.61–1.76) 1.24 (1.18–1.30) Elixhauser Comorbidity Index score 0 (reference) 1.00 1.00 1–3 0.88 (0.85–0.92) 0.90 (0.87–0.94) 4–8 0.76 (0.61–0.94) 0.79 (0.63–0.98) Hospital volume Low (reference) 1.0 1.00 High 2.44 (2.35–2.54) 2.04 (1.96–2.13) Surgeon volume Low (reference) 1.00 1.00 High 1.65 (1.59–1.71) 1.29 (1.24–1.35) Resection type Right (reference) 1.00 1.00 Left 0.97 (0.93–1.01) 0.91 (0.87–0.95) Anterior 0.75 (0.70–0.81) 0.58 (0.55–0.62) Other 0.66 (0.63–0.70) 0.71 (0.66–0.76) Note: CI = confidence interval, OR = odds ratio.
↵* Adjusted for all other variables included in the model in multivariate analysis.
In this issue

Article tools


