


Abstract
Background The incidence of hepatocellular carcinoma (HCC) is increasing and survival rates are poor. Our objectives were to estimate the relative survival over time in patients with HCC in Ontario and to examine potential factors associated with excess mortality risk.
Methods We performed a population-based retrospective cohort analysis involving patients with a diagnosis of HCC in Ontario between 1990 and 2009 using data extracted from the Ontario Cancer Registry. Relative survival was estimated by controlling for background mortality using expected mortality from Ontario life tables. A generalized linear model was used to estimate the excess mortality risk for important factors.
Results A total of 5645 patients had HCC diagnosed during the study period; 4412 (78.2%) of these patients were male. Improvements in 1-year relative survival were observed across all age groups over time: the highest was among those patients less than 60 years of age who had a diagnosis of HCC during 2005–2009, with 1-year relative survival exceeding 50% for both sexes. However, the overall 5-year relative survival did not exceed 28%. The excess mortality risk decreased with increased years of follow-up, recent diagnosis, and curative or noncurative treatments for HCC, whereas excess mortality risk increased with age.
Interpretation Although improving, the prognosis for HCC remains poor. Our findings highlight the importance of effective prevention and treatment for HCC to reduce the burden of disease and improve health care systems.
Liver cancer is the sixth most common cancer and third most frequent cause of cancer-related death worldwide.1 Hepatocellular carcinoma (HCC) represents more than 80% of primary liver cancers and is an increasing public health concern.2 It is one of the fastest rising cancers diagnosed in Canada,3–5 with incidence rates increasing in both females (2.2%/yr) and males (3.4%/yr) over the past 30 years.3,4 Although screening and treatment options for HCC have advanced, most patients are not treated early,6 with treatment often starting at advanced stages of disease.7 Survival after HCC diagnosis is poor, with a 5-year survival estimate of about 7%.7 However, studies have shown that with early diagnosis and treatment, 5-year survival can be improved by more than 50%.8–19
Cancer survival estimates are often complicated by other causes of mortality. Identifying definitive cancer-associated mortality can be challenging and relies on accurate information regarding patient cause of death.20,21 The issue is further confounded by the question of whether treatment-associated mortality should be attributable to the disease, which is often not addressed with mortality estimates.
One solution is the use of relative survival methodology, which focuses on the population burden of mortality from a specific cancer by comparing survival among patients with a cancer diagnosis with an otherwise similar general population known not to have cancer.20–24The advantage of this methodology is that mortality that is both directly and indirectly attributable to cancer can be accounted for.20–22Relative survival analysis is useful for identifying the extent to which advances in cancer treatments have impacted the disease at the population level, because it places changes in survival in the context of population-level change.25 The objectives of this study were to estimate the relative survival of patients with a diagnosis of HCC in Ontario over a 20-year period and to examine potential factors associated with excess mortality risk.
Methods
Study design and population
We conducted a population-based retrospective cohort study of all eligible patients aged 18 years and older who received a diagnosis of HCC in Ontario between Jan. 1, 1990, and Dec. 31, 2009. The Ontario Cancer Registry26 was used to create the study cohort. Computerized linkage,27 the capture–recapture method28 and case-resolution systems29,30 were used previously to estimate the completeness and accuracy of multiple data elements in the Ontario Cancer Registry31 and to validate the capture of all primary sites using ICD codes.29 The Ontario Cancer Registry captures about 95% of all cancer diagnoses in Ontario and has been shown to be both accurate and reliable.27–30 The International Classification of Diseases, 9th Revision (ICD-9) site code 155.0 was used to identify primary hepatic neoplasms in addition to the International Classification of Diseases for Oncology, Third Edition (ICD-O-3) histology codes 8170–8175. Patients with HCC were followed from the date of their diagnosis to the date of their death or until the end of the study period (Dec. 31, 2009). Patients were excluded if HCC was diagnosed on the same day they died.
Ethics approval for the study was granted by the University of Toronto Health Sciences Research Ethics Board.
Outcome measure
The primary outcome measure was the relative survival of HCC patients, which is the ratio of survival in patients with a diagnosis of HCC (i.e., observed survival) to the survival of the general population of Ontario (i.e., expected survival) accounting for background mortality.20,21 The secondary outcome was the relative excess hazard ratio (HR) for mortality (i.e., excess mortality risk) to examine the impact of potential prognostic factors.
Sources of data
The Ontario Cancer Registry includes information on age at diagnosis, sex, date of diagnosis, cause of death and date of death. Data for date of HCC diagnosis and date of death from the Ontario Cancer Registry were used to calculate the length of survival after diagnosis. The cancer registry cohort was linked to the Discharge Abstract Database32 of the Canadian Institute for Health Information to assign each person a baseline Charlson–Deyo comorbidity index. Where possible, hospitalization records from the date of diagnosis were used. If cases did not have a hospitalization record at diagnosis date, we determined baseline comorbidity by looking back 2 years into the hospitalization data to find the most recent hospitalization record and applying the comorbidity score from that hospitalization.33,34 Patients were assigned as having a missing Charlson–Deyo comorbidity index at baseline if they had no hospitalization records at diagnosis or 2 years before diagnosis.
Variable selection
The Charlson–Deyo comorbidity index was calculated using methods previously described;35,36 an ICD-9 coding algorithm was applied to the diagnostic field codes from the hospitalization data (excluding diagnoses for liver disease and metastatic cancer). Conditions were weighted and then summed up to provide an overall comorbidity index value for a given episode, which was then categorized into 1 of 5 groups (0, 1, 2, ≥ 3 or no hospitalization record) representing different degrees of comorbidity. Comorbidity was adjusted for each admission to hospital after baseline. The HCC treatments considered were potentially curative treatment (i.e., liver resection, liver transplant or radiofrequency ablation), noncurative treatment (i.e., chemotherapy or transarterial chemoembolization), palliative care and no treatment. We used these definitions of comorbidity and HCC treatments in previous studies.33,34 The codes used to identify HCC treatments can be found in Appendix 1 (Table A1; available at www.cmajopen.ca/content/3/2/E208/suppl/DC1).
Statistical analysis
Relative survival analysis
Survival was calculated from the date of HCC diagnosis to the earliest of either the date of death or the end of the study period. Relative survival estimates for 1- and 5-year survival, by year of diagnosis, age at diagnosis and sex were estimated by comparing the observed survival of patients with a diagnosis of HCC to that expected in the general population of Ontario using the methodology described previously.22 Expected survival was calculated using the life tables for the general population of Ontario matched by sex, age and calendar year of the cancer patients involved in the study using the Ederer II method37 — considering the matched patients to be at risk until the corresponding patient with cancer died or was censored. Survival estimates were calculated as a ratio, expressed as a percentage and considered statistically significantly different if the 95% confidence intervals (CIs) did not overlap.
A period analysis approach was also used to estimate 5-year relative survival for those patients given a diagnosis in 2005–2009 and those who were given a diagnosis earlier (e.g., 2000–2004) but were still alive on Jan. 1, 2005. Conditional survival probabilities in each follow-up interval from the most recent follow-up data (2005–2009) were combined to produce 5-year cumulative survival estimates for 2005–2009. This approach gives more weight pertaining to the most recent diagnosis in patients and follow-up periods that have better survival.38–40
Regression modelling of relative survival
We used a generalized linear model with a Poisson error structure to estimate the adjusted effect of the potential prognostic covariates (year of diagnosis, follow-up year after diagnosis, age at diagnosis, sex, Charlson–Deyo comorbidity index and HCC treatments) on the relative excess mortality risk.22 The hazard function at any given time after diagnosis was modelled as the sum of the expected hazard from the general population (Ontario life tables) and the excess hazard from an HCC diagnosis. Hazards were assumed to be piecewise constant hazards for each year. Survival data were collapsed to allow for standard regression diagnostics to be performed. A p value of < 0.05 was considered statistically significant. Interactions were considered between age at diagnosis and sex, year of diagnosis, follow-up after diagnosis, Charlson–Deyo comorbidity index and HCC treatments to allow changes in excess hazard after diagnosis to vary across age groups. The interactions between age at diagnosis and sex, year of diagnosis and palliative care were found to be significant and were used in the model. We evaluated the model goodness of fit using the deviance statistic, with a reasonable fit considered to be the value divided by the degrees of freedom close to 1 (> 0.85 and < 1.5).
Results
Of 60 018 adult patients registered in the Ontario Cancer Registry from 1990 to 2009, 5645 were given a diagnosis of primary HCC and contributed 10 255 total, 1.82 mean and 0.74 median person-years of follow-up time. Other patient characteristics are summarized in Table 1. Most of the patients were male (n = 4412). Among female patients, most diagnoses occurred among those aged 70 years and older, (n = 568) and in male patients the most common age at diagnosis was less than 60 years old (n = 1580). Table 2 provides a summary of the number of patients with HCC by year of diagnosis, sex and age at diagnosis. The number of cases diagnosed between 2005 and 2009 (n = 2297) was 3 times the number of cases diagnosed between 1990 and 1994 (n = 718).
Relative survival
The estimates for 1-year and 5-year relative survival after HCC diagnosis are shown in Table 2. For both sexes, the 1-year relative survival improved for all age groups between the periods 1990–1994 and 2005–2009. The 5-year relative survival improved significantly between the periods 1990–1994 and 2000–2004 (Figure 1). Although the 5-year survival continued to improve between the periods 2000–2004 and 2005–2009, this improvement was not statistically significant.
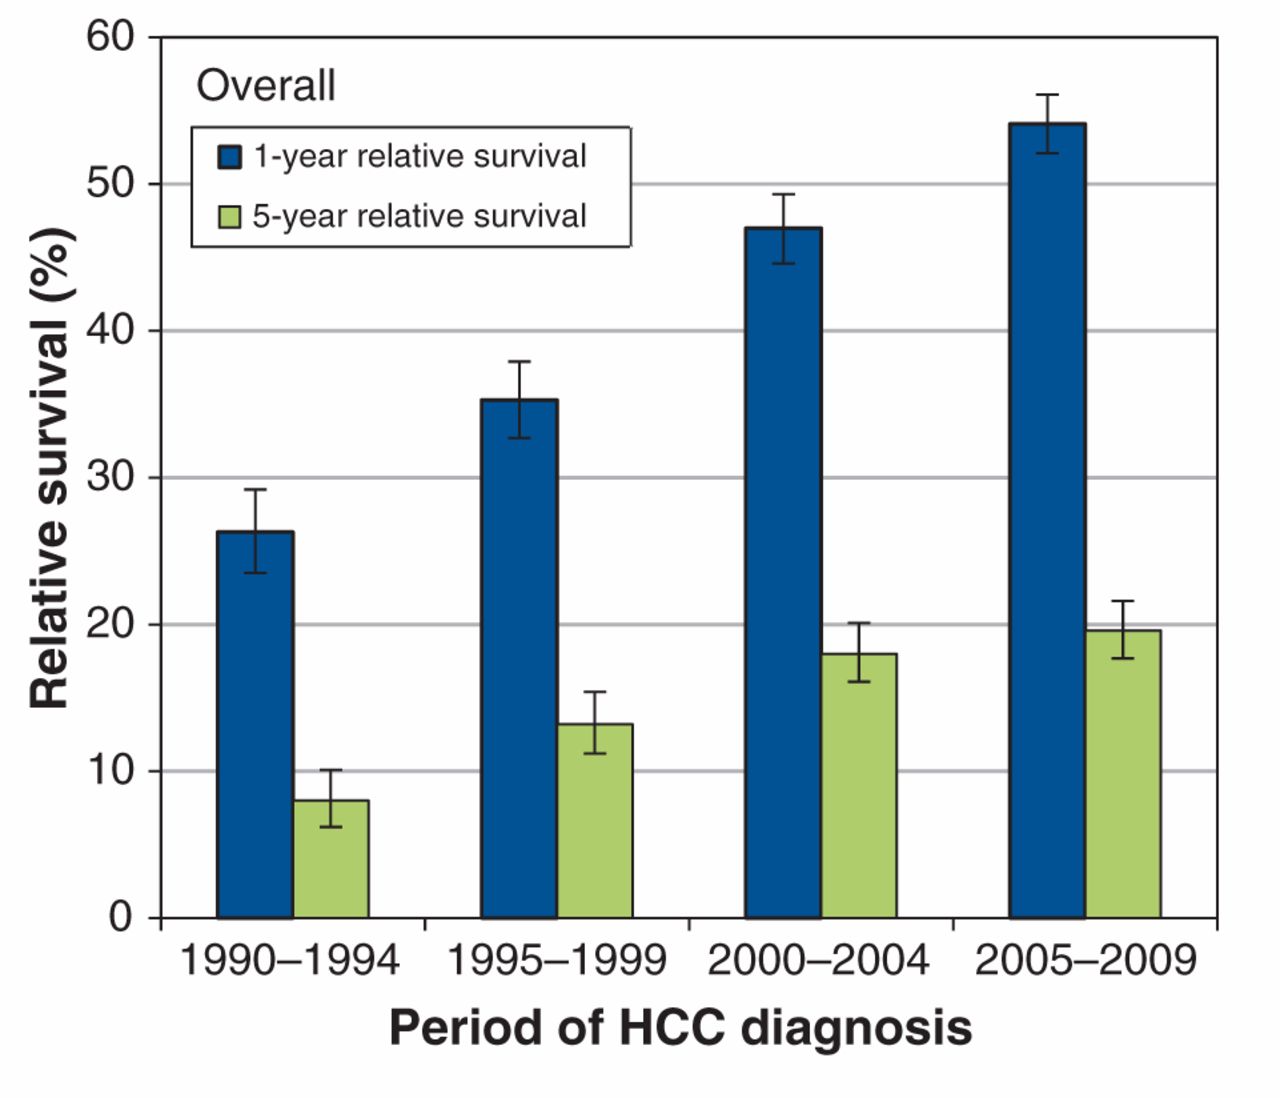
Overall age-standardized 1- and 5-year relative survival trends (1995–2009) in patients with hepatocellular carcinoma (HCC) in Ontario.
Figure 2 shows age-standardized survival trends, by sex. The 1-year relative survival in female patients was not greater than the 1-year relative survival in male patients (Figure 2). The highest 1-year survival in female patients was 70.9% (95% confidence interval [CI] 62.2%–78.0%) compared with 56.9% (95% CI 53.2–60.5%) for male patients, both of which corresponded to patients given a diagnosis before 60 years of age during 2005–2009 (Table 2).

Age-standardized (A) 1- and (B) 5-year relative survival trends (1995–2009) in patients with hepatocellular carcinoma (HCC) in Ontario, by sex.
During 1990–1994, female patients given a diagnosis before 60 years of age had a higher 5-year relative survival of 17.4% (95% CI 9.5%–27.5%) compared with male patients (7.1%, 95% CI 3.8%–11.8%) (Table 2). Over time, the 5-year survival for male patients given a diagnosis before 60 years of age improved; in addition, there were improvements in the 5-year survival in patients given a diagnosis at ages 60–69 and 70–79 years in 2005–2009 when compared with their 5-year survival in 1990–1994. For female patients, 5-year survival improved in those given a diagnosis at age 80 years or older in 1995–1999, 2000–2004 and 2005–2009 when compared with their 5-year survival in 1990–1994. Because CIs across all age groups in male and female patients overlapped, there were no differences in the relative survival estimates between the cohort and period analyses for 2005–2009 (Figure 3) and between male and female patients. Overall, the 5-year relative survival did not exceed 28% for either sex. Additional 10-year relative survival curves for HCC by period of diagnosis and sex are shown in Appendix 2 (Figure A1; available at www.cmajopen.ca/content/3/2/E208/suppl/DC1).
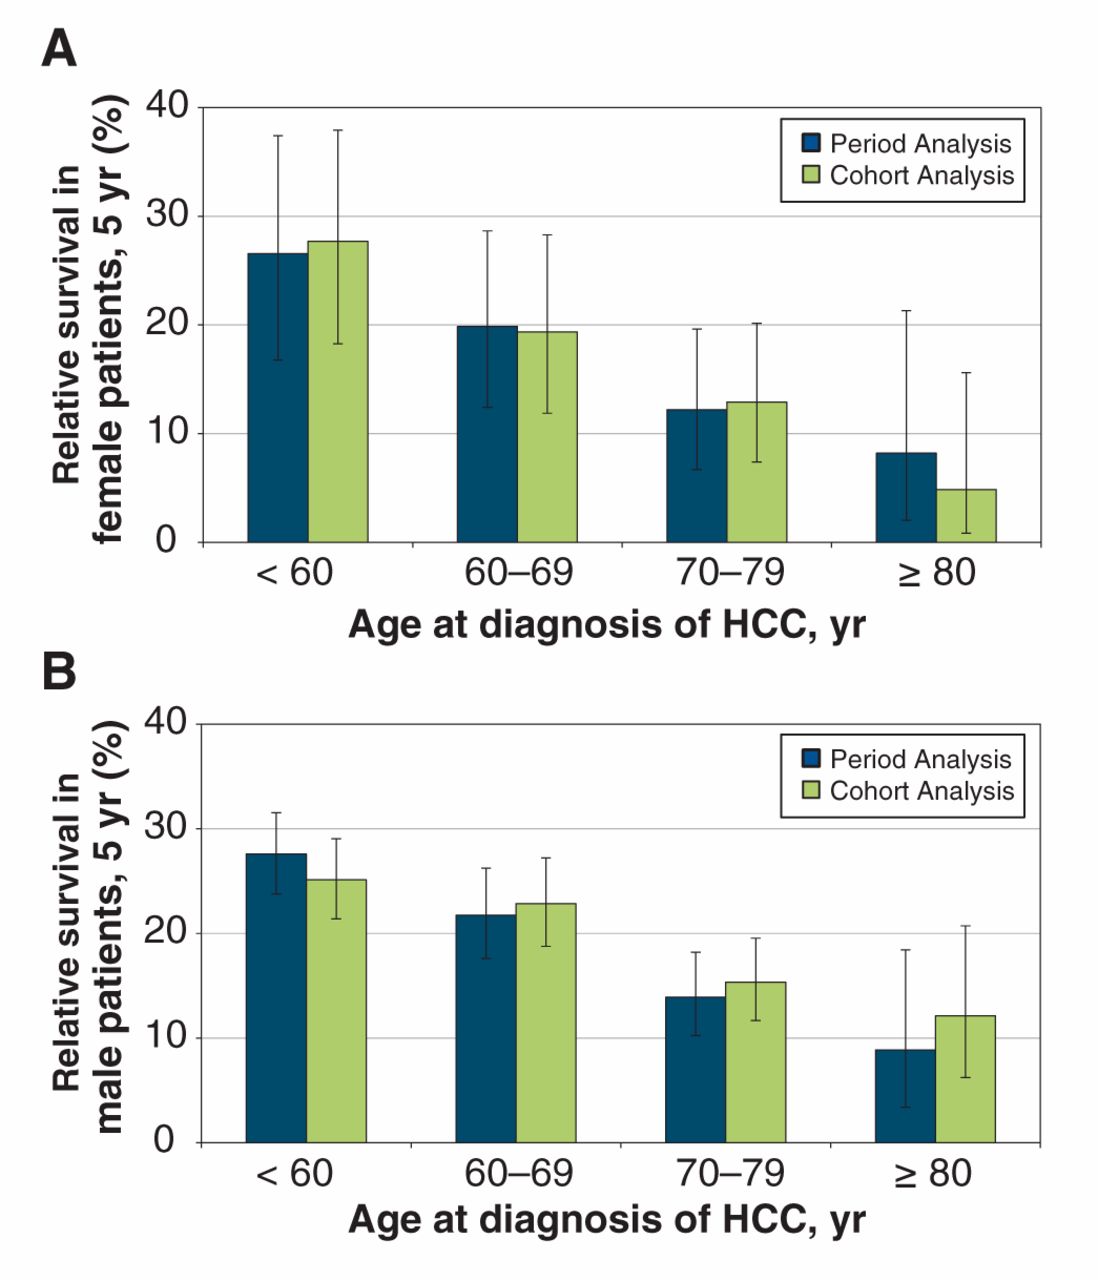
Age-standardized 5-year relative survival (2005–2009) in (A) female and (B) male patients with hepatocellular carcinoma (HCC) in Ontario: period analysis versus cohort analysis, by sex and age at diagnosis.
Relative excess hazard ratios for mortality
Model 1 (Table 3) shows the adjusted effect of the prognostic covariates on the relative excess mortality risk and Model 2 (Table 4) shows the same covariates but with the interaction terms. For Model 1, all covariates were significant (p < 0.001) except sex (p = 0.433) and age at diagnosis (overall p = 0.08). Study periods after 1990–1994 were associated with a protective relative excess mortality risk, indicating decreased risk over time compared with 1990–1994; follow-ups that occurred more than 1 year after diagnosis were significantly associated with a decreased risk compared with follow-ups that occurred within 1 year after diagnosis; and HCC treatments (curative and noncurative) were associated with a decreased risk. Palliative care and no treatment were associated with an increased relative excess mortality risk. Charlson–Deyo comorbidity index values greater than 1 were associated with a protective relative risk of mortality, which may indicate that the patients lived longer and thereby accumulated a greater maximal comorbidity score.33
In Model 2 (Table 4), interactions between age at diagnosis and sex (overall p = 0.009), year of diagnosis (overall p = 0.003) and palliative care (overall p < 0.001) were found to be significant using the likelihood ratio type 3 analysis, and all covariates except sex were also significant. Like Model 1 (Table 3), study periods after 1990–1994, follow-ups that occurred more than 1 year after diagnosis, and curative and noncurative treatments were significantly associated with a protective relative excess mortality risk. For both sexes, diagnosis at age 70 years or older was associated with an increased relative excess mortality risk compared with patients given a diagnosis before 60 years of age.
Interpretation
This study attempted to estimate the relative survival of patients with a diagnosis of HCC between 1990 and 2009 in Ontario. The results showed that 1-year relative survival improved by 2005–2009, when the period of 1990–1994 was used as a reference. One-year survival was highest among patients given a diagnosis before 60 years of age for the period 2005–2009, with 1-year survival exceeding 50% for both sexes. Improvements in 5-year relative survival were minimal: males given a diagnosis at ages 60–69 and 70–79 years were the only groups to have improved 5-year relative survival. The 5-year relative survival in both sexes never exceeded 28%.
Estimating the impact of common covariates on the relative excess mortality risk was the other aim of this study. A long-term follow-up after diagnosis and curative treatment were significantly associated with the most protective relative excess mortality risk. Being given a diagnosis at a later age was significantly associated with an increased relative excess mortality risk. Poorer survival among older patients may have been due to the presence of higher levels of comorbidity and greater numbers of chronic conditions that can reduce the tolerance of cancer treatments. These patients may be less likely to be referred to specialist care, which may affect treatment choices. Because they are advanced in age, older patients may also receive less aggressive treatment, independent of comorbidity.41,42
We compared our estimates for 5-year relative survival with those reported for primary liver cancer in Canada by the Canadian Cancer Society for 2006–2008.5 We found that our estimates for 5-year relative survival in both sexes aged 80 years or older in Ontario were slightly higher: Canadian Cancer Society estimates for 5-year relative survival in female patients given a diagnosis at ages 60–69, 70–79 and 80–99 years were 21.0% (95% CI 15.0%–28.0%), 12.0% (95% CI 7.0%–18.0%) and 7.0% (95% CI 3.0%–13.0%), respectively; estimates for 5-year relative survival in male patients given a diagnosis at ages 60–69, 70–79 and 80–99 years were 22.0% (95% CI 18.0%–26.0%), 16.0% (95% CI 12%–19.0%) and 6.0% (95% CI 3.0%–11.0%), respectively.5 These divergences may be attributable to differences in the data sources and the different time periods used. In addition, the estimates made by the Canadian Cancer Society were done using data from the Canadian Cancer Registry and the Canadian Vital Statistics Death database.5 Canadian Cancer Society estimates accounted for all cases in Canada (except Quebec), whereas our analysis was limited to cases in Ontario.
Our study is particularly relevant when considering the 5-year relative survival in patients with cancers in Canada. For example, a recent global surveillance study of cancer survival43 reported estimates for the 5-year, age-standardized net survival in adults with 10 common cancers, including stomach, colon, rectum, liver, lung, breast, cervix, ovary, prostate and leukemia. Reported estimates for 5-year survival in adults with colon, liver, stomach and prostate cancers in Ontario increased between 1995–1999 and 2005–2009; 5-year survival in adults with liver cancer in Ontario was as follows: 1995–1999 (16.1%, 95% CI 14.3%–18.0%), 2000–2004 (21.2%, 95% CI 19.4%–22.9%) and 2005–2009 (24.3%, 95% CI 22.6%–26.0%).43 Additionally, the 5-year survival in adults with liver cancer in Ontario was higher than in other Canadian provinces for each calendar period of diagnosis.43
Limitations
There are some limitations in the data used in this study. First, data from the Ontario Cancer Registry only included cancer staging subcategorization from 2004 onward; however, more complete data for cancer staging was available only in recent years. Therefore, we did not include cancer staging in this study. This is an important limitation because successful treatment of HCC is dependent on the stage at which treatment is initiated.44 Second, infection due to hepatitis B and C viruses was not considered in this analysis because of the lack of data. Both are main risk factors for developing HCC worldwide, responsible for up to 70%–80% of HCC cases. In North America and Europe, hepatitis C virus infection is the main risk factor for HCC.45 Third, behavioural factors that impact disease course and treatment decisions,4,46 such as alcohol use and body mass index, were not accounted for.47 Finally, a small sample size and limited observations may lead to unstable survival estimates for the age at diagnosis group of patients given a diagnosis at age 70 years and older. We performed a sensitivity analysis to estimate relative survival using a merged group of patients given a diagnosis at ages 70–79 and 80 years and older; however, there were no significant differences from the initial results (Appendix 1, Table A2).
Conclusion
This study shows that although survival in patients with HCC has improved, the prognosis for HCC remains poor. The modest improvement in HCC survival over the past two decades may be related to earlier detection and treatment. Investments may be best directed toward early detection through screening and surveillance efforts.
Supplemental information
For reviewer comments and the original submission of this manuscript, please see www.cmajopen.ca/content/3/2/E208/suppl/DC1
Acknowledgments
The authors thank Matthew Kumar, Nelson Chong and Refik Saskin from the ICES for conducting the data linkage. The authors are also grateful to Katrina Chan from OICR and CCO for administrative insight and assistance in data acquisition.
Footnotes
Competing interests: None declared.
Contributors: Hla-Hla Thein contributed to the study concept and design, obtained data, conducted and supervised the statistical analysis and wrote the manuscript. Edwin Khoo designed and conducted the statistical analysis and wrote the manuscript. Michael Campitelli assisted with the initial statistical analysis. Ahmad Zaheen, Prithwish De and Craig Earle revised the manuscript. Qilong Yi assisted with the statistical analysis plan. Craig Earle assisted in obtaining data. All of the authors interpreted the results, approved the final version to be published and agreed to act as guarantors of the work.
Funding: This study was supported by data provided through the Institute for Clinical Evaluative Sciences (ICES) and Cancer Care Ontario (CCO) and through funding support to ICES from an annual grant by the Ministry of Health and Long-Term Care (MOHLTC) and the Ontario Institute for Cancer Research (OICR). The opinions, results and conclusions reported in this paper are those of the authors and are independent from the funding sources. No endorsement by ICES, CCO, OICR or the Government of Ontario is intended or should be inferred. Hla-Hla Thein received a New Investigator Award from the Ontario Institute for Cancer Research Health Services Research Program at the Dalla Lana School of Public Health, University of Toronto.
References
- © 2015, 8872147 Canada Inc. or its licensors
In this issue

Article tools


Related Articles
Cited By...
- No citing articles found.