


Article Figures & Tables
Figures
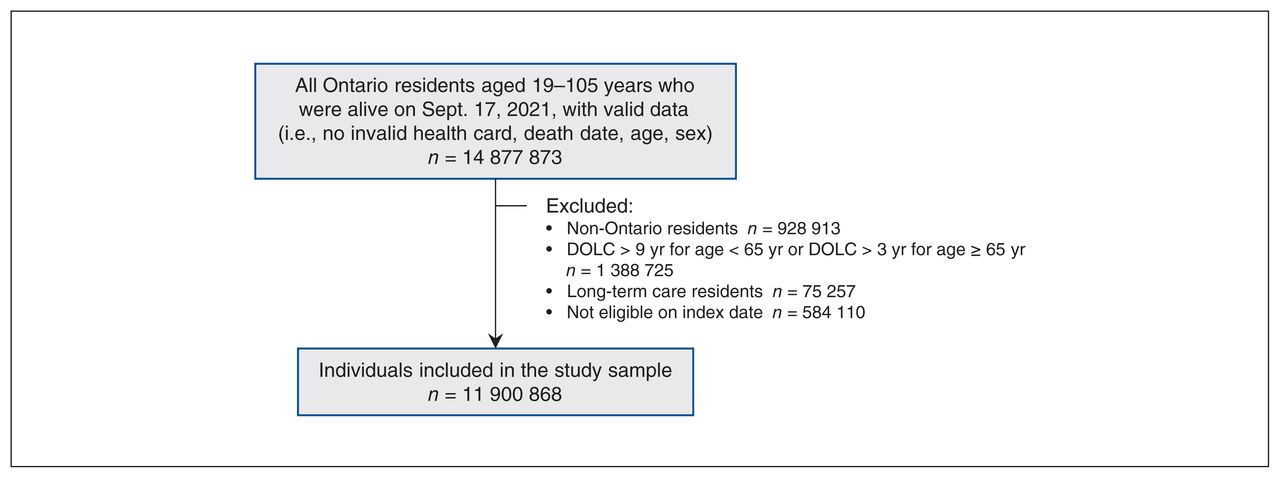
- Figure 1:
Study flow chart. Note: DOLC = date of last contact.
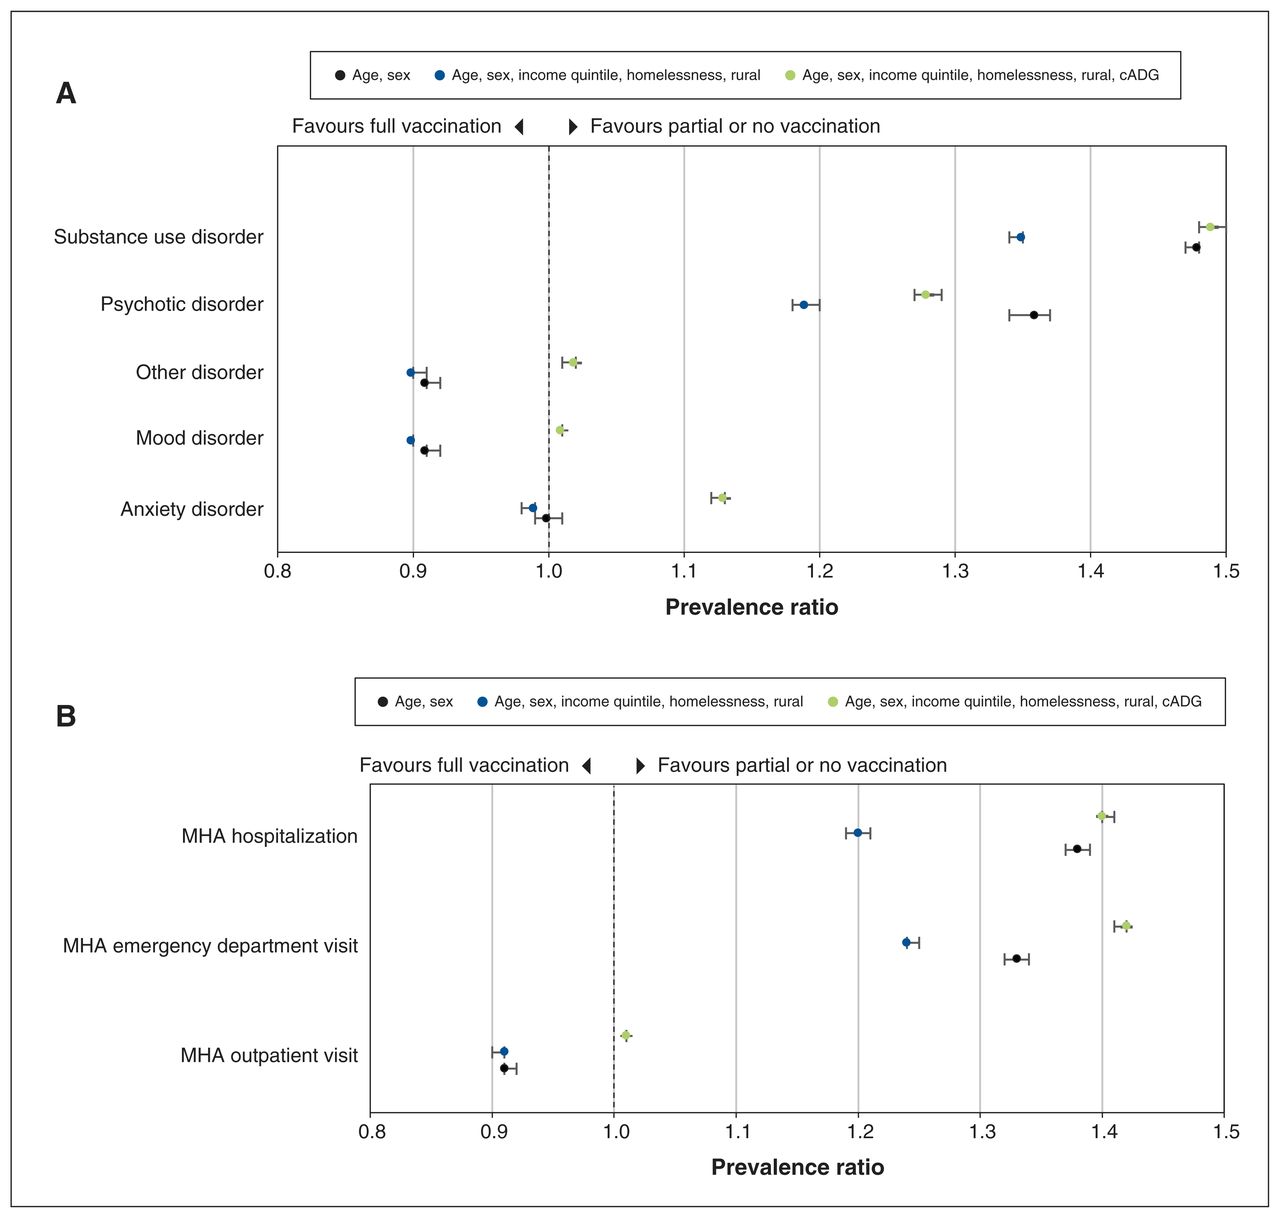
- Figure 2:
Relative prevalence* of partial and no vaccination by (A) diagnostic category and (B) mental health and addiction (MHA) severity. *Relative prevalence estimated using modified Poisson regression models, with no mental health disorders as the reference category. Note: cADG = collapsed Aggregated Diagnosis Group.
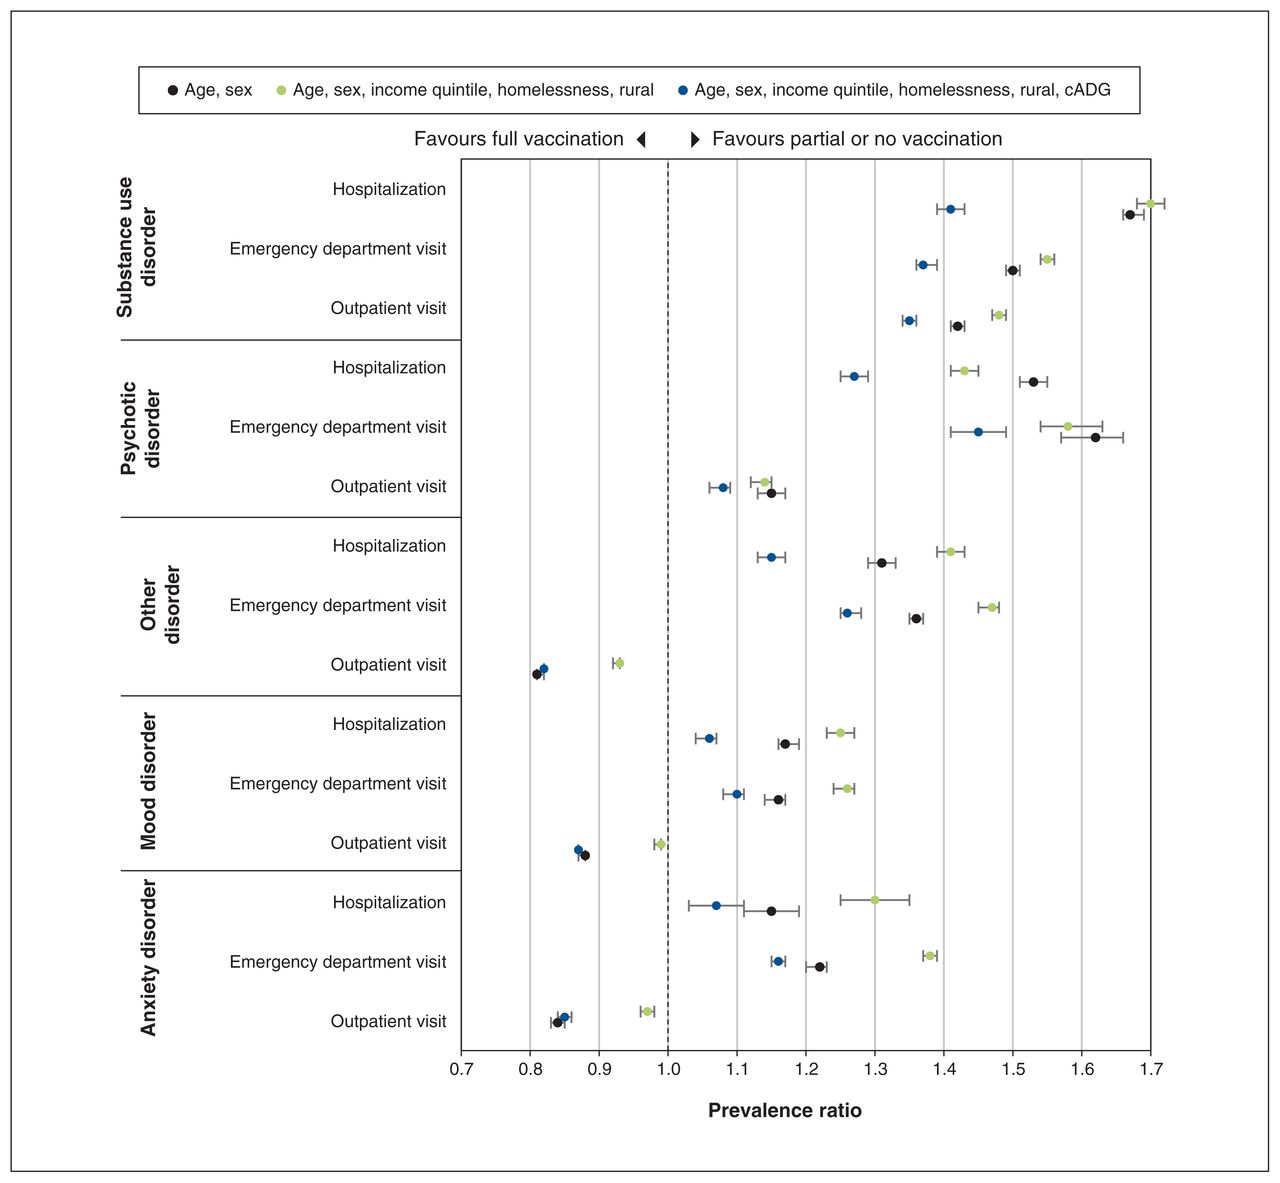
- Figure 3:
Relative prevalence* of partial and no vaccination by mental health and addiction diagnosis, stratified by health service utilization severity. *Relative prevalence estimated using modified Poisson regression models, with no mental health disorders as the reference category. Note: cADG = collapsed Aggregated Diagnosis Group.
Tables
- Table 1:
Modified Poisson regression models assessing the association between mental health and addictions service use history and the prevalence of partial or no vaccination against SARS-CoV-2 in Ontario, Canada
Variable Prevalence ratio (95% CI) Age and sex adjusted Age, sex, rurality, SES and homelessness adjusted Fully adjusted* MHA diagnosis (Ref. for all disorders: no MHA diagnosis) Anxiety disorder 1.00 (0.99–1.01) 0.99 (0.98–0.99) 1.13 (1.12–1.13) Mood disorder 0.91 (0.91–0.92) 0.90 (0.90–0.90) 1.01 (1.01–1.01) Other disorder 0.91 (0.91–0.92) 0.90 (0.90–0.91) 1.02 (1.01–1.02) Psychotic disorder 1.36 (1.34–1.37) 1.19 (1.18–1.20) 1.28 (1.27–1.29) Substance use disorder 1.48 (1.47–1.48) 1.35 (1.34–1.35) 1.49 (1.48–1.50) Age, yr (Ref. for all age groups: 18–29 yr) 30–39 1.00 (1.00–1.00) 1.00 (1.00–1.00) 1.04 (1.04–1.04) 40–49 0.78 (0.78–0.78) 0.79 (0.79–0.80) 0.86 (0.86–0.86) 50–59 0.61 (0.61–0.62) 0.62 (0.62–0.63) 0.71 (0.71–0.72) 60–69 0.45 (0.45–0.45) 0.45 (0.45–0.46) 0.56 (0.56–0.56) 70–79 0.34 (0.33–0.34) 0.34 (0.34–0.34) 0.45 (0.45–0.46) ≥ 80 0.34 (0.34–0.35) 0.34 (0.34–0.34) 0.48 (0.47–0.48) Sex, male 1.14 (1.14–1.14) 1.14 (1.14–1.14) 1.03 (1.03–1.03) Rural residence 1.16 (1.16–1.17) 1.15 (1.14–1.15) Income quintile (Ref. for all income levels: income quintile 1 [lowest]) Quintile 2 0.86 (0.85–0.86) 0.86 (0.86–0.86) Quintile 3 0.78 (0.78–0.78) 0.79 (0.79–0.79) Quintile 4 0.72 (0.71–0.72) 0.73 (0.73–0.73) Quintile 5 (highest) 0.64 (0.64–0.64) 0.65 (0.65–0.65) Individuals who experienced homelessness 1.65 (1.63–1.66) 1.81 (1.80–1.83) cADGs 4–6 (Ref. for all levels: 0–3 cADGs) 0.64 (0.64–0.65) cADGs ≥ 6 0.53 (0.52–0.53) MHA severity (Ref. for all MHA severity: no MHA utilization) Outpatient visit 0.91 (0.91–0.92) 0.91 (0.90–0.91) 1.01 (1.01–1.01) Emergency department visit 1.33 (1.32–1.34) 1.24 (1.24–1.25) 1.42 (1.41–1.42) Hospital admission 1.38 (1.37–1.39) 1.20 (1.19–1.21) 1.40 (1.40–1.41) Age, yr (Ref. for all age groups: 18–29 yr) 30–39 1.02 (1.01–1.02) 1.01 (1.01–1.01) 1.05 (1.05–1.06) 40–49 0.80 (0.79–0.80) 0.81 (0.80–0.81) 0.87 (0.87–0.88) 50–59 0.63 (0.62–0.63) 0.64 (0.63–0.64) 0.73 (0.72–0.73) 60–69 0.46 (0.46–0.46) 0.46 (0.46–0.46) 0.57 (0.57–0.57) 70–79 0.34 (0.34–0.34) 0.34 (0.34–0.34) 0.46 (0.46–0.46) ≥ 80 0.35 (0.35–0.35) 0.35 (0.34–0.35) 0.49 (0.48–0.49) Sex, male 1.15 (1.15–1.15) 1.15 (1.15–1.15) 1.04 (1.04–1.04) Rural residence 1.16 (1.16–1.16) 1.14 (1.14–1.15) Income quintile (Ref. for all income levels: income quintile 1 [lowest]) Quintile 2 0.86 (0.85–0.86) 0.86 (0.86–0.86) Quintile 3 0.78 (0.78–0.78) 0.79 (0.79–0.79) Quintile 4 0.72 (0.71–0.72) 0.73 (0.73–0.73) Quintile 5 (highest) 0.64 (0.64–0.64) 0.65 (0.65–0.65) Individuals who experienced homelessness 1.63 (1.61–1.64) 1.73 (1.71–1.75) cADGs 4–6 (Ref. for all levels: 0–3 cADGs) 0.64 (0.64–0.64) cADGs ≥ 6 0.52 (0.52–0.52) Note: cADG = collapsed Aggregated Diagnosis Group, CI = confidence interval, MHA = mental health and addiction, Ref. = reference category, SES = socioeconomic status.
↵* Fully adjusted = all variables included in the model as shown here.
In this issue

Article tools


Related Articles
Cited By...
- No citing articles found.