


Abstract
Background: Previous research has shown that cocaine-associated deaths occur more frequently in hot weather, which has not been described for other illicit drugs or combinations of drugs. The study objective was to evaluate the relation between temperature and risk of death related to cocaine, opioids and amphetamines in British Columbia, Canada.
Methods: We extracted data on all deaths with cocaine, opioid or amphetamine toxicity recorded as an underlying or contributing cause from BC vital statistics for 1998–2017. We used a time-stratified case-crossover design to estimate the effect of temperature on the risk of death associated with acute drug toxicity during the warmer months (May through September). Odds ratios (ORs) and 95% confidence intervals (CIs) were estimated for each 10°C increase in the 2-day average maximum temperature at the residential location.
Results: We included 4913 deaths in the analyses. A 10°C increase in the 2-day average maximum temperature was associated with an OR of 1.43 (95% CI 1.11–1.86) for deaths with only cocaine toxicity recorded (n = 561), an OR of 1.15 (95% CI 0.99–1.33) for deaths with opioids only (n = 1682) and an OR of 1.11 (95% CI 0.60–2.04) for deaths with amphetamines only (n = 133). There were also elevated effects when toxicity from multiple drugs was recorded. Sensitivity analyses showed differences in the ORs by sex, by climatic region, and when the location of death was used instead of the location of residence.
Interpretation: Increasing temperatures were associated with higher odds of death due to drug toxicity, especially for cocaine alone and combined with other drugs. Targeted interventions are necessary to prevent death associated with toxic drug use during hot weather.
Psychoactive substances act on the brain to change mood, perception and behaviour, but differ in their mode of action and effects on the body. Some of these effects and their accompanying health risks can be exacerbated by environmental conditions. Both cocaine and amphetamines are psychostimulants that can increase dopamine levels in the brain.1 Cocaine use increases the risk of many life-threatening health outcomes, including convulsions, kidney failure, cardiovascular emergencies and brain hemorrhage.2 Cocaine also causes a hypermetabolic state that increases body temperature, and its associated health risks are higher during hot weather.2 Opioids affect multiple organ systems, including the central and peripheral nervous system.3 Opioids include legally prescribed analgesics such as codeine, oxycodone, hydrocodone, morphine, hydromorphone and fentanyl, as well as illicit drugs such as heroin. Strong prescription opioids such as morphine, oxycodone, hydromorphone and especially fentanyl and its derivatives carry a substantial risk of acute toxicity and fatal outcome if used inappropriately. There has been an ongoing crisis worldwide due to the entry of the synthetic opioids fentanyl and carfentanil into the illicit drug supply.4
Two ecologic studies in New York and 1 individual-level study in Quebec have reported that cocaine-associated deaths occur more frequently in hot weather.5–7 Broadly, 3 underlying mechanisms may explain this observation: increased heat production due to agitation and delirium and associated muscular activity; reduced heat dissipation due to central inhibition of sympathetic outflow to cutaneous vasodilatory and sudomotor function; and reduced sense of discomfort in the face of heat stress, which inhibits heat avoidance behaviours.2,8–11
Similarly, a small body of evidence has associated colder weather with a higher risk of opioid toxicity.5,6,12 Three proposed mechanisms may explain this observation: temperature-related exacerbation of respiratory depression associated with opioid use; increased pain associated with colder weather and therefore increased opioid use; and the social effects of colder weather, including being confined to an indoor environment and potentially stressful family interactions. Although opioid toxicity has not been previously associated with warmer weather, we include it in this study for 2 reasons. First, deaths from illicit drug toxicity have been declared a public health emergency in the province of British Columbia since April 2016.13 Most of these deaths have involved the synthetic opioid fentanyl, so it is important to understand the relation between opioid toxicity and hot weather from a public health perspective. Second, there is increasing use of drug mixtures,14 including stimulant-opioid combinations that have different effects than either drug alone.15–17 Inclusion of deaths involving opioid toxicity allowed us to examine the impact of heat on deaths involving 2- and 3-drug mixtures.
The objective of this study was to evaluate the relation between temperature and death associated with cocaine, opioid and amphetamine toxicity in BC, when present in the vital statistics death record, either alone or in combination, using a time-stratified case-crossover design. The effect of temperature on death due to drug toxicity has not been widely studied. It is of growing importance as the global climate continues to warm and the global drug toxicity crisis continues to escalate,18 especially since the COVID-19 pandemic.19
Methods
We used a time-stratified case-crossover design to describe the effect of temperature on deaths associated with cocaine, opioid and amphetamine toxicity. The case-crossover design was developed to study the immediate determinants of acuteonset disease (e.g., myocardial infarction) and to avoid selection and information bias.20 This method has been widely applied in analyses of risks of disease and death related to air pollution,21–24 temperature25–28 and adverse drug events.29,30 The case-crossover design is suited for acute outcomes caused by transient exposures. It can avoid confounding effects of factors that do not vary over the short term, such as sex, age, socioeconomic status, lifestyle, underlying comorbidities and seasonality.20 It also allows for the examination of effect modification by stratification.
To evaluate the association between the outcome and the exposure, we compared the temperature for the date of death (event date) with the values for similar dates on which the death did not occur (control dates). The control dates were selected with the time-stratified bidirectional referent approach, meaning that they were matched by day of week and calendar month to the death date for each individual. For example, a death that occurred on the second Tuesday in June would have its temperatures matched to those for the first, third, fourth and fifth (when applicable) Tuesdays in June. This approach results in 3–4 control dates for every event date. The bidirectional referent approach is less biased than selecting control dates from before the death only.22
Study area and period
British Columbia is the westernmost province in Canada, with a landmass covering 944 735 km2 and spanning 25 degrees of longitude and 11 degrees of latitude. The current population is about 5.2 million people, most of whom live in large urban areas on the coast. In previous work, we have divided BC into 4 climatic regions to show how these regions modify temperature effects in the province.31,32 The coastal region is typically temperate in summer, the dry plateau is hot and dry, the mountain region is highly variable and the north is cool. This study examines the relations between death from drug toxicity and temperature during the warmer months (May through September) of the 20-year period from 1998 to 2017.
Data sources
The BC Vital Statistics Agency makes data on deaths in BC available to the BC Centre for Disease Control for environmental health surveillance and assessment. The death records include the date of death, underlying and contributing causes, age, sex, 6-digit postal code of residence and 6-digit postal code of location of death (from 2004 onward only). The BC Vital Statistics Agency is responsible for translating information on certificates of death into International Statistical Classification of Diseases and Related Health Problems, 10th Revision (ICD-10) codes. In most cases, the certificate of death is submitted by a clinician. However, any unattended deaths, deaths in public places, unexpected deaths and deaths among children must be investigated by the BC Coroners Service. In these cases, including drug toxicity deaths, the certificate of death is submitted by the coroner. Death data for this study were extracted from the vital statistics database, as described in more detail below. Temperature data for this study were extracted from the weather data archives of Environment and Climate Change Canada33 and used as described below. These archives provide the geographic coordinates of each weather station, along with hourly measurements of air temperature and many other meteorological parameters.
Outcome: death associated with drug toxicity
We identified deaths associated with cocaine, opioid or amphetamine toxicity from the vital statistics data, on the basis of their ICD-10 codes. Deaths associated with drug use have an ICD-10 code starting with T (acute toxicity) or F (chronic use). Although coding practices differ across agencies, the BC Vital Statistics Agency uses the US National Vital Statistics System guidelines.34 It will use a T code only when a coroner’s certificate of death specifies known overdose, poisoning or toxicity due to a specific drug based on testing results. The same codes are used regardless of whether the drug was illicit or prescribed. All deaths from May to September in 1998–2017 with any T code for cocaine, opioid or amphetamine toxicity as a primary or secondary cause were included in the analyses.
Many deaths associated with acute drug toxicity also had an F code for chronic drug use as an underlying or contributing cause. The role of chronic drug use may be indicated on a clinician’s certificate of death or a coroner’s certificate of death based on patient history and contextual information.34 As a comparator, deaths with only an F code for chronic cocaine, opioid or amphetamine use were also examined. Deaths without a T code and with F codes for more than 1 of the 3 drugs were excluded from the comparative analyses.
Exposure: temperature
The complex topography of BC creates many microclimates, and there are clear differences in heat-related health risks across the province.32,35 All deaths in the analyses were geolocated based on the 6-digit postal code of residence, then matched to temperature measurements from the nearest Environment and Climate Change Canada weather station. We excluded deaths that were more than 50 km from the nearest station. The 2-day average of daily maximum temperatures was extracted for the death date and the matched control dates in the case-crossover study design. Time of death is not available in the vital statistics data, so we could not assess whether each death occurred before or after the hottest hours of the day. The 2-day average of maximum temperatures (e.g., date of death and previous date) was used to reflect the general temperatures around the time of death. We ran all primary models with the continuous values and a binary variable indicating whether the 2-day average was equal to or greater than the 90th percentile value for the station over the 20-year study period. The latter was done to reflect relatively hot weather, because absolute temperature distributions vary across different areas of the province.
Statistical analysis
All deaths with cocaine, opioid and amphetamine toxicity (T codes) were stratified into 1 of 7 groups based on the ICD-10 codes present in the vital statistics record: cocaine only, opioid only, amphetamine only, cocaine + opioid, cocaine + amphetamine, opioid + amphetamine, and all 3 drugs. We used conditional logistic regression to estimate the odds ratios (ORs) and confidence intervals (CIs) for the association between a 10°C increase in the 2-day average of maximum temperature and death among these groups.
Sensitivity and subgroup analyses
The location of residence and location of death are different for many decedents, and temperature at the location of death may provide a better assessment of exposure for drug toxicity deaths. However, information on the location of death was available only for vital statistic records from 2004 onward. We compared the effect of temperature at the location of residence with the effect of temperature at the location of death for the subset of cases for which both locations were available. Subgroup analyses were also conducted by sex and by climatic regions of the province (i.e., coast, dry plateau, mountain and north). Finally, we repeated analyses for deaths with only 1 chronic drug use (F code) and no acute toxicity (T code) present in the vital statistics record. Deaths with F codes for more than 1 drug were excluded. This was to better evaluate whether effects were associated with habitual drug use or acute toxicity. We used the R statistical computing environment version 3.5.1 for all data management, analysis and visualization.
Ethics approval
The British Columbia Centre for Disease Control is a public health agency with the mandate to perform applied analytics to support policy and practice in British Columbia under the Public Health Act.
Results
During the May to September months of 1998–2017, 4987 deaths in the BC vital statistics records were attributed to acute toxicity (T code) or chronic use (F code) of cocaine, opioids or amphetamines (Table 1). Of these, 54 (1.1%) deaths were excluded because residential postal code information was missing, the residence was out of province or the geographic coordinates could not be assigned. A further 20 (0.4%) deaths were excluded because there was no weather station with daily temperature data available within 50 km of the residential location, or temperature data were missing for the date of death or the previous day. Of the remaining 4913 deaths, 3774 had a code for acute drug toxicity (T code), including 561 (14.9%) for cocaine only, 1682 (44.6%) for opioids only, 133 (3.5%) for amphetamines only and 1398 (37.0%) with codes for more than 1 of the 3 drugs (Table 2), including 152 (3.1%) with all 3 drugs. The mean age at death was approximately 43 years, and 74.4% (n = 2791) of decedents were male. Most decedents (76.7%, n = 2906) lived in the coastal climatic area where the largest cities in BC are located (Tables 1 and 2). During the same period, 625 deaths had chronic cocaine use (F code) indicated without indication of chronic opioid or amphetamine use or any acute toxicity. There were 261 deaths that had only chronic opioid use and 101 that had only chronic amphetamine use (Table 2). There were small differences between the mean 2-day average of maximum temperatures on death dates and control dates across all 4 climatic regions (Table 3).
International Statistical Classification of Diseases and Related Health Problems, 10th Revision codes for deaths related to toxic (starting with T) and chronic (starting with F) use of cocaine, opioids and amphetamines*
Summary information for all deaths included in the main analyses, with 1 or more cocaine, opioid or amphetamine toxicity (T codes) present in the vital statistics record
Summary of May to September temperatures for all weather stations in each climatic region, and death dates and control dates used in the case-crossover study design
Primary analysis
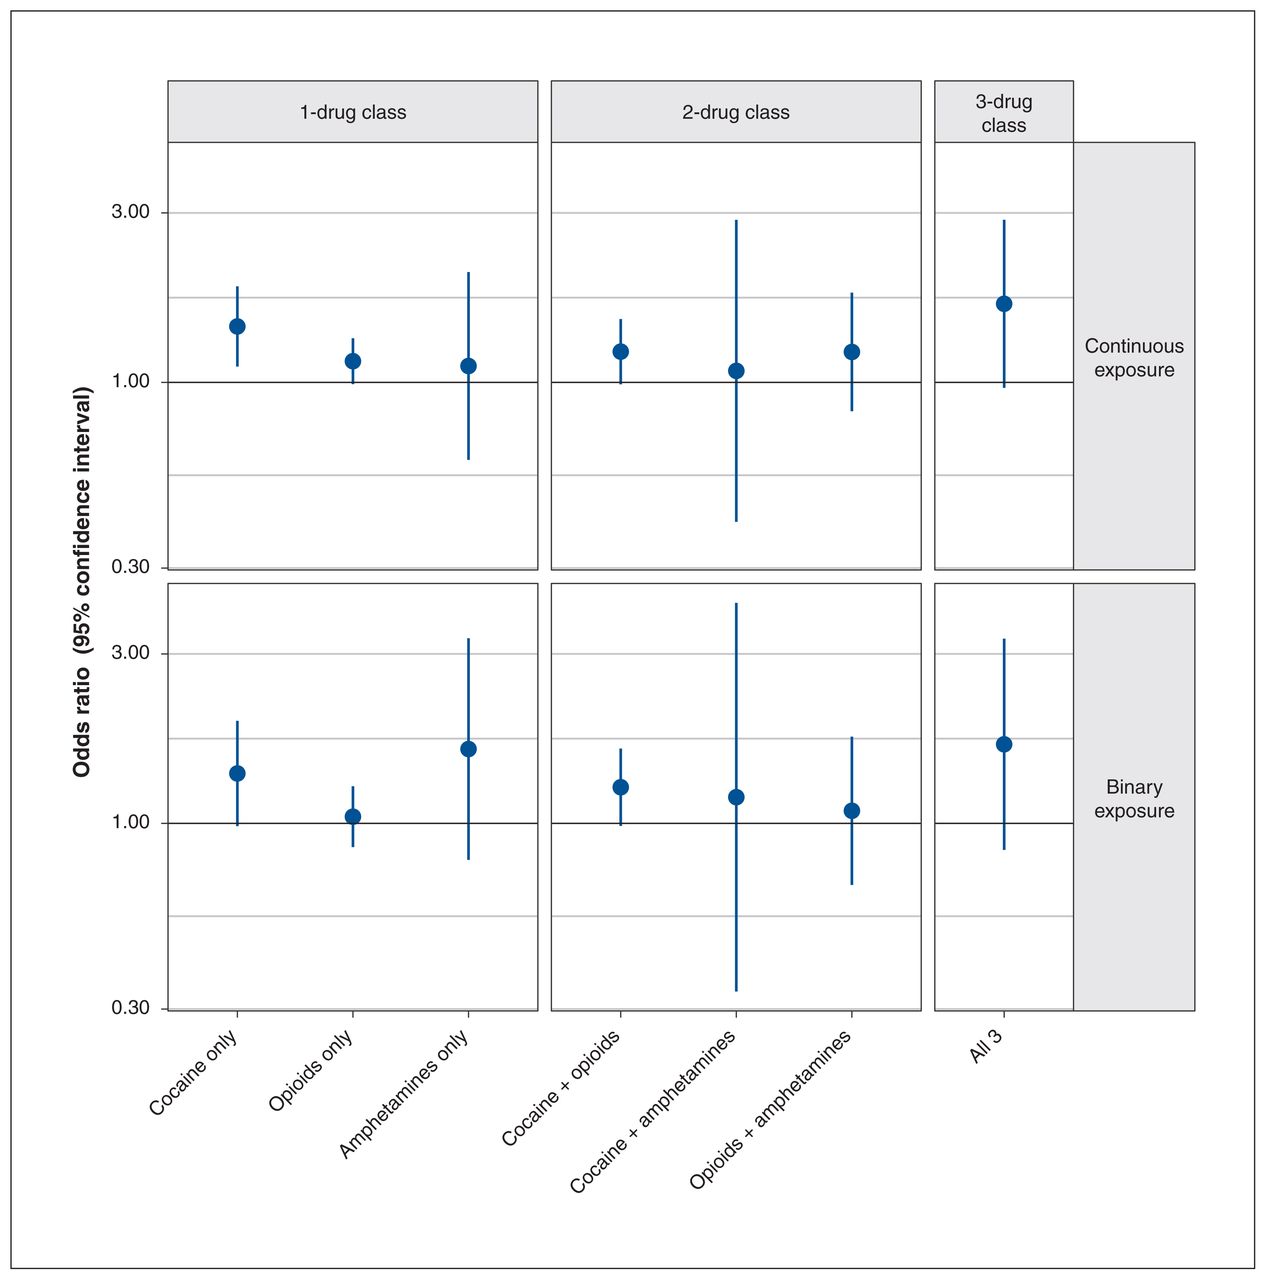
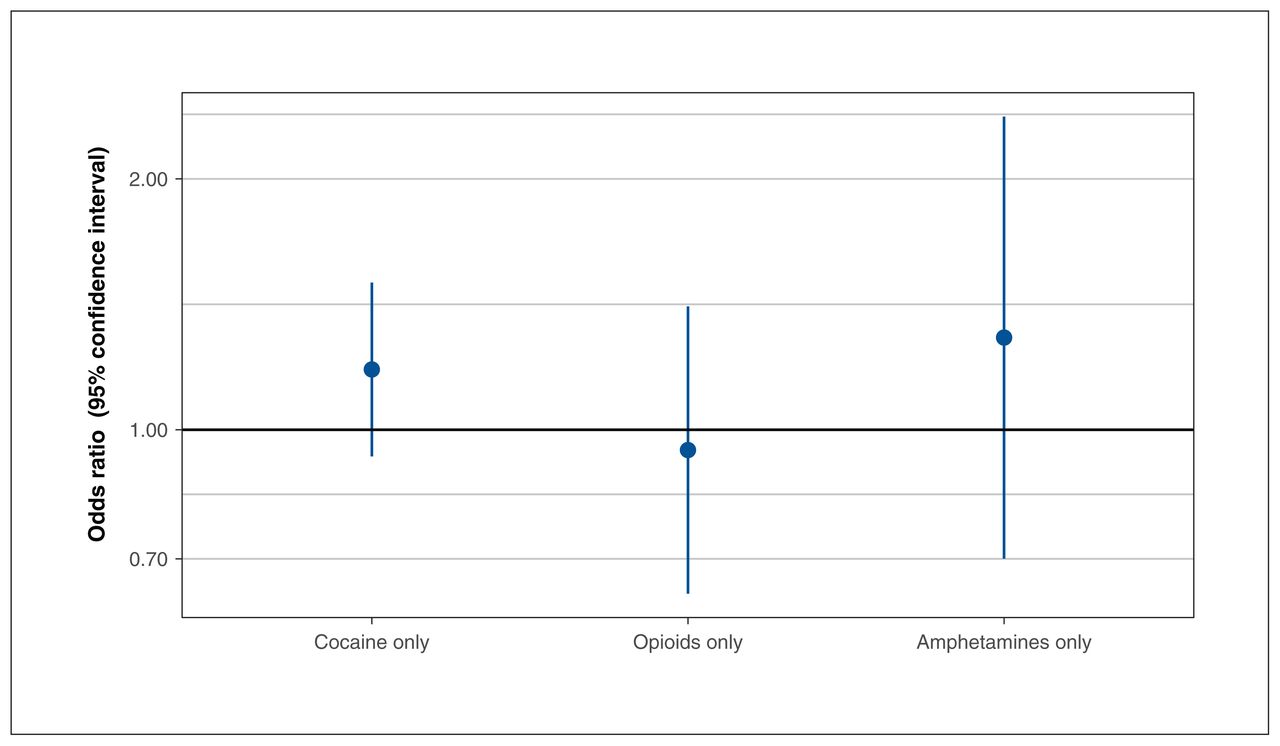
A 10°C increase in the 2-day average of maximum temperature was associated with increased odds of death for most of the 7 categories of drug combinations (Figure 1). The most elevated ORs were 1.43 (95% CI 1.11–1.86] for cocaine toxicity only, 1.15 (95% CI 0.99–1.33) for opioid toxicity only, 1.22 (95% CI 0.99–1.51) for combined cocaine and opioid toxicity, and 1.66 (95% CI 0.97–2.87) for all 3 drugs combined. The CIs were wider for all models that included deaths due to amphetamine toxicity because of the small numbers (Tables 1 and 2). The pattern of results was similar for the binary variable indicating whether the 2-day average of maximum temperature was over the 90th percentile. For example, the OR for cocaine toxicity only was 1.38 (95% CI 0.98–1.94). However, the OR for opioid toxicity alone was 1.04 (95% CI 0.86–1.27), and none of these estimates were significant (Figure 1). Continuous temperatures were used in all further analyses.

Odds ratios and confidence intervals for the effect of a 10°C increase in the 2-day average of maximum temperatures (continuous exposure, top) and temperatures over the 90th percentile (binary exposure, bottom) on death attributed to acute cocaine, opioid and amphetamine toxicity (T code). Daily maximum temperatures were measured at the weather station nearest to the residential location, within 50 km.
Sensitivity and subgroup analyses
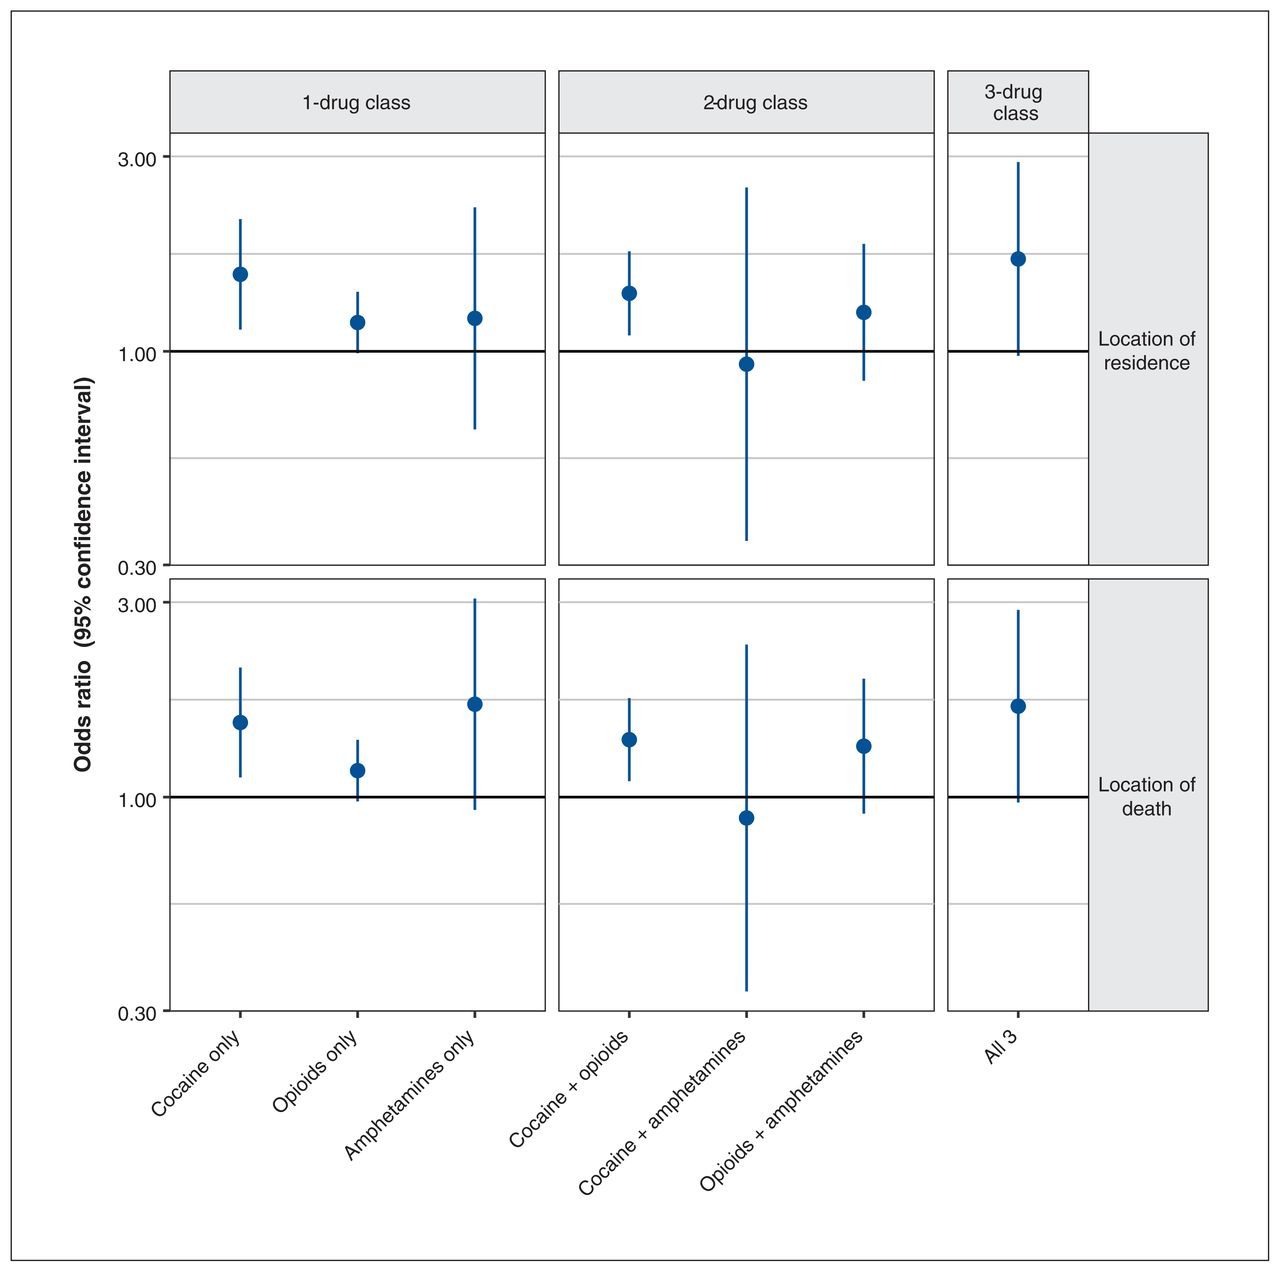
There were 2984 deaths from 2004 to 2017 with postal codes for the residence and location of death. Models comparing the effect of temperatures assigned by residential location with the effect of temperatures assigned by the location of death were similar (Figure 2) and consistent with the primary results (Figure 1). However, the OR for combined cocaine and opioid toxicity was significant in these models. Subset analyses by sex showed that risks were similar for both groups (Figure 3). Subset analyses by climatic region showed that the ORs were most elevated for deaths due to cocaine and opioid toxicity in the mountain region. They were also elevated in the coastal and dry plateau regions. Effects were null in the north, and there were insufficient data to support robust stratified analyses for amphetamines (Figure 4).

Odds ratios and confidence intervals for the effect of a 10°C increase in the 2-day average of maximum temperatures on death attributed to acute cocaine, opioid and amphetamine toxicity (T code). Analyses were restricted to deaths from 2004 to 2017, for which a location of death postal code was available. Daily maximum temperatures were measured at the weather station nearest the residential location (top) or the location of death (bottom) within 50 km.
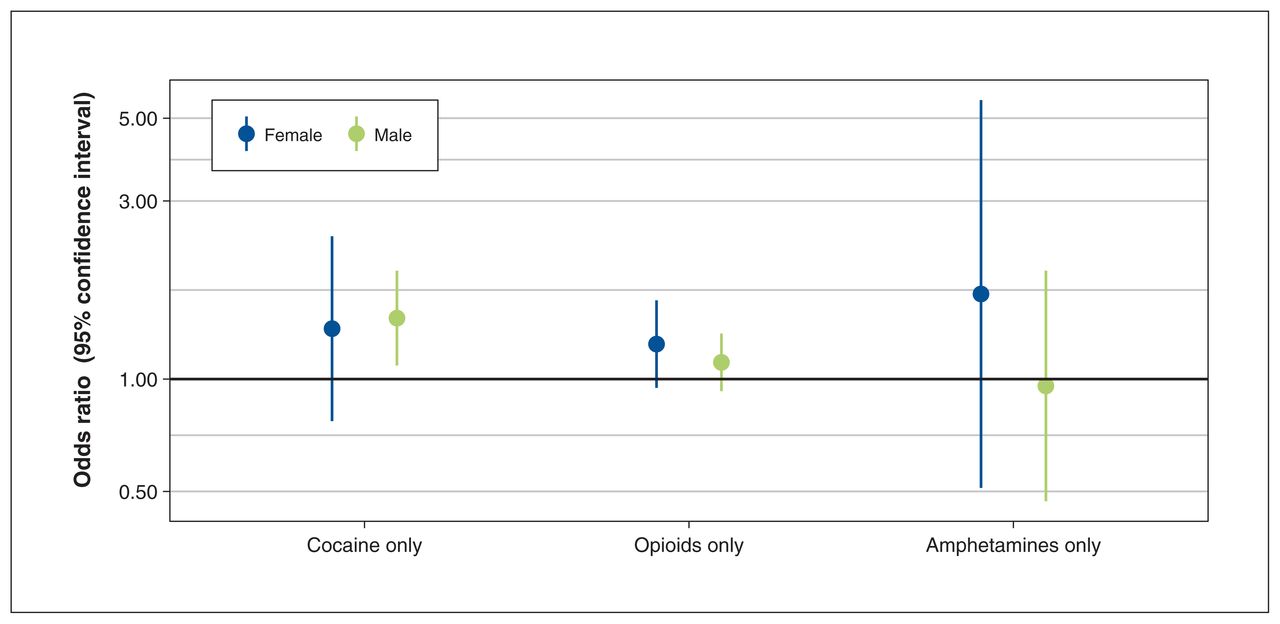
Odds ratios and confidence intervals for the effect of a 10°C increase in the 2-day average of maximum temperatures on death attributed to acute cocaine, opioid and amphetamine toxicity (T code), stratified by sex. Daily maximum temperatures were measured at the weather station nearest to the residential location, within 50 km.
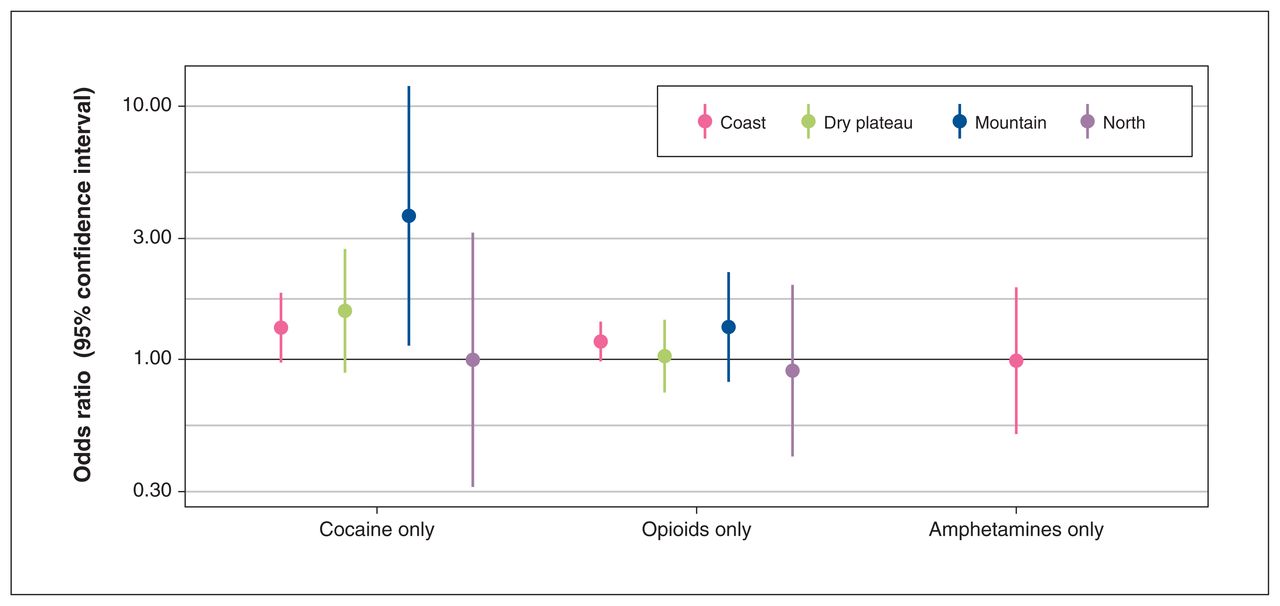
Odds ratios and confidence intervals for the effect of a 10°C increase in the 2-day average of maximum temperatures on death attributed to acute cocaine, opioid and amphetamine toxicity (T code), stratified by climatic region. Daily maximum temperatures were measured at the weather station nearest the residential location, within 50 km.
When the same models were applied for death records with chronic use (F code) of a single drug but no acute toxicity (T code), the ORs were elevated for cocaine and amphetamines but not significant (Figure 5). In all cases, the CIs for the F code analyses overlapped with those for the T code analyses. The OR for chronic cocaine use only was 1.18 (95% CI 0.93–1.50) among 625 deaths, compared with OR 1.43 (95% CI 1.11–1.86) for acute cocaine toxicity among 561 deaths in the absence of other drugs. The odds ratio for chronic opioid use only was 0.94 (95% CI 0.64–1.41) among 261 deaths, compared with OR 1.15 (95% CI 0.99–1.33) for acute opioid toxicity among 1682 deaths. Finally, the OR for chronic amphetamine use was 1.29 (95% CI 0.70–2.37) among 101 deaths, compared with OR 1.11 (95% CI 0.60–2.04) for acute amphetamine toxicity among 133 deaths.

Odds ratios and confidence intervals for the effect of a 10°C increase in the 2-day average of maximum temperatures on death attributed to chronic cocaine, opioid and amphetamine use (F code), without evidence of acute toxicity (T code). Daily maximum temperatures were measured at the weather station nearest the residential location, within 50 km.
Interpretation
Overall, increasing temperatures were most clearly associated with increased odds of death in the context of acute toxicity from cocaine alone or in combination with other drugs. Our results may also suggest an association with opioid toxicity, though models with continuous and binary temperatures produced somewhat inconsistent results (Figure 1). Analyses on chronic drug use showed an elevated OR for cocaine use that overlapped with the OR for acute toxicity. These results suggest that chronic use and acute toxicity may contribute to temperature-related risks among those who use cocaine, which is plausible given that cocaine use affects acute and chronic cardiovascular outcomes.36
These findings are consistent with the small body of epidemiologic evidence on this topic.5–7 Auger and colleagues studied 762 cases of death involving cocaine during the summer months of 2000–2013 in Quebec, using a similar case-crossover design. They reported that a maximum temperature of 30°C was associated with an OR of 1.53 (95% CI 1.03–2.27) for deaths involving cocaine toxicity (T codes), compared with a maximum temperature of 20°C.5 We report an OR of 1.43 (95% CI 1.11–1.86) for a 10°C increase in the 2-day average of maximum temperature and an OR of 1.38 (95% CI 0.98–1.94) for temperatures over the regional 90th percentile among 561 cases indicating cocaine toxicity alone. Marzuk and colleagues studied 2886 cases involving unintentional drug overdose from 1990 to 1995 in New York. They compared 3 mutually exclusive case groups (cocaine, opioids and other drugs) with 2 other groups (homicides and deaths from motor vehicle crashes). Mortality involving cocaine was 33% higher on hotter days than on cooler days, where the threshold value was 31.1°C. There was no effect of hot days on deaths associated with opioid toxicity.6 Bohnert and colleagues reported a similar conclusion in their study from 1990 to 2006 in New York, but with a substantially lower temperature threshold of 24°C.7
We observed that concurrent toxicity due to cocaine, opioids and amphetamines was associated with the highest odds of death in hot weather. However, the number of deaths in this group was small (n = 152). Studies in humans have found that stimulant–opioid combinations produce cardiovascular and subjective effects that differ from the effects produced by either drug alone.15–17 There is also evidence that “speedball” use (stimulants and opioids in combination at low doses) synergistically enhances locomotor activity and hyperactivity. Opioids and stimulants have different effects. Opioids lead to respiratory depression, whereas cocaine and amphetamines lead to heat generation and reduced heat dissipation through different mechanisms. 37–41 It is possible that these combined effects lead to greater temperature-related risks.
The province of BC is large, with a complex topography and different climatic regions. The dry plateau between the Coast and Rocky Mountains regularly has maximum temperatures over 35°C in the summer. Temperatures are typically more moderate along the coast, more variable within the mountain ranges and cooler across the north (Table 3). We observed the highest odds of death from cocaine toxicity in the mountain region, but the number of deaths in this group was small. However, there was a similar number of deaths from cocaine toxicity in the north, where the OR was not elevated at all. This marked difference between the groups may be due to lower temperatures in the north, or higher variability in the mountains, leading to more contrast between the case and control days in the case-crossover design (Table 3).
The results of this study must be interpreted in the context of the ongoing drug toxicity crisis and the changing climate in BC. The public health emergency related to drug toxicity was first declared in 2016, but the numbers of cases and deaths have continued to rise, especially since the COVID-19 pandemic.13,42 Some of the biggest increases have been observed in some of the hottest communities.43 The increasing volume of toxic drug deaths has put substantial strain on the BC Coroners Service, and it often takes months or years for the BC Vital Statistics Agency to receive coroners’ certificates of death for drug toxicity cases. We have limited this study to deaths through 2017 because of the data delays, but the summer climate in BC has shifted notably in the past decade.44 When the data become available, future work should focus on more recent years to improve relevancy to climate change, including the deadly 2021 heat dome.45 Further work should also extend to more substances based on their emerging impacts (e.g., benzodiazepines) or their common use (e.g., alcohol), and researchers should consider examining the effect of temperature as a nonlinear function.
Limitations
Our study has some important limitations. Although many potential mechanisms could explain our observations, we cannot discount the possibility that our findings are confounded by heat-and cocaine-associated behaviours. Cocaine use may be more likely to occur on warmer rather than cooler days, or cocaine users may be more likely to engage in risky behaviour on hotter days. Both alternative hypotheses could explain, at least in part, the observed association. Individuals were matched to temperatures based on their residential 6-digit postal code in the vital statistics record, but they may have been exposed at other locations on the date of death or the control dates. Our subgroup analyses found small differences when residential and death locations were compared. The vital statistics data do not distinguish between toxicity due to illicit or prescribed drugs, and the temperature-related impacts may differ between groups. The vital statistics records do not include any information on the toxic dose of drugs present at the time of death, meaning that we cannot evaluate the degree of intoxication, only the fact of intoxication. All these limitations are shared by similar studies on the topic.5–7
Conclusion
This study found that higher temperatures were associated with a higher risk of death when the code for acute cocaine toxicity was present in the vital statistics record, either alone or combined with other drugs. The risk was also elevated in other groups. Overall, targeted education and interventions may help to prevent deaths from drug toxicity during hot weather, especially as the drug supply becomes more toxic, the global climate continues to warm and extreme heat events become more frequent. People who use substances may not know that they are at higher risk. Simple interventions include training staff and volunteers who work with people who use substances, and displaying and distributing resources in areas where people gather, such as overdose prevention sites.
Acknowledgements
The authors are grateful to the editors, statisticians and reviewers who have helped to strengthen this work. They also thank their colleagues at the BC Vital Statistics Agency at the BC Coroners Service for answering questions about the data used in these analyses.
Footnotes
Competing interests: None declared.
This article has been peer reviewed.
Contributors: Sarah Henderson contributed to the conceptualization, methodology, formal analysis and supervision of the study and the drafting and review of the manuscript. Kathleen McLean and Jiayun Yao contributed to the formal analysis and data curation of the study, review of the manuscript and visualization. Yue Ding contributed to the formal analysis and data curation of the study, drafting the manuscript and visualization. Nikita Saha Turna and David McVea contributed to detailed literature review, interpretation of the data, and drafting and reviewing the manuscript. Tom Kosatsky contributed to conceptualization, methodology and supervision of the study, and the drafting and review of the manuscript. All authors gave final approval of the version to be published and agreed to be accountable for all aspects of the work.
Funding: No funding was received for this work.
Data sharing: Death data for this study were accessed by the BC Centre for Disease Control (BCCDC) under the BC Public Health Act. The data are not available to individuals outside of the BCCDC, but the same data can be accessed through Population Data BC. The meteorological data were accessed through Environment and Climate Change Canada, and are publicly available online.
Supplemental information: For reviewer comments and the original submission of this manuscript, please see www.cmajopen.ca/content/11/3/E569/suppl/DC1.
This is an Open Access article distributed in accordance with the terms of the Creative Commons Attribution (CC BY-NC-ND 4.0) licence, which permits use, distribution and reproduction in any medium, provided that the original publication is properly cited, the use is noncommercial (i.e., research or educational use), and no modifications or adaptations are made. See: https://creativecommons.org/licenses/by-nc-nd/4.0/
References
- © 2023 CMA Impact Inc. or its licensors
In this issue

Article tools


Related Articles
Cited By...
- No citing articles found.