Article Text

Abstract
Objective Canada federally legalised recreational cannabis use among adults in October 2018. The impact this will have on Canadian youth is cause for concern. The current study examined changes in youth cannabis use over the time prior to legalisation to explore the impact of the beginning federal discourse around legalisation during the 2016/2017 school year.
Design COMPASS, a prospective cohort study based on annual self-administered questionnaires.
Setting Ontario and Alberta during the first 6 years of the COMPASS study (2012/2013 to 2017/2018).
Participants Canadian grade 9–12 students attending secondary schools participating in COMPASS. In total, 2 30 404 questionnaires were included in the analysis (Y1: 2012/2013, n=24 173; Y2: 2013/2014, n=45 298; Y3: 2014/2015, n=42 355, Y4: 2015/2016, n=40 436; Y5: 2016/2017, n=37 060; Y6: 2017/2018, n=34 897).
Primary and secondary outcome measures Lifetime cannabis use, past-year cannabis use, weekly cannabis use, ease of access to cannabis and age at first cannabis use.
Results Cannabis never-use decreased between Y5 and Y6. Changes in age at first cannabis use mirrored this trend, with male students consistently starting younger. Cannabis access rates increased from Y4, mainly led by female students. Lifetime and past-year use rates were lowest in Y4 then increased in Y5 and Y6 due to a rise in the occasional use more common among female students, who reported use increases first. Non-white students were more likely use cannabis, with black and Aboriginal students the only two groups consistently reporting more weekly than occasional use, though with opposing trajectories. Overall, Aboriginal students had the highest odds of reporting lifetime, past-year and weekly use among the demographic groups examined.
Conclusion After a steady decrease in patterns of cannabis among youth over several years, it appears that there has been a gradual increase in cannabis use among youth following the start of discourse around cannabis legalisation, with some populations of youth being at greater risk.
- public health
- epidemiology
- substance misuse
This is an open access article distributed in accordance with the Creative Commons Attribution Non Commercial (CC BY-NC 4.0) license, which permits others to distribute, remix, adapt, build upon this work non-commercially, and license their derivative works on different terms, provided the original work is properly cited, appropriate credit is given, any changes made indicated, and the use is non-commercial. See: http://creativecommons.org/licenses/by-nc/4.0/.
Statistics from Altmetric.com
Strengths and limitations of this study
This study describes cannabis use patterns and trends prior to legalisation.
It benefits from prospective design, validated measures and large sample size.
Data are drawn from a convenience sample and therefore not generalisable.
Recall and social desirability biases may have influenced self-report data.
Introduction
In 2018, Canada was the second country to federally legalise recreational cannabis use, and the first to do so with the primary emphasis on public health and education.1 Following almost 80 years of complete prohibition, individual use of medicinal cannabis was legalised in Canada in 2001, although with the requirement for special approval of a medical exemption by Health Canada, which formed a significant access barrier for most.2–4 In 2014, new regulations abolished this approval process and shifted gate-keeping duties to physicians, leading to a rise in prescriptions.1 Court decisions in 2015 and 2016 precipitated a further loosening of restrictions on the permitted range of cannabis sources and products.2 5 6 Concurrently, the Canadian government formed a Cannabis Legalization Task Force, which delivered its final report in December 2016.7 The resulting Cannabis Act (Bill C-45) was introduced to Parliament in April 2017 and passed in June the following year.8 It came into force in October 2018.9
Evidence on the effects of medical or recreational legalisation of cannabis on youth, for whom it remains illegal given age restrictions, is mixed. Some studies have shown that more permissive cannabis laws increase rates of cannabis use among adolescents,10–13 whereas others have reported that they do not.14–18 There is evidence that legalisation can lead to gradual increases in use, more high-frequency use, a drop in the average age at first use and increased use of more potent forms of cannabis.19–26 As Canadian youth already use cannabis at a higher rate than Canadian adults or youth globally, any increase in use prevalence or frequency due to legalisation is cause for concern.7 27 28
COMPASS, a large prospective cohort study of youth in Canada (2012–2021), serves as a research platform for evaluating the consequences of policy change on youth health behaviours.29 With data reaching back to the 2012/2013 school year, evidence from COMPASS will be used by researchers and decision makers to evaluate the impact of cannabis legalisation on Canadian youth. This study relied on the first 6 years of COMPASS data to characterise the changes in youth cannabis use over time in terms of lifetime and past-year use, use frequency, age at first use and ease of access to cannabis, to provide insight into prelegalisation cannabis use among Canadian youth.
Methods
Study design
COMPASS, a prospective cohort study, annually collects hierarchical data from grade 9 to 12 students and the schools they attend. This report uses student data from COMPASS years 1 to 6 (2012/2013 to 2017/2018) collected in Ontario and Alberta. The COMPASS student questionnaire is an anonymous, self-administered questionnaire completed by students during class time, with items based on national guidelines or surveillance tools as previously described.29 30 Students could decline to participate at any time. Response rates range from 76% to 80% (Year 1: 79.0%, Year 2: 79.2%, Year 3: 78.7%, Year 4: 79.9%, Year 5: 76.0%, Year 6: 78.7%). The primary reason for non-response was absenteeism or scheduled spare on the data collection date. Parental permission rates are >99%. A full description of COMPASS study methods and data collection tools is also available online (www.compass.uwaterloo.ca).
COMPASS data presented in this report are from 24 173 students (43 schools) in Year 1 (Y1 2012/2013), 45 298 students (89 schools) in Year 2 (Y2 2013/2014), 42 355 students (87 schools) in Year 3 (Y3 2014/2015), 40 436 students (81 schools) in Year 4 (Y4 2015/2016), 37 060 students (88 schools) in Year 5 (Y5 2016/2017) and 34 897 students (69 schools) in Year 6 (Y6 2017/2018). Schools that dropped out of the COMPASS study reported cannabis ever-use rates of 31.9%, whereas schools that remained reported rates of 30.1%. Students with missing values for demographic or cannabis use measures were excluded from this study. The start of formal federal discourse around cannabis legalisation occurred in March 2016, near the end of the Y4 data collection cycle.
Measures
Sample characteristics
Students provided demographic information on grade, sex/gender and race/ethnicity, as well as answering three questions on past-year cannabis use frequency, age at first use and ease of access to cannabis consistent with national surveillance measures on cannabis use and as previously described.30 31
Cannabis lifetime/past-year use and use frequency
Students were asked, ‘In the last 12 months, how often did you use marijuana or cannabis?’ and responded with 1 of nine options: ‘I have never used marijuana’, ‘I have used marijuana but not in the last 12 months’, ‘Less than once a month’, ‘Once a month’, ‘2 or 3 times a month’, ‘Once a week’, ‘2 or 3 times a week’, ‘4 to 6 times a week’ and ‘Every day’. Individuals were classified as lifetime users if they indicated any marijuana use and past-year users if they indicated use of ‘at least once a month’ or more frequent. Among past-year users, students were classified as weekly users if they indicated use of ‘once a week’ or more often and as occasional users if they indicated less frequent use.
Age at first cannabis use and ease of access to cannabis
Students were asked, ‘How old were you when you first used marijuana or cannabis?’ and responded with 1 of 13 options: ‘I have never used marijuana’, ‘I do not know’, ‘8 years or younger’, one option for each age from 9 to 17 and ‘18 years or older’. Age of first use was measured on the subsample of grade 12 students who had indicated past marijuana use. Students who answered, ‘I do not know’ to the age of initiation question were excluded from the analyses. Students also responded to the question ‘Do you think it would be difficult or easy for you to get marijuana if you wanted some?’ with ‘Difficult’, ‘Easy’ or ‘I do not know’.
School median income and urbanicity
School data were extracted from Statistics Canada 2016 census data. School median income was determined using the median income for the forward sortation area (first three letters of postal code). Urbanicity was measured based on total population and population density for the population centre in which the school resides.
Patient and public involvement
Students were not involved in study design, research question design or recruitment and conduct of the study, beyond self-administration of the student questionnaire. Some items were based on previously validated measures which may have involved students or patients in their design. School-specific results were annually provided in terms of overall health measures to each participating school in the form of a school feedback report, which school administrators were encouraged to disseminate to staff, students,and parents or guardians.
Statistical analyses
Statistical analyses were conducted in SAS V.9.4. Generalised estimating equations (GEE) with alternating logistic regression were used to estimate the relationship between lifetime, past year and weekly marijuana use and ease of access outcomes and COMPASS study year, gender and race/ethnicity. Among grade 12 students only, a linear mixed model was used to examine the relationship between age of initiation and COMPASS study year, gender and race/ethnicity. All models were adjusted for grade, school median income, urbanicity and clustering by school. The PROC GENMOD procedure was used to fit GEE models with an exchangeable logOR. The PROC MIXED procedure was used to fit the linear mixed model with random intercept.
Results
The proportion of cannabis never-users increased from Y1 to Y4 but then decreased in Y5 and Y6 (table 1). Annual changes in age at first cannabis use mirrored this trend, with the number of students starting at 12 or younger first increasing to 14.7% in Y4 and then decreasing to 11.9% in Y6. In both cases, the level of change observed between Y4 and Y6 exceeded that between Y1 and Y4. The proportion of students who thought cannabis difficult to access changed most rapidly, halving from 13.8% in Y3 to 7.4% in Y4 and then further decreasing to 6.5% in Y6.
Demographic characteristics and cannabis use indicators among COMPASS youth (Canada)
Lifetime and past-year use
Rates of lifetime and past-year cannabis use were highest among male and Aboriginal students, and lowest among Asian students (figure 1). Both rates reached their lowest points in Y4 at 28.8% and 24.1%, respectively, but have been increasing since, with the changes appearing to be accelerating. Lifetime use similarly increased in Y5 and Y6. Interestingly, both lifetime and past-year use by male students remained steady between Y4 and Y5, rising sharply in Y6, whereas use rates among female students rose in both Y5 and Y6. Changes in lifetime and past-year use among students grouped by races/ethnicity were mixed, though Y4 marked a turning point for most youth. In Y5, lifetime use rates among black and Hispanic students decreased, whereas increasing among white, Asian and Aboriginal students. These trends were similar for past-year use, though past-year rates were markedly lower than life-time use only for Aboriginal students.

Rates of lifetime and past-year cannabis use among youth participating in the COMPASS study (Ontario and Alberta, Canada). Total proportion of COMPASS students reporting lifetime and past-year cannabis use (A) in total and (B) by gender each school year from Y1 (2012/2013) to Y6 (2017/2018). (C, D) Total proportion of COMPASS students grouped by race/ethnicity reporting (C) lifetime and (D) past-year cannabis use. Y1, 2012/2013; Y2, 2013/2014; Y3, 2014/2015; Y4, 2015/2016; Y5, 2016/2017; Y6, 2017/2018.
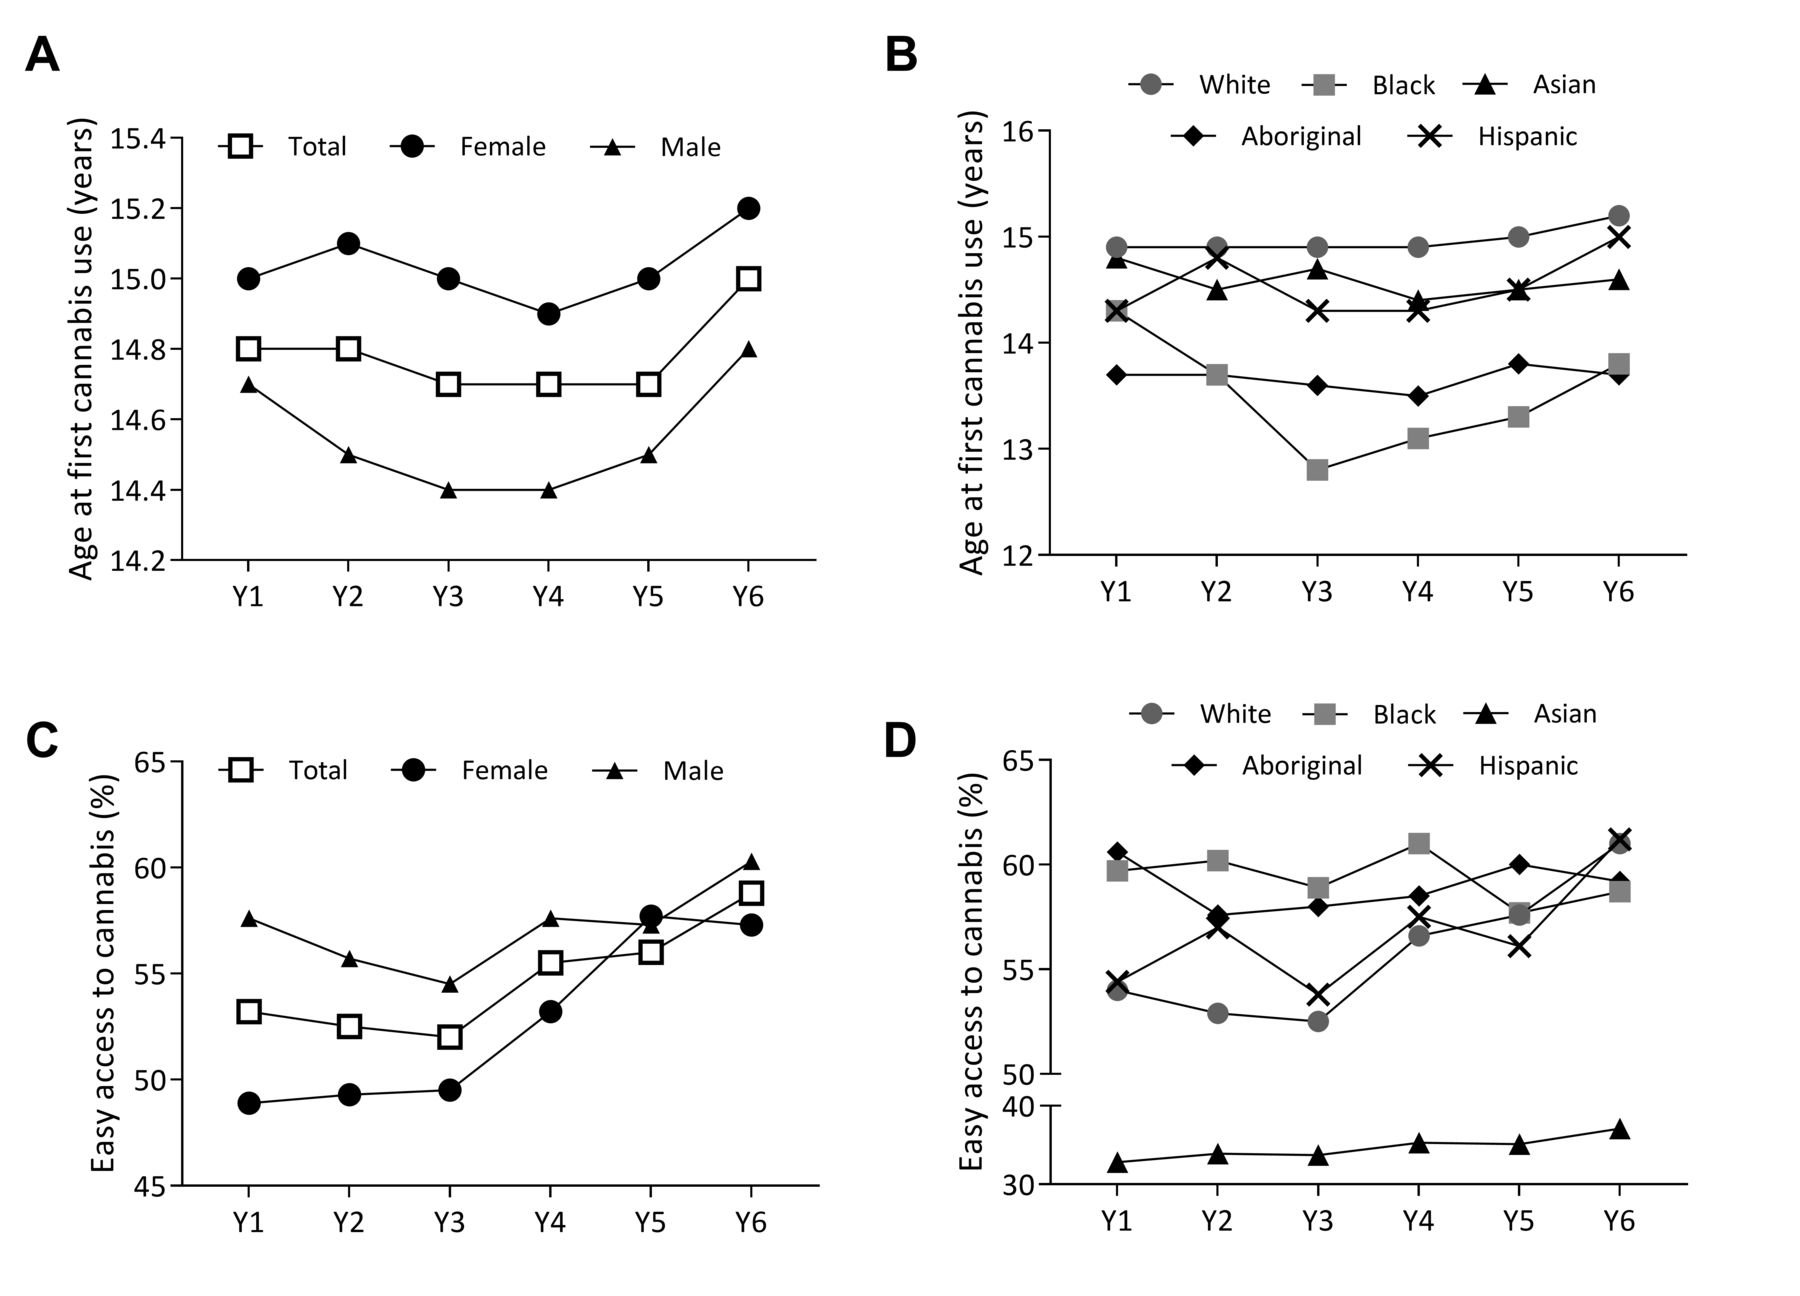
Age at first use and ease of access
The average age at first cannabis use reported by grade 12 students was highest in Y6 (figure 2). Male students consistently started using cannabis at younger ages than females, though averages for both increased in Y5 and Y6. Among black students, average age at first use dropped from 14.3 to 12.8 years between Y1 and Y3, then steadily recovered to reach 13.8 years in Y6, surpassing Aboriginal students (13.7 years), whose average remained low. White, Hispanic and Asian students reported their youngest average age in Y4, with values on the rise since.

Average age at first cannabis use and rates of easy access to cannabis among youth participating in the COMPASS study (Ontario and Alberta, Canada). Grade 12 COMPASS students reporting (A, B) average age at first cannabis use (A) overall and by gender and (B) by ethnicity each school year from Y1 (2012/2013) to Y6 (2017/2018). (C, D) Total proportion of grade 9–12 COMPASS students who think cannabis is easy to access (C) overall and by gender and (D) by ethnicity. Y1, 2012/2013; Y2, 2013/2014; Y3, 2014/2015; Y4, 2015/2016; Y5, 2016/2017; Y6, 2017/2018.
After decreasing from Y1 to Y3, the proportion of students who thought cannabis easy to access increased from Y4 to Y6, with a sharp rise among female students in Y4 and Y5, and a subsequent rise among male students in Y6. The lowest, though steadily rising, rates of easy access were recorded among Asian students, the highest among black and Aboriginal students. This was the case until Y6, when rates among Hispanic and white students, which started increasing in Y4 after 3 years of decline, peaked at the highest values observed over the 6 years studied.
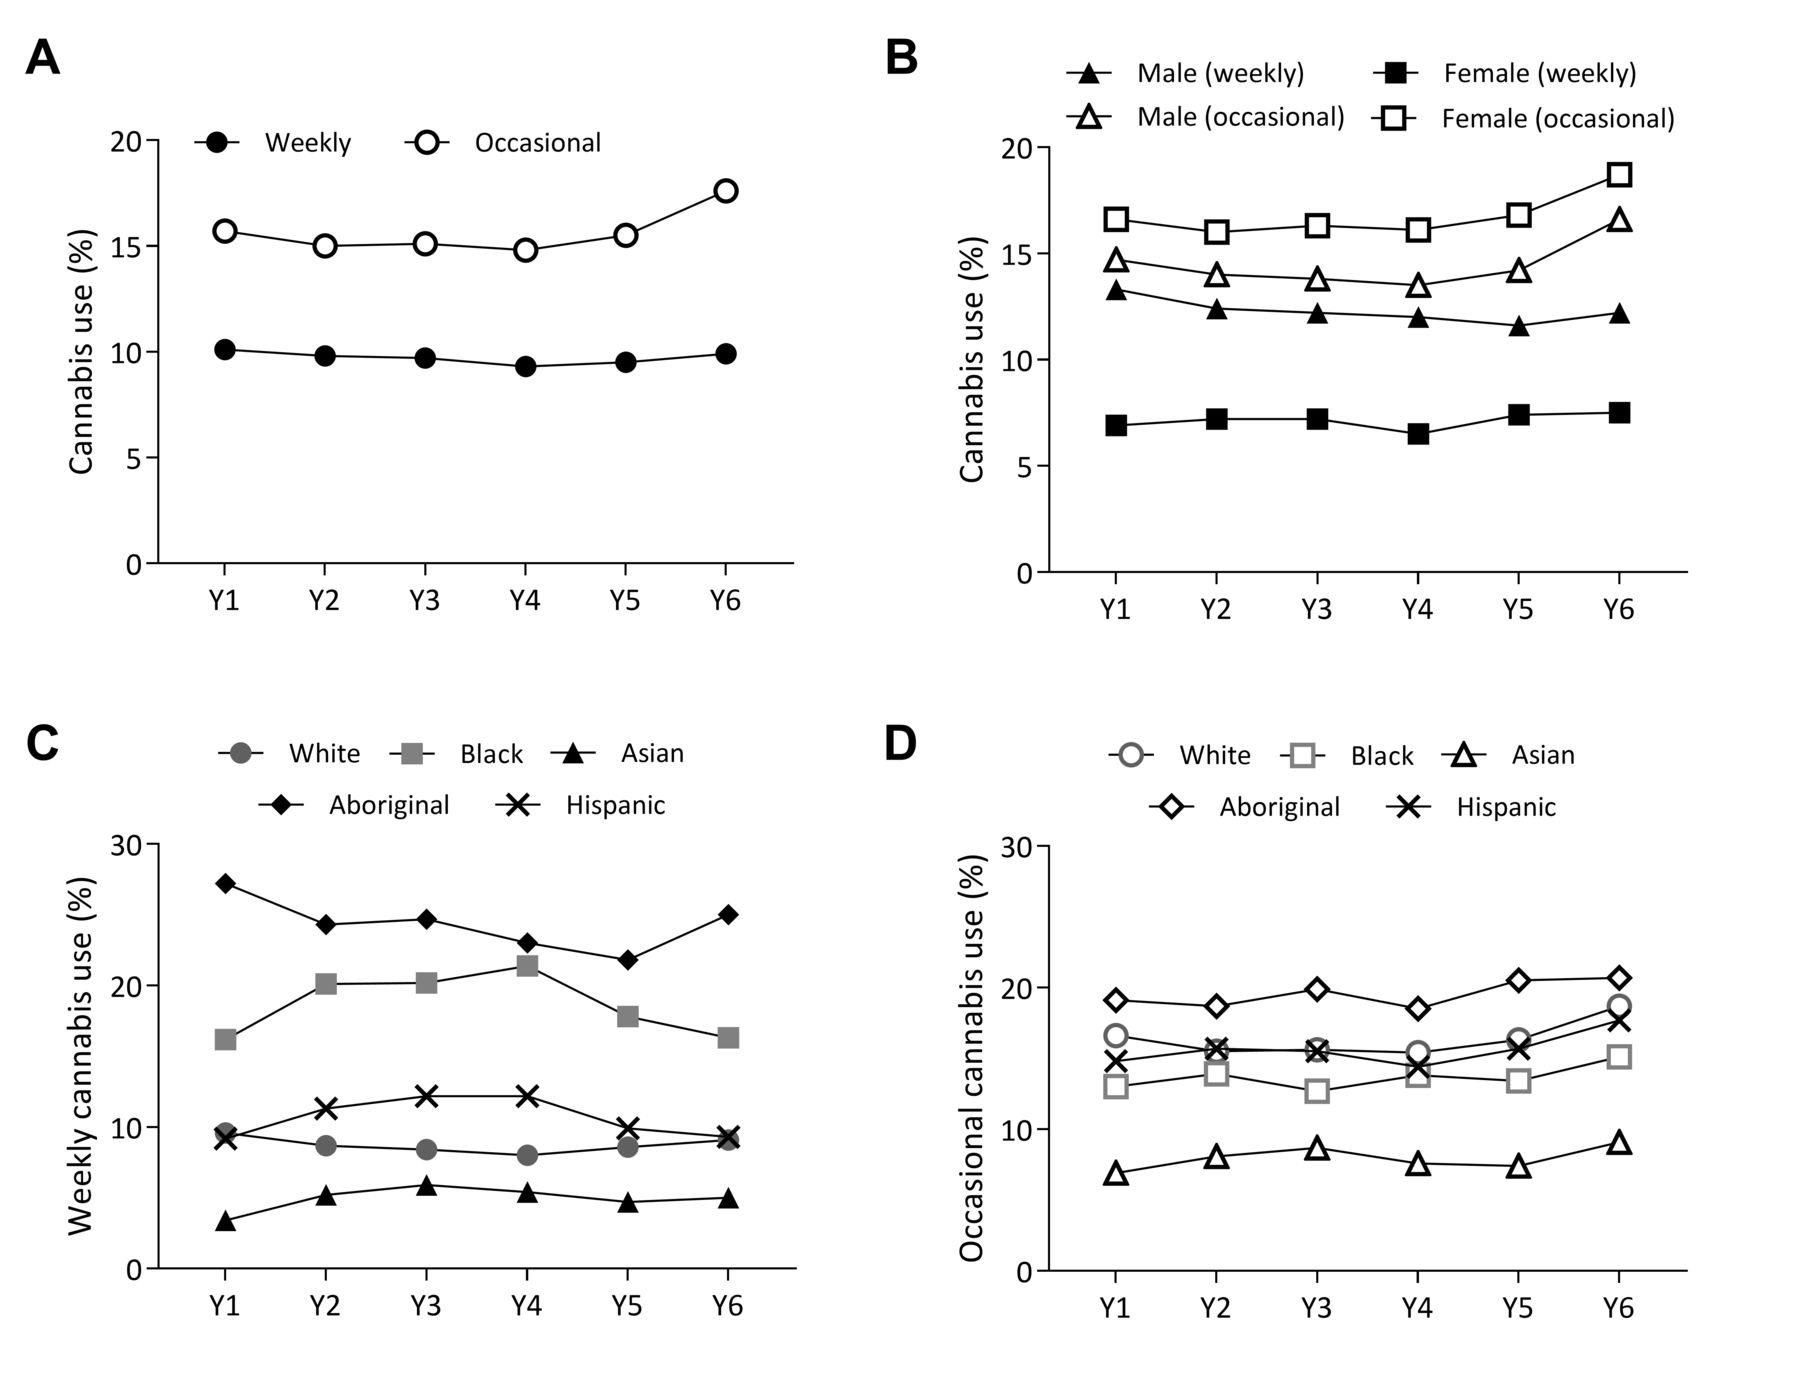
Frequency of use
Between 9.3% and 10.1% of students reported weekly use (figure 3). Both weekly and occasional use have been increasing since reaching their lowest point in Y4, the latter rising especially fast. Rates of occasional use among male students, generally lower than those among female students, rose 1.4-fold faster between Y5 and Y6. Of note, rates of occasional use were 2.4-fold higher than weekly use rates among females, compared with an average 1.2-fold difference for males.
Rates of weekly and occasional cannabis use among youth participating in the COMPASS study (Ontario and Alberta , Canada). Total proportion of COMPASS students reporting weekly (one to six times a week or daily) and occasional (two to three times a month or less) cannabis use (A) in total and (B) by gender each school year from Y1 (2012/2013) to Y6 (2017/2018). (C, D) Total proportion of COMPASS students grouped by race/ethnicity reporting (C) weekly and (D) occasional cannabis use. Y1, 2012/2013; Y2, 2013/2014; Y3, 2014/2015; Y4, 2015/2016; Y5, 2016/2017; Y6, 2017/2018.
Rates of occasional use rates varied less between different racial or ethnic groups than rates of weekly use. Over time, occasional use rates fluctuated between Y1 and Y4 for most groups, then subsequently rose in Y5 for Aboriginal, white and Hispanic students and in Y6 for black and Asian students. Only black and Aboriginal students reported more weekly than occasional use for all years, though with mirroring trajectories. Rates of weekly use among black students increased from Y1 to Y4, then decreased in Y6, whereas those among aboriginal students dropped from 27.2% in Y1 to 21.8% in Y5 and then rose sharply to 25% in Y6.
Regression analyses
Inflection points were observed in the trend curves for all five cannabis use indicators over the six COMPASS study years shown here, though at different times (table 2). For instance, compared with Y1, students had significantly lower odds of reporting past-year cannabis use from Y2 to Y4, but significantly higher odds in Y6. Similar patterns were observed for lifetime use, weekly use, age at first use and ease of access, with odds of easy access continually increasing starting in Y4. Meanwhile, demographic differences remained mostly consistent across all indicators of cannabis use. Male students were more likely than female students to report any use, easy access or a lower age at first use. Compared with white students, Aboriginal students had the highest odds of reporting lifetime (OR 2.66), past-year (OR 2.24) and weekly use (OR 3.04). Asian students had lower odds of reporting easy access or any category of use, whereas white students were more likely to start using cannabis later than any other group.
Regression analyses† of the relationship between COMPASS year, student gender, student race or ethnicity and five cannabis use outcomes
Discussion
Cannabis use has been highly prevalent among COMPASS youth since 2012/2013, as it is among their peers across Canada.7 27 28 Our data generally suggest that, following a steady decrease over several years, there has been a gradual increase in youth cannabis use since the beginning of the federal discourse around legalisation. During this time, public perception of cannabis use shifted to include a type of ‘sensible’ use, which is intermittent and socially acceptable.32–35 For youth, these more accommodating social norms and pro-cannabis messaging are associated with increased cannabis use.36–38 Here, most of the increase we observed was due to an upswing of occasional, or sensible, use. When placed in the context of growing access after 2014/2015 and the slow rise in average age at first use, these data may represent the emergence of a large group of casual cannabis users who start later and use infrequently. Future, postlegalisation evaluations must therefore explore the impact on various patterns of use.
We may characterise our results further by relying on the normalisation theory framework, which posits that the interplay between six factors—access, trying and usage rates, attitudes, cultural accommodation and governmental response—can normalise drug use.39 40 Other factors have recently been suggested, for example, seeing drugs as a means of achieving normal goals, such as cannabis use by athletes to enhance performance.41–43 Indicators for the normalisation of cannabis use have been prevalent in Canada for some time.34 44–46 Subsequent to reduced restriction of medical cannabis in 2014, rates of students who thought cannabis easy to access significantly increased in 2015/2016 (Y4) and rose in tandem with further deregulation.1 2 The increased availability of cannabis is likely to have normalised and facilitated access for youth, who most commonly obtain drugs through their social network.40 47 Perceived access drives use48 and we identified that rates of cannabis use in our sample increased the following year (2016/2017). This is true especially among female students, for whom the effects of normalisation may be greater as their cannabis use has historically been more stigmatised than that of their male peers.49 Female students are also more likely to use alternative cannabis products, which were then becoming more accessible.2 50 51 As normalisation and access to diverse cannabis products is liable to increase in Canada after legalisation,19 22 special attention should be paid to subsequent impacts on female youth.
The evidence presented here demonstrates that the focus on demographic differences among youth who use cannabis is warranted. For instance, lifetime and past-year use rates were particularly high among Aboriginal students, who also reported the most weekly use. This is in line with existing evidence reporting similar results for both American and Canadian Aboriginal youth, who are more likely to start younger and use cannabis more regularly than white adolescents, especially if male.52–57 Following a steady decrease over several years, weekly use by Aboriginal youth increased significantly in 2017/2018 (Y6). This is a concerning development that may warrant close future monitoring, and interventions to mitigate the effects of cannabis legalisation for these adolescents are likely to be needed.
The evidence also suggests that studies on the impact of cannabis legalisation on Canadian youth should consider data from several years prior to the passage of the Cannabis Act. Relying on 2017/2018 as a solitary baseline is liable to miss key developments in the years before, and therefore likely to underestimate subsequent effect, for example, the increase in youth lifetime and past-year use. In 2016/2017, Health Canada funded the expansion of COMPASS to include high school students in Québec, British Columbia, and Nunavut, increasing the relevance of its future investigations of youth cannabis use. As cannabis legalisation is likely to disproportionally affect youth, these data will be essential to understand and mitigate its impact.
Limitations
The COMPASS study has several strengths, including prospective design, validated measures and large sample size.29 However, recall and social desirability biases may influence data from self-report questionnaires, leading to under-reporting of cannabis use, especially among subpopulations (eg, females) where use is more stigmatised.49 High school students who use cannabis at a high frequency are more likely to drop out,58 also resulting in underestimations, especially of weekly use rates. As the schools studied were from a convenience sample, results are not generalisable. However, use of a passive-consent protocol resulted in high participation rates and reduced selection bias within schools, and the large sample size suggests that conclusions drawn will apply to a substantial proportion of Canadian high school students.
Conclusions
Our data suggest that there has been a gradual rise in youth cannabis use due to the federal discourse around cannabis legalisation prior to actual changes in law. This negative trend appears amplified among some subpopulations of youth. Future research examining the impact of cannabis legalisation should consider the ramifications of these preimplementation changes when drawing conclusion about its overall effect on Canadian youth.
References
Footnotes
Contributors AMEZ designed the work, interpreted the data, wrote and revised the manuscript, approved the version to be published and agreed to be accountable for all aspects of the work. KB designed the work, managed and analysed the data, revised the manuscript, approved the version to be published and agreed to be accountable for all aspects of the work. MdG and YJ substantially contributed to the design of the work, revised the manuscript, approved the version to be published and agreed to be accountable for all aspects of the work . SL is the principal investigator of the COMPASS study, designed the work, revised the manuscript, approved the version to be published and agreed to be accountable for all aspects of the work.
Funding The COMPASS study was supported by a bridge grant from the Canadian Institutes of Health Research (CIHR) Institute of Nutrition, Metabolism and Diabetes through the “Obesity—Interventions to Prevent or Treat” priority funding awards (OOP-110788; grant awarded to SL) and an operating grant from the CIHR Institute of Population and Public Health (IPPH) (MOP-114875; grant awarded to SL). SL is a Chair in Applied Public Health funded by the Public Health Agency of Canada (PHAC) in partnership with CIHR. AMEZ is funded by PHAC through a Natural Sciences and Engineering Research Council of Canada (NSERC) Visiting Fellowship in Government Laboratories.
Competing interests None declared.
Ethics approval The COMPASS study was approved by the University of Waterloo Office of Research Ethics (OR file 17264) and appropriate school boards.
Provenance and peer review Not commissioned; externally peer reviewed.
Data sharing statement COMPASS data are available for researchers upon successful completion and approval of the COMPASS data usage application (https://uwaterloo.ca/compass-system/information-researchers). Technical reports detailing COMPASS study methods are available online (https://uwaterloo.ca/compass-system/publications#technical).
Patient consent for publication Not required.