Article Text

Abstract
Study objective: To investigate the association between cold periods and coronary events, and the extent to which climate, sex, age, and previous cardiac history increase risk during cold weather.
Design: A hierarchical analyses of populations from the World Health Organisation’s MONICA project.
Setting: Twenty four populations from the WHO’s MONICA project, a 21 country register made between 1980 and 1995.
Patients: People aged 35–64 years who had a coronary event.
Main results: Daily rates of coronary events were correlated with the average temperature over the current and previous three days. In cold periods, coronary event rates increased more in populations living in warm climates than in populations living in cold climates, where the increases were slight. The increase was greater in women than in men, especially in warm climates. On average, the odds for women having an event in the cold periods were 1.07 higher than the odds for men (95% posterior interval: 1.03 to 1.11). The effects of cold periods were similar in those with and without a history of a previous myocardial infarction.
Conclusions: Rates of coronary events increased during comparatively cold periods, especially in warm climates. The smaller increases in colder climates suggest that some events in warmer climates are preventable. It is suggested that people living in warm climates, particularly women, should keep warm on cold days.
- coronary disease
- myocardial infarction
- risk factors
- MONICA project
Statistics from Altmetric.com
An association between cardiovascular deaths and outdoor temperature has been a hot topic since 1970.1,2,3,4,5,6,7,8,9,10,11,12,13,14,15,16,17 It is generally agreed that as temperature decreases the risk of death increases. Increases in coronary events have also been seen during heat waves.18 The size of the increased risk attributable to cold temperatures seems to depend on the average annual temperature; for example, the Eurowinter group found smaller increases in cardiovascular mortality in colder regions (Finland) than in warmer regions (Athens, Greece).6
In this paper we used data from the World Health Organisation’s MONICA project to look at temperature and non-fatal—as well as fatal—coronary heart disease events. We used 24 populations living in widely different climate and socioeconomic conditions. The objectives of the WHO MONICA project (to monitor trends and determinants in cardiovascular disease) were: to measure trends in mortality and morbidity from coronary heart disease and stroke in geographically selected populations; and to assess the extent to which these trends are related to changes in known risk factors, daily living habits, health care, or major socioeconomic features.19 As the MONICA project used community registries of coronary events, we were able to link the seasonal change in event rates to detailed subject level information (for example, previous history of myocardial infarction). This feature has been absent from many previous studies.20 Also most previous studies used national mortality statistics and so did not include non-fatal events and included all ages, whereas the MONICA study included validated events only in people aged 35–64 years.
METHODS
We aimed to compare daily records of coronary events from WHO MONICA project populations with daily temperature and humidity data from nearby weather stations. Two separate analyses were made: one of the change in daily coronary event rates with temperature in each population; and the other of subject level factors associated with coronary events in cold periods, with data combined across populations.
Populations analysed
The MONICA project’s data collection procedures have been described elsewhere (http:/www.ktl.fi/publications/monica/manual).
Details of the MONICA populations used in our analysis are shown in table 1 (further details on the populations are available in the MONICA monograph and in publications from individual MONICA centres).19 We examined the coronary event data for the years and populations for which we were able to obtain temperature data. For MONICA populations that were geographically close, we combined the daily rates of coronary events and assumed the temperature data were common (Moscow Intervention and Control areas, Charleroi and Ghent in Belgium). Hence there were 24 populations used in the analysis. The period of available data ranged from four years in the Czech Republic, Vaud/Fribourg and Friuli, to 14 years in Iceland.
MONICA populations, weather station locations, years of data available for analysis, mean daily age and sex standardised rate of coronary events per 100000, and daily temperature and humidity
Coronary events
The MONICA project used population surveillance methods to identify all fatal and non-fatal events in defined populations. A fatal coronary event was an event meeting the MONICA criteria for fatal definite myocardial infarction (MI), fatal possible MI or coronary death, or fatal unclassifiable event.21 A non-fatal coronary event was one meeting the criteria for a non-fatal definite MI.21 Events for which an exact date of onset was not recorded were excluded. There was a total of 87 410 events, of which 38 953 (44.6%) were fatal. Daily counts of events were made into age and sex standardised event rates per 100 000 using annual population data.
Temperature and humidity
The outdoor temperature and humidity data came from a number of sources (see table 1). The weather stations were all within 50 kilometres of the study populations.
Each weather station had data on daily temperature, although there were differences in collection procedures. For Halifax and Catalonia the mean daily temperature was provided as the average of the daily maximum and minimum. For the Finnish stations temperature was recorded at 6 am, 12 pm, and 6 pm; the mean daily temperature was calculated as the average of these readings. For Belfast the temperature was recorded only at 9 am. For Newcastle the daily temperature was recorded as the average over the whole day. For the British Atmospheric Data Centre stations temperature was recorded at three hourly intervals between midnight and 9 pm. For these stations we calculated an average temperature using all available data. The National Climatic Data Center stations recorded minimum and maximum daily temperature, from which we calculated the mean daily temperature.
Daily humidity data were only available in 18 of the 24 populations, and sometimes for a shorter time period than the temperature data.
Statistical methods
To examine the time delay (in days) between cold days and rates of cardiovascular events, most previous studies used the temperature on the current day and several preceding days. The range in the delays used was from the current day (that is, 0 days)2 to 7–15 days.3,15 In this study we fitted separate models for delays of 1 day to 14 days and then selected the optimal delay using the Akaike information criteria (AIC).22
Changes in coronary event rates with temperature and humidity
The effects of temperature and humidity on the daily age and sex standardised rates of events were analysed with a distributed lag model.23 Daily rates per 100 000 of coronary events were assumed to have a possibly over-dispersed Poisson distribution. The delayed effects of temperature and humidity (where available) were modelled using unconstrained (independent) variables. The sum of these effects is an unbiased estimate of the overall risk. We used two separate models; a model of temperature only (model A), and a model of both temperature and humidity (model B).
Trends in coronary event rates in the MONICA populations changed slowly over time,24 and event rates increased on Mondays.25 Coronary events rates also change seasonally, and some of this seasonal change is probably attributable to effects other than temperature (for example, serum cholesterol and blood pressure).26 Hence we controlled for long term trend and season using a cubic spline with two degrees of freedom per year, and day of the week. To ensure that the seasonal variation had been fully captured, the model residuals were tested for autocorrelation using the cumulative periodogram test.27
The estimated changes in event rates associated with temperature were combined over populations in a hierarchical meta-regression. Estimates were regressed against the possible population level effect modifiers of average temperature and average humidity (see table 1), using the inverse standard errors as the weights.
Subject level factors associated with coronary events in cold periods
The aim of this analysis was to identify subject level variables that might be associated with an increased risk of coronary events in cold periods. Cold periods were defined using the average temperatures over the preceding 0–3 days. We used a logistic model to compare events occurring in the coldest 25% of periods with events in the other (warmer) periods. The model used the subject level explanatory variables of: age, sex, fatality of the event (fatal/non-fatal), and history of MI (yes/no/unknown). These variables were chosen as indicators of biological factors that might be associated with increased risk.28
Estimates from each population were combined using a Bayesian hierarchical model. The advantage of using a hierarchical model was that the effects of the explanatory variables (for example, sex) could vary across populations; these population estimates were then plotted and regressed against average daily temperature.
More details on the statistical methods can be found at the MONICA web pages.29
RESULTS
Changes in coronary event rates with temperature and humidity
Using the AIC, the estimated optimal delay for the effect of temperature was between 1 and 11 days. The largest delays were in North Karelia (11 days) and Turku/Loimaa (10 days). At the population level there was a statistically significant linear relation between length of optimal delay and mean temperature, as warmer populations had shorter delays. The mean delay across all centres was three days, and hence this was used in the following analysis.
Table 2 shows the estimated changes in event rates associated with temperature and humidity over the previous three days. The effect of humidity was not statistically significant in any population. Also, the meta-regression estimate for the effect of temperature, in a population with a mean temperature of 10°C, was similar for models A and B. The residuals from both models showed some (small) autocorrelation in Newcastle (model A only), Catalonia and Vaud/Fribourg.
Percentage change in age and sex standardised event rates per 100000 attributable to a one degree increase in temperature and one per cent increase in humidity*
Figure 1 shows the estimated population change in coronary event rates plotted against mean temperature. Also shown is a regression line weighted by inverse standard error. The percentage of variation in the change in coronary event rates explained by mean temperature is 28.2%, although this increases to 47.3% if Belfast is excluded, and to 53.7% if both Stanford and Belfast are excluded.
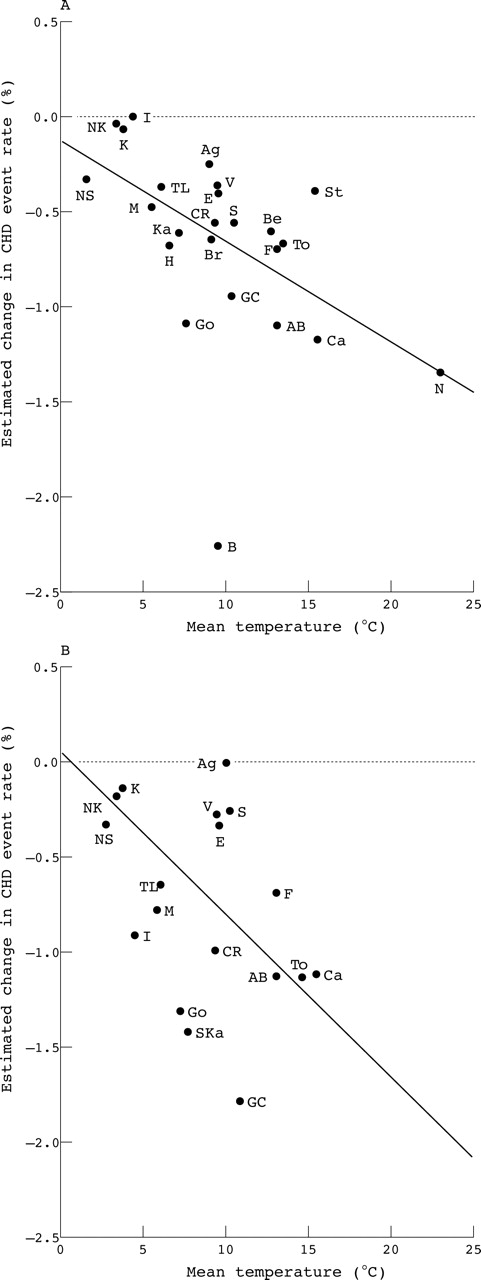
Meta-regression of the estimated change in coronary event rates (per unit increase in average temperature) against mean daily temperature. Estimates from a distributed lag model using the current and previous three days. (A) Model including temperature only; (B) model including temperature and humidity (humidity was not available in every population). Changes in coronary event rates had a linear relation with mean daily temperature. Belfast, and to a lesser extent Stanford, were exceptions to this linear relation. AB, Area Brianza; Ag, Augsburg; Be, Beijing; B, Belfast; Br, Bremen; Ca, Catalonia; CR, Czech Republic; E, East Germany; F, Friuli; GC, Ghent and Charleroi; Go, Gothenburg; H, Halifax; I, Iceland; Ka, Kaunas; Ku, Kuopio; M, Moscow; N, Newcastle; NK, North Karelia; NS, Northern Sweden; St, Stanford; S, Strasbourg; To, Toulouse; TL, Turku/Loimaa; V, Vaud/Fribourg.
Subject level factors associated with coronary events in cold periods
Table 3 shows the percentage of events in the coldest 25% of periods and the adjusted odds ratios for each subject level factor. The table shows estimates from a hierarchical model, including the statistically significant explanatory variables of age, sex, and fatal event (yes/no). MI history did not show a statistically significant effect, the odds for a person with a history of MI having an event in a cold period was 0.99 (95% posterior interval (PI): 0.95, 1.02) compared with a person with no history (after controlling for age, sex, and fatality).
Percentage of coronary events in the coldest 25% of periods* and adjusted odds ratios by sex, age, and fatal event
There was a small overall increase in the number of events in cold periods (26.3% of events in 25.0% of periods). The two youngest age groups (35–44 years) showed no significant increase in events in the cold periods, whereas the older age groups (44–64 years) did show an increase (table 3). After adjusting for sex and event fatality, younger people (35–39 years) were less likely to have their event in a cold period than older people (60–64 years). This result is statistically significant at a 10%, but not a 5%, level. Fatal events (compared with non-fatal events) were more common in cold periods than warmer periods, OR = 1.07 (95% PI: 1.04, 1.10).
The increase was statistically significant in both men and women, although it was significantly greater in women. Averaging over all populations, the odds for women having their events in the cold periods were 1.07 higher than the odds for men (95% PI: 1.03, 1.11). This difference between men and women was greater in populations living in warmer climates (fig 2). The largest effects of sex were in Newcastle (odds ratio (OR) = 1.088) and Belfast (OR = 1.087); the smallest were in North Karelia (OR = 1.053) and Stanford (OR = 1.044), which was a notable outlier.

Regression analysis of the log odds ratio for a cold period event for women (compared with men) against mean daily temperature. A log odds ratio equal to zero represents no increased risk; a positive log odds ratio points to a higher risk for women. All populations showed a higher risk for women, and larger differences in risk between men and women had a linear relation with mean daily temperature. Stanford was an exception to this linear relation. Abbreviations as in figure 1.
DISCUSSION
The analysis of daily rates of coronary events showed that the effect of temperature was not consistent between study populations. In some populations there was little change in coronary event rates with large changes in temperature. In other populations there were statistically significantly more events at low temperatures than at warmer temperatures.
Some of the difference between populations can be understood by noting how the change in coronary event rates (per unit increase in temperature) was generally greater in warmer climates. An explanation for this pattern was suggested by the Eurowinter group, who showed that Finnish populations had higher mean living room temperatures and took more precautionary measures to combat cold (on cold days) than the Athens population.6 The implication is that the effects of cold outdoor temperature are better controlled by people living in cold climates. We found that the populations in the coldest regions (Northern Sweden, North Karelia, and Kuopio) showed little change in coronary event rates with changes in temperatures (table 2). A similar finding was obtained by Donaldson et al in a study of ischaemic heart disease in Siberia.10 The lack of extra events in cold periods in cold climates strongly suggests that the increases in cold periods in warmer climates are preventable.30
A notable outlier to this relation between average temperature and coronary event rates is Belfast (fig 1). In this population the change in rates was much greater than expected. The temperature in Belfast was recorded at 9 am, whereas for all other populations the temperature was an average over the whole day. However, this difference would only move the estimate along the x axis by a maximum of 10°C, and so the result would still be an outlier. A possible explanation is a poorer standard of heating in Belfast than in the rest of Europe. The European household panel survey showed that the proportion of households in the United Kingdom and Ireland that reported being unable to keep their homes adequately warm was more than five times that in Germany.31 Wilkinson et al32 found a link between seasonal variation in deaths from heart attacks and strokes and quality of housing in England. At the level of postcode areas, they found a link between lower indoor home temperature and increased risk of mortality.
A smaller, but perhaps equally interesting, outlier in figure 1 is Stanford, where, in contrast with Belfast, the change with temperature was less than expected. Based on the mean temperature in Stanford, we would expect the change in coronary event rates to be similar to that in Catalonia. Again this result might be explained by home heating: in 2000, 99% of houses in Stanford had some sort of heating system,33 compared with 92% in Catalonia in 2001.34
Contrasting evidence to the heating hypothesis is given by comparing the results from the Eastern and Western European populations in table 2. If home heating affected the risk of events in cold periods then we would expect that Western and Eastern European populations would have different risk patterns. However, the changes in risk with temperature are similar in the pairs of populations with similar outdoor temperatures: Moscow and Turku/Loimaa; East Germany and Bremen; and Kaunas and Gothenburg (model B). A study in Britain similarly found that increases in winter mortality were not associated with the area being deprived or rural.35 It is possible that the personal and social strategies of coping with cold periods (for example, clothes worn, time spent outside) are similar in countries with similar climates, and that this factor is a more important modifier of risk than housing quality. Another possibility is that people in cold climates have become acclimatised to the cold.36
When daily humidity was added to the model the results for temperature scarcely changed, and the effect of humidity was not statistically significant in any population. These results show that coronary events are more closely associated with changes in temperature than changes in humidity. A similar lack of association between humidity and hospital admissions for heart disease was found in persons aged over 65 in America.37
The coldest 25% of periods were associated with an increase in coronary events in all age groups except people aged 35–44. In the coldest periods the odds of fatal events increased more than non-fatal events, suggesting that cold period events are more dangerous than events in warm periods. No increased odds (above the population average) were seen for people with a previous MI. This suggests that the cold temperature mechanism affects both high and low risk groups equally, and hence we find it unlikely that exposure to cold temperatures only brings forward those events that would have happened within the next couple of weeks (the mortality displacement or harvesting hypothesis).23
A hypothesised pathway for the increased risk of coronary events in colder periods is that exposure to cold temperatures triggers rapid release of cathecholamines with consequent rises in vasomotor tone, haemodynamic parameters, platelet aggregability, and other haemathological and endothelial parameters.11,38 When a person comes from warm indoor to cold conditions, the subsequent increase in cardiac workload and oxygen consumption may trigger an acute coronary syndrome.
In this study women showed greater increased odds for their event in cold periods compared with men. A study in Britain showed a similar sized increased risk in all cause mortality in winter for women compared with men (aged⩾75 years).17 In our study the difference in odds between women and men was generally greater in populations with warmer climates (fig 2). This finding coincides with a result from the Eurowinter group, that women living in warmer climates were more likely to wear skirts at colder temperatures than women in colder climates.6 However, there are also physiological sex differences in thermoregulation, including longer recovery time to body temperature after physical exercise among women, which could partly mediate the increased risks in women.39 In our results from Stanford, the difference in odds between men and women was much less than expected. Stanford was also an outlier to the relation between average temperature and change in coronary event rate (fig 1). This makes Stanford worth investigating further to compare the protective measures taken by its residents in winter compared with those taken by the residents of southern Europe and Australia.
What this paper adds
-
Coronary events are more common in cold weather but the excess is not greater in people with a history of heart disease.
-
The increased risk in winter is greater in warmer climates.
-
The risk for women in winter increases more than the risk for men.
Policy implications
Policy makers in warm climates should not be complacent about winter coronary events. Public warnings to keep warm on comparatively cold days may help to reduce the winter increases in events.
A weakness of this study is that, compared with most others on this topic, the total number of coronary events is small. This is because the data were from event registers rather than routine data collections. However, unlike most other studies we had a confirmed diagnosis and detailed information on each individual event, and data collection methods were standardised across populations. This gave us greater accuracy at the population level, and the ability to explore differences at the individual level. The disadvantage of the logistic model was that the effect of heat waves was ignored, although the effects of extreme heat were smaller than the effects of cold in these populations. Also, the estimates of the logistic model may be confounded with seasonal changes other than temperature.
Another weakness is that we did not control for air pollution, and increases in air pollution have been shown to correlate with the risk of a cardiovascular event,40 and the seasonal change in risk.41 Also we were not able to control for respiratory infections, which are common in cold and damp conditions and may precipitate a coronary event.28
We have described the relation between cold periods and coronary events in a number of populations worldwide which have varied annual temperatures. We were able to show that the size of the event excess at cold temperatures is related to average annual temperature. This suggests that the excess is preventable and is most probably attributable to poor protective measures taken on cold days.
Acknowledgments
We thank the British Atmospheric Data Centre, UK Meteorological Office, Spanish National Metereological Institute and the Hunter Valley Research Foundation for providing their weather data free of charge. We also thank the US National Climatic Data Center, the Finnish Meteorological Institute, and the Meteorological Service of Canada for providing their weather data at a reduced cost. Thanks to Joel Schwartz, Debbie Lawlor, Hugh Tunstall-Pedoe, Gordon Flowerdew, Vivienne Mawson, and William Keatinge for their helpful comments in the preparation of this paper.
REFERENCES
Supplementary materials
The appendix is available as a downloadable PDF (printer friendly file).
If you do not have Adobe Reader installed on your computer,
you can download this free-of-charge, please Click hereFiles in this Data Supplement:
- [view PDF] - Web-only list of participating centres in the MONICA project.
Footnotes
-
↵* Participating centres listed on the journal web site (http://www.jech.com/supplemental).
-
Funding: the MONICA centres were funded by regional and national governments, research councils, charities, and other local sources. Central coordination was the responsibility of the World Health Organisation (WHO), assisted by the MONICA Data Centre (MDC) at the National Public Health Institute (KTL) in Helsinki. Initial funding for the MDC came from WHO, KTL, and NHLBI (USA) and later from two BIOMED grants from the European Commission. The latter supported completion of the project, along with grants from pharmaceutical companies and medical charities. This work received funding by the National Health and Medical Research Council of Australia (grant numbers 100954 and 252834).
-
Competing interests: none declared.
-
Ethics approval: MONICA investigators had to satisfy the local requirements for ethical research in each population in which they worked.19