Article Text

Abstract
Objective: To investigate income gradients in motor vehicle traffic injury hospitalisation for vehicle occupants and pedestrians/cyclists among children in urban and rural Canada.
Design: Four years (2001/02–2004/05) of acute-care hospitalisation discharge records for children aged 0–19 years were analysed. International Classification of Disease codes were used to determine hospitalisations due to motor vehicle traffic incidents for occupants and pedestrians/cyclists. Rates of injury (per 10 000 person years) were calculated by neighbourhood income quintiles for urban and rural areas.
Results: Among children (0–19 years), rates of vehicle occupant hospitalisation were higher in rural (5.07, 95% CI 4.90 to 5.25) than urban areas (2.08, 95% CI 2.03 to 2.14). In rural areas, children from lower income neighbourhoods had higher vehicle occupant hospitalisation rates than those from the richest neighbourhoods (5.52, 95% CI 5.13 to 5.93 vs 4.30, 95% CI 3.97 to 4.66). In urban areas vehicle occupant hospitalisation rates were similar among children from the poorest and richest neighbourhoods—but higher among children from middle income neighbourhoods. In urban areas, but not rural areas, the hospitalisation rate for pedestrians/cyclists systematically increased with decreasing neighbourhood income. In urban areas the pedestrian/cyclist hospitalisation rate was four times higher for children from the poorest (1.40, 95% CI 1.25 to 1.57) than from the richest (0.34, 95% CI 0.28 to 0.43) neighbourhoods.
Conclusions: While vehicle occupant and pedestrian/cyclist motor vehicle traffic injuries are more frequent among children from lower income neighbourhoods, gradients are most pronounced for pedestrians/cyclists in urban areas.
Statistics from Altmetric.com
Road-traffic incidents are the leading cause of death among children in high income countries and the third leading cause of death among children from middle and low income countries.1 Motor vehicle traffic incidents are the leading cause of injury death among Canadian children aged 0–14 years, comprising 36.4% of all injury deaths; they are responsible for 19% of all paediatric injury hospitalisations.23 As such, motor vehicle traffic incidents—occurring on public roads and highways—are an important public health problem.
For many health outcomes, a social gradient exists whereby each group lower on the social hierarchy has lower levels of health and increased mortality.4–6 These health outcomes are shaped, in part, by the contexts in which individuals reside.7–9 International and Canadian studies have shown that children in lower income neighbourhoods have higher rates of injury mortality and morbidity.10–12
Support for the existence of neighbourhood income gradients in motor vehicle traffic injury among children at a national level has not been systematically examined.13 Gradients are important because they demonstrate that it is not just conditions of extreme poverty that expose children to risk of morbidity and mortality. International studies focusing on children have found higher rates of motor vehicle traffic injuries among vehicle occupants and pedestrians/cyclists in lower income neighbourhoods, but one study found lower rates of vehicle occupant injury in lower income neighbourhoods.14–17 Among children presenting to one Canadian hospital, the rate ratio for traffic injuries was 1.51 for children from the lowest income neighbourhoods compared to the highest income neighbourhoods.18 In a study of one Canadian city, hospitalisation rates for child pedestrians were six times higher in lower income neighbourhoods than higher income neighbourhoods.19 Existing studies of injury hospitalisation and neighbourhood income are often limited to a single city or hospital and do not use national data, which limits the generalisability of findings.14–19 Furthermore, most studies either combine pedestrians/cyclists and vehicle occupants into a single category or do not simultaneously examine both pedestrians/cyclists and vehicle occupants.15–19
It is important to separate traffic incidents by vehicle occupants and pedestrians/cyclists because the mechanisms through which neighbourhood income influences risk may differ.13 Higher income neighbourhoods may have lower vehicle occupant injury rates due to access to safer automobiles, safer driving practices, or safer public roads. Lower income neighbourhoods may have higher rates of pedestrian/cyclist injuries because of less safe roads and less consistent safety practices (eg, helmet use).20–22
While research simultaneously examining neighbourhood income gradients in motor vehicle traffic incidents by urban and rural residence is lacking, there is substantial evidence from international studies that injury rates among children are higher in rural than in urban areas.23–27 An Australian study found that the injury rate for motor vehicle occupants was over twice as high for children in rural areas than urban areas.23 Similarly, children in rural areas of a US state had twice the rate of motor vehicle passenger death as those in urban areas.24 In a study of one Canadian province, rates of motor vehicle occupant injury among children were approximately three times higher in rural than urban areas.25 Furthermore, Canadian children living in rural areas have more bicycle-related head injuries than children in urban areas.27 Yet, most existing studies do not examine neighbourhood income gradients in rural areas and do not examine both motor vehicle occupants and pedestrians/cyclists.
Urban and rural environments may expose children to differential risks of motor vehicle traffic injury. Vehicle occupant injuries may be higher in rural than urban areas due to longer travel distances and less safe driving conditions.2829 Yet, pedestrian/cyclist injuries may be greater in urban than rural areas as children may be more likely to walk/cycle to local destinations. Because automobile ownership is often a necessity in rural areas, neighbourhood income gradients in vehicle occupant injuries may be steeper than in urban areas. In urban areas, neighbourhood income gradients may be attenuated because car ownership rates may be less in lower income neighbourhoods due to the availability of public transit and local services. For pedestrians/cyclists, neighbourhood income gradients may be steeper in urban than rural areas because children in lower income urban neighbourhoods may be more likely to walk/cycle to local destinations than children in affluent neighbourhoods. Rural areas, regardless of income, may lack destinations to walk/cycle to, thereby attenuating gradients.
Thus, the purpose of this paper is to examine: (1) neighbourhood income gradients in motor vehicle traffic injury hospitalisation separately for vehicle occupants and pedestrians/cyclists among children; and (2) whether neighbourhood income gradients for injury hospitalisation differ in urban and rural areas.
METHODS
The Health Person Oriented Information (HPOI) database is maintained by Statistics Canada; it is a subset of the Hospital Morbidity Database which contains discharge records for each hospital stay in Canada. HPOI only includes records linked to a valid person identifier. Annually, approximately 13% of hospital morbidity records cannot be linked at the person level: 10% are records for newborns and 3% contain an invalid identifier (eg, non-resident).30 HPOI data analysed were for children aged 0–19 years discharged from acute-care institutions during the fiscal years (April–March) 2001/02–2004/05. A total of 1 173 422 linked discharge records from residents of the 10 Canadian provinces were analysed.
Injuries were classified using the International Classification of Disease, 9th Revision (ICD-9), 9th Revision Clinical Modification (ICD-9-CM), and 10th Revision Canadian (ICD-10-CA) as not all Canadian provinces used the same version during the study period. ICD codes were analysed in the version submitted.
If a single injury had multiple discharge records (eg, patient transferred between facilities), a single “injury episode” was constructed to prevent counting an injury multiple times. ICD codes from the first discharge were used to classify the injury, as those appearing on subsequent discharges may have occurred during the hospital stay or could reflect differences in coding practices. Thus, data presented represent the number of “injury episodes”.
Two categories of unintentional injuries were examined: motor vehicle occupants injured in a traffic incident and pedestrians/cyclists injured in a motor vehicle traffic incident. A traffic incident is any vehicle incident (eg, collision) occurring on a public highway and excludes those in places such as parking lots, driveways and farms.31 The first category (vehicle occupants) refers to drivers and passengers of motorised vehicles (such as motorcycles, cars, trucks, heavy transport vehicles, buses or other unspecified motor vehicles) injured in a traffic incident. The second category (pedestrians/cyclists), refers to pedestrians/cyclists injured in a traffic collision with a motor vehicle. Pedestrians are those injured on foot as well as on roller-skates, skateboards or scooters, or in a baby carriage.31 A transition matrix was used to classify the injuries in the ICD-9/-CM and ICD-10.32
The 2001 census was used to derive “neighbourhood” income data based on Dissemination Areas (DA), which are small geographic areas with a population between 400 and 700.33 Hospital discharge records include a six-digit postal code indicating the patient’s place of residence and the Postal Code Conversion File+ (PCCF+, versions 4G/H) was used to determine the corresponding DA.34 For the province of Quebec, records only include the first three digits of the patient’s postal code, resulting in a less precise DA assignment. Quebec was included in all analyses as its exclusion did not significantly change results (available from the authors on request).
Following a method used elsewhere, neighbourhood income quintiles were constructed based on the average income per “single-person equivalent” which adjusts for household size.35 Each household was assigned a “single-person equivalent” multiplier based on household size. The income per “single-person equivalent” was calculated by dividing the total household income of the DA by the total number of “single-person equivalents”. To account for differences in the cost of living across Canada, DA income quintiles were constructed within each Census Metropolitan Area (CMA) or Census Agglomeration (CA) and remaining areas in each province. CMAs consist of one or more municipalities centred on an urban core with a population of at least 100 000; CAs have an urban core of at least 10 000.36 Income was suppressed in DAs with a population below 250 and was imputed from surrounding DAs. In total, 274 hospitalisations (2.3%) were excluded because DA income data could not be assigned. In 175 cases (1.5%) this was due to a missing or invalid postal code, while in 99 cases (0.8%) income data could not be imputed due to suppression in surrounding DAs. DAs in CMAs and CAs were classified as urban and those outside as rural. There were 9257 DAs with motor vehicle traffic injury hospitalisations included in the study.
Analysis
Hospitalisation rates for each of the four years were age-standardised, based on five-year age intervals (0–4, 5–9, 10–14, 15–19) to the 2001 census, with the denominator for the population-at-risk derived from the 2001 and 2006 census. The child population for each year (2001–04) was interpolated to the mid-point of each fiscal year (October), yielding a final denominator that was the sum of the interpolated populations across the four years. For each neighbourhood income quintile, rates were calculated by age group (0–9 and 10–19 years) and by sex; 95% CIs were based on a Poisson distribution.
The Wald χ2 statistic was used to determine if the injury rate of the richest neighbourhood income quintile (5) was significantly different from the other quintiles using an alpha level of p<0.05.37 A linear trend test (LTT) was used to determine if there was a linear or graded relationship between neighbourhood income quintiles and hospitalisations.38 All analyses were conducted using SAS (V.9.1).
RESULTS
Table 1 presents descriptive statistics for injury hospitalisations. Across the study years (2001/02–2004/05) there were 11 676 hospitalisations due to motor vehicle traffic incidents among children aged 19 years and younger. Table 2 presents age-standardised hospitalisation rates (per 10 000) for occupants and pedestrians/cyclists injured in a motor vehicle traffic incident by sex and age group. Among children 0–19 years, the rate of injury hospitalisation for vehicle occupants was 2.72 (95% CI 2.66 to 2.78); the rate for pedestrians/cyclists was 1.05 (95% CI 1.01 to 1.09). Rates of hospitalisation for vehicle occupants and pedestrians/cyclists were higher for males than females and higher for older children (10–19 years) than younger children (0–9 years). For both vehicle occupants and pedestrians/cyclists, injury hospitalisation rates generally declined with increasing neighbourhood income. For females a significant linear trend was apparent in which vehicle occupant injury rates increased with decreasing income quintile. Injury hospitalisation rates for pedestrians/cyclists decreased with increasing neighbourhood income for both sexes; this gradient was confirmed by the LTT. Young children (0–9 years) living in the poorest quintile had a pedestrian/cyclist injury hospitalisation rate that was three times greater than that for those living in the richest quintile (1.32, 95% CI 1.19 to 1.46 vs 0.40, 95% CI 0.33 to 0.48).
Vehicle occupant injury hospitalisation rates were over twice as high for children in rural areas than for those in urban areas (5.07, 95% CI 4.90 to 5.25 vs 2.08, 95% CI 2.03 to 2.14). Figure 1 presents rates of vehicle occupant injury by neighbourhood income quintile for urban and rural areas. For children in urban areas, those living in middle income neighbourhoods (quintiles 2–4) had a higher vehicle occupant hospitalisation injury rate than that for those living in the richest neighbourhoods. Among males in urban areas, the vehicle occupant injury hospitalisation rate was similar for those from the richest and poorest neighbourhoods; however, females from the poorest neighbourhoods had injury hospitalisation rates that were higher than those from the richest neighbourhoods. In rural areas, children from lower income neighbourhoods (quintiles 1–4) had higher rates of injury hospitalisation than those from the richest neighbourhood. In urban areas, older children (10–19 years) from middle income neighbourhoods (quintiles 2–4) had higher vehicle occupant injury hospitalisation rates, while in rural areas older children from neighbourhood income quintiles 1–4 had higher rates than the richest quintile.

Hospitalisation rates for vehicle occupants injured in a motor vehicle traffic incident by neighbourhood income quintile and urban/rural residence, Canadian children aged 0–19 years, 2001/02–2004/05. Error bars indicate 95% CIs. *Indicates neighbourhood income quintile rate significantly different from quintile 5 (richest) at p<0.05.
Pedestrian/cyclist motor vehicle injuries were only slightly higher for children in urban areas (1.07, 95% CI 1.03 to 1.12) than for those in rural areas (0.96, 95% CI 0.89 to 1.04). Figure 2 shows that pedestrian/cyclist injury hospitalisation rates in urban areas systematically increased with decreasing neighbourhood income but rural areas did not exhibit a similar pattern. Confirming this pattern, the LTT was significant for all age and sex groupings across urban quintiles but was not significant across rural quintiles (data not shown). In urban areas, the rate of pedestrian/cyclist motor vehicle injury hospitalisations was four times higher for young children (0–9 years) from the poorest neighbourhoods than for those from the richest neighbourhoods (1.40, 95% CI 1.25 to 1.56 vs 0.34, 95% CI 0.28 to 0.43). In rural areas, although no significant trend was evident, injury hospitalisation rates for pedestrians/cyclists were higher for children from the poorest neighbourhoods than for those from the richest neighbourhoods.
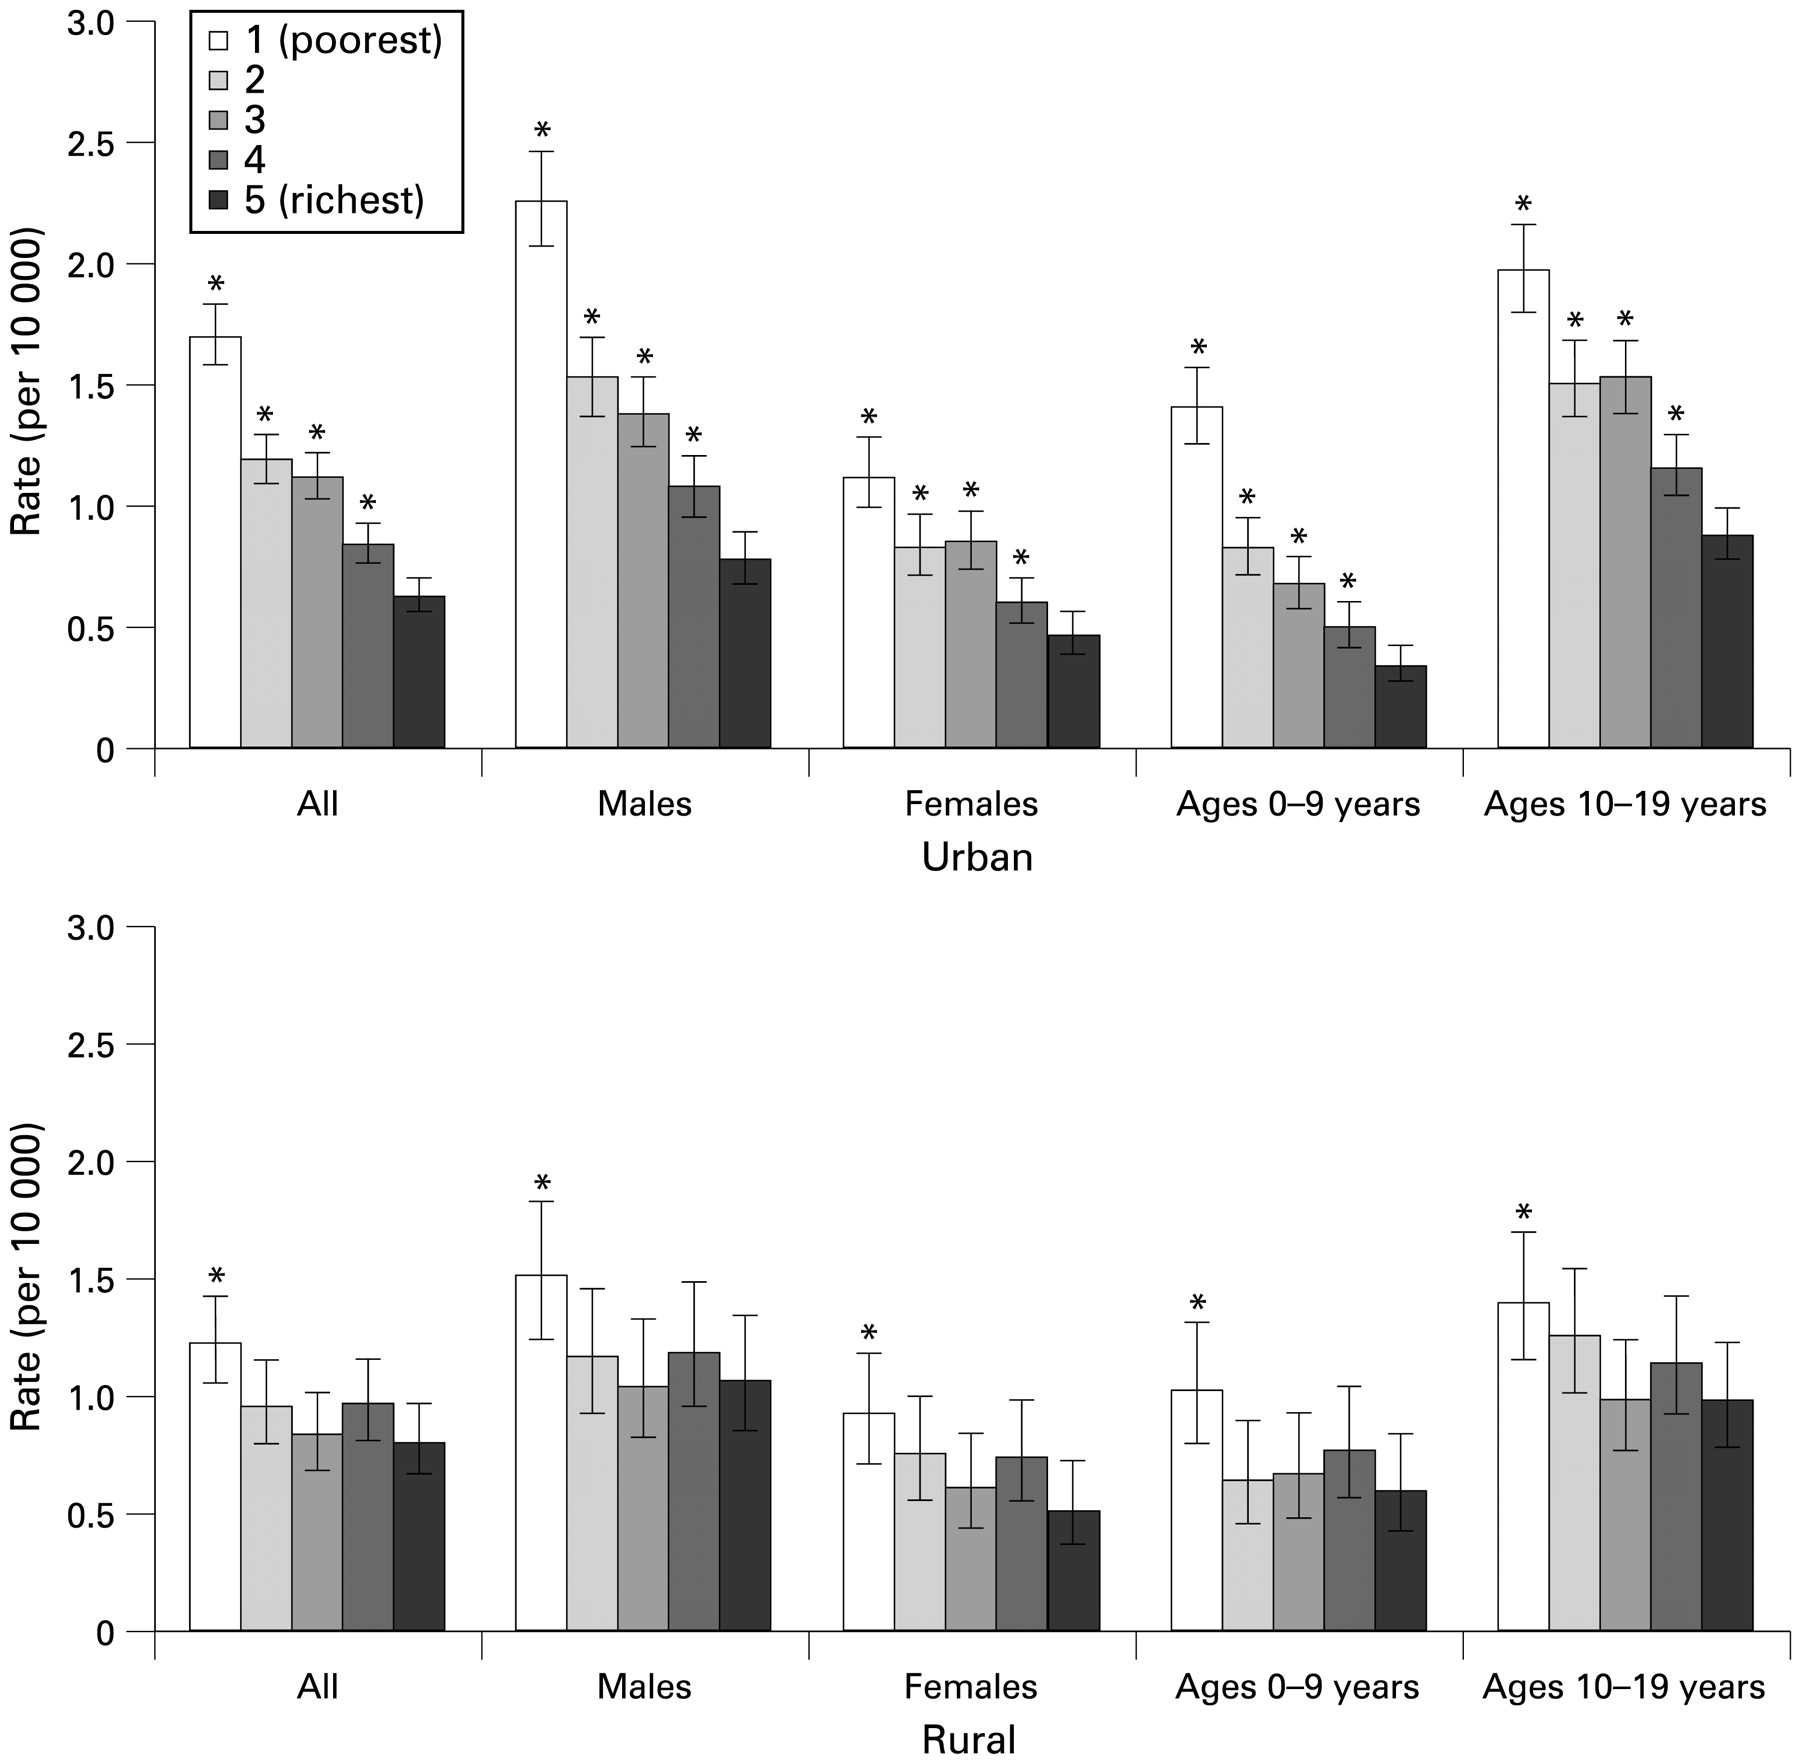
Hospitalisation rates for pedestrians/cyclists injured in a motor vehicle traffic incident by neighbourhood income quintile and urban/rural residence, Canadian children aged 0–19 years, 2001/02–2004/05. Error bars indicate 95% CIs. *Indicates neighbourhood income quintile rate significantly different from quintile 5 (richest) at p<0.05.
DISCUSSION
The findings of this study show that the burden of motor vehicle traffic injury hospitalisation is not shared equally among all children. Disparities in injury rates by income quintiles and by urban and rural areas suggest that motor vehicle traffic injuries are related to the environments in which children live. Similar to other international studies, rates of vehicle occupant injury were higher in rural than in urban areas.232439 These higher rates may reflect greater travel distances, less safe driving conditions, and reduced access to emergency services in rural areas. Evidence suggests that seat belt use is lower in rural areas, which may increase the risk of motor vehicle occupant injury.2840 Moreover, in rural areas, children living in the poorest neighbourhoods had a higher rate of vehicle occupant injury hospitalisation than those in richer neighbourhoods.
In urban areas no difference was found in the vehicle occupant injury hospitalisation rate among children from the highest and lowest income neighbourhoods, but children from middle income neighbourhoods had higher rates. Lower automobile ownership among families in low income urban neighbourhoods may explain the finding of similar injury rates between the highest and lowest income quintiles. In contrast, families in middle income neighbourhoods may have access to automobiles but factors such as less safe vehicles or less safe driving practice may contribute to higher injury rates than in higher income neighbourhoods. Furthermore, middle income urban neighbourhoods may be located in suburban areas which often require greater travel distances.
This study found a gradient between pedestrian/cyclist motor vehicle injury and neighbourhood income quintiles in urban areas; similar finding have been reported elsewhere.14–1719 Higher rates in lower income neighbourhoods may be explained by a number of factors including environmental characteristics, risk, and safety behaviours. Lower income neighbourhoods may have more hazards such as high traffic flow, poor quality sidewalks, and fewer safe bicycle paths and cross-walks, placing child pedestrians/cyclists at increased risk of injury.41–43 Children in lower income neighbourhoods may be more likely to walk/cycle on busy public roads, and may be less likely to adhere to safety practices such as bicycle helmet use, and have few organised safe routes for walking to school.224445 Continued research is needed to further our understanding of the specific mechanisms and pathways leading to higher rates of pedestrian/cyclist injury in lower income urban neighbourhoods. Future research should use international datasets to replicate the findings reported in this study.
In rural areas a systematic social gradient between income quintiles and pedestrians/cyclists struck by motor vehicles was not evident, though those living in the poorest income quintile had a higher injury rate than the richest. In rural areas, greater distances to travel may mean that children are less likely to be pedestrians or cyclists on public roads and highways.
In this study child pedestrian/cyclist motor vehicle injuries increased with decreasing neighbourhood income in urban areas. Yet, rural areas appear to be at greatest risk for vehicle occupant injuries, particularly low income rural neighbourhoods. These results suggest that prevention strategies designed to reduce child pedestrian injury rates should target children from economically disadvantaged urban and rural neighbourhoods, while strategies targeting the reduction of motor vehicle occupant injuries should prioritise lower income rural areas followed by middle income urban neighbourhoods. Such strategies may include education, road infrastructure, crosswalks, and bicycle lanes, as well as the enforcement of safety practices such as the use of helmets, car seats, and seat belts.
Strengths and limitations
The major strength of this study is the availability of national acute-care hospitalisation data for Canadian children. Information on each patient’s place of residence allowed for an examination of injury hospitalisation rates by neighbourhood income and by urban and rural location. Because Canadian children are universally enrolled in a public healthcare system, differential access to health care services based on ability to pay should not influence results. The accuracy of the hospitalisation data used was assessed in a re-abstraction study which found a discrepancy rate for medical condition diagnosis codes to be between 5% and 7%.46 The presented rates of injury are likely conservative because children with the most severe consequences (eg, who died before hospital admission or hospitalised out of province) were excluded. Furthermore, data were not available for injuries treated in doctors’ offices or emergency rooms. However, such injuries are likely to be less severe and may have fewer long term consequences. Another limitation is that income was defined at the neighbourhood level using census data as individual level income data were not available. Yet studies which have included both individual and area level income have found that living in a deprived neighbourhood independently increases the risk of injury over and above individual income.124748 In this study neighbourhoods were assigned based on the patient’s place of residence; the location of the injury episode was not known. Neighbourhoods were classified as urban or rural; future research should examine more detailed categories, such as suburban. Finally, the assignment of income quintiles for Quebec was less precise than other provinces because the six-digit postal code was not available. Assignment of income quintiles was less precise in rural areas as one postal code can cover several DAs.
CONCLUSIONS
This study investigated relationships between neighbourhood income quintiles and motor vehicle incidents, including both occupant and pedestrian/cyclist injuries occurring in urban and rural Canada. In urban areas decreasing neighbourhood income was associated with increasing injury hospitalisations for pedestrians/cyclists struck by a motor vehicle. This relationship was most pronounced for young children (0–9 years), where the injury hospitalisation rate for pedestrians and cyclist was four times as high among those from the poorest quintile as the richest quintile. In rural areas children from the poorest income quintile had higher rates of motor vehicle traffic injury hospitalisations for both vehicle occupants and pedestrians/cyclists. This study provides evidence of inequities in motor vehicle traffic injury hospitalisation among Canadian children.
What is already known on this topic
Motor vehicle traffic injury is a leading cause of death and morbidity among children.
Motor vehicle traffic incident injury rates are higher in rural than urban areas.

Acknowledgments
We would like to acknowledge the contributions of Russell Wilkins, Michelle Rotermann and Helen Johansen from the Health Information and Research Division, Statistics Canada.
REFERENCES
Footnotes
Contributors: LO conceived the project, conducted the analyses and prepared the manuscript. DK assisted with the conceptualisation of this project, interpretation of the findings and the preparation and editing of the manuscript.
Funding: LO was funded by a Statistics Canada Research Fellowship.
Competing interests: None.