
Abstract
Population-level analyses often use average quantities to describe heterogeneous systems, particularly when variation does not arise from identifiable groups1,2. A prominent example, central to our current understanding of epidemic spread, is the basic reproductive number, R0, which is defined as the mean number of infections caused by an infected individual in a susceptible population3,4. Population estimates of R0 can obscure considerable individual variation in infectiousness, as highlighted during the global emergence of severe acute respiratory syndrome (SARS) by numerous ‘superspreading events’ in which certain individuals infected unusually large numbers of secondary cases5,6,7,8,9,10. For diseases transmitted by non-sexual direct contacts, such as SARS or smallpox, individual variation is difficult to measure empirically, and thus its importance for outbreak dynamics has been unclear2,10,11. Here we present an integrated theoretical and statistical analysis of the influence of individual variation in infectiousness on disease emergence. Using contact tracing data from eight directly transmitted diseases, we show that the distribution of individual infectiousness around R0 is often highly skewed. Model predictions accounting for this variation differ sharply from average-based approaches, with disease extinction more likely and outbreaks rarer but more explosive. Using these models, we explore implications for outbreak control, showing that individual-specific control measures outperform population-wide measures. Moreover, the dramatic improvements achieved through targeted control policies emphasize the need to identify predictive correlates of higher infectiousness. Our findings indicate that superspreading is a normal feature of disease spread, and to frame ongoing discussion we propose a rigorous definition for superspreading events and a method to predict their frequency.
Main
For sexually transmitted and vector-borne diseases, host contact rates have long served as surrogates for individual infectiousness3,12,13,14, leading to the assertion of a general ‘20/80 rule’ (whereby 20% of cases cause 80% of transmission13) and to the influential concept of high-risk ‘core groups’3,12,13. For directly transmitted infections, however, the overall infectiousness of each case—that is, the number of other individuals infected during the infectious lifetime of a single individual—arises from a complex mixture of host, pathogen and environmental factors (see Supplementary Notes). Consequently, the degree of infectiousness is distributed continuously in any population4,7,11,15,16 and, crucially, distinct risk groups often cannot be defined a priori2,11. This impedes the conventional approach to adding heterogeneity to epidemic models, in which populations are divided into homogeneous subgroups2,3,4,17. Research on continuous individual variation in infectiousness for directly transmitted infections has been largely restricted to within-household transmission18,19, or to variation in infectious period20,21 or social network22. Some recent studies have used contact tracing data to investigate specific questions in light of observed variation8,16, but a broad understanding of the role of individual variation in outbreak dynamics is lacking.
As a theoretical basis, we introduce the ‘individual reproductive number’, ν, as a random variable representing the expected number of secondary cases caused by a particular infected individual. Values for ν are drawn from a continuous probability distribution with population mean R0 that encodes all variation in infectious histories of individuals, including properties of the host and pathogen and environmental circumstances. In this framework, superspreading events (SSEs) are not exceptional events9, but important realizations from the right-hand tail of a distribution of ν (refs 7, 15). Stochastic effects in transmission are modelled using a Poisson process4, so that the number of secondary infections caused by each case, Z, is described by an ‘offspring distribution’ Pr(Z = k) where Z∼Poisson(ν).
By considering three possible distributions of ν, we generate three candidate models for the offspring distribution: (1) in generation-based models neglecting individual variation, ν = R0 for all cases, yielding Z∼Poisson(R0); (2) in differential-equation models with homogeneous transmission and constant recovery rates, ν is exponentially distributed, yielding Z∼geometric(R0); (3) in a more general formulation, we let ν be gamma-distributed with mean R0 and dispersion parameter k, yielding Z∼negative binomial(R0,k) (ref. 23). The negative binomial model includes the conventional Poisson (k → ∞) and geometric (k = 1) models as special cases. It has variance R0(1 + R0/k), so smaller values of k indicate greater heterogeneity.
We gathered empirical offspring distributions from detailed contact tracing or surveillance data sets, and challenged the candidate models using model selection techniques24 (see Supplementary Notes). For SARS outbreaks in Singapore and Beijing, the negative binomial model is unequivocally favoured (Fig. 1a and Supplementary Table 1). Conventional models assuming homogeneity cannot reproduce the observed transmission patterns. For the Singapore outbreak, the maximum-likelihood estimate k̂ is 0.16 (90% confidence interval 0.11–0.64), indicating an underlying distribution of ν that is highly overdispersed (Fig. 1a, inset). According to this analysis, the great majority of SARS cases in Singapore were barely infectious (73% had ν < 1) but a small proportion were highly infectious (6% had ν > 8). This is consistent with field reports from SARS-afflicted regions5,6 but contrasts with published SARS models9,10,25,26.
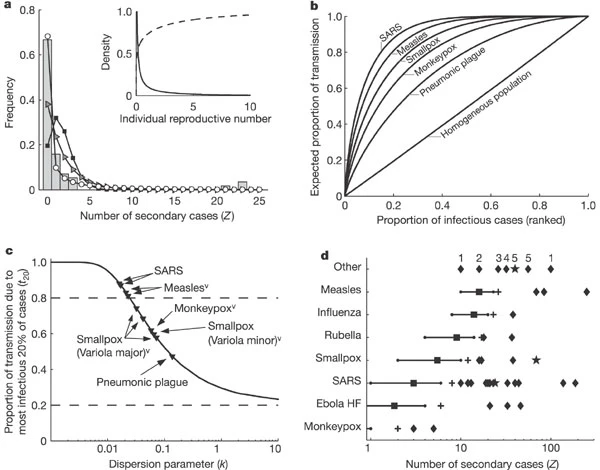
a, Transmission data from the SARS outbreak in Singapore in 2003 (ref. 5). Bars show observed frequency of Z, the number of individuals infected by each case. Lines show maximum-likelihood fits for Z∼Poisson (squares), Z∼geometric (triangles), and Z∼negative binomial (circles). Inset, probability density function (solid) and cumulative distribution function (dashed) for gamma-distributed ν (corresponding to Z∼negative binomial) estimated from Singapore SARS data. b, Expected proportion of all transmission due to a given proportion of infectious cases, where cases are ranked by infectiousness. For a homogeneous population (all ν = R0), this relation is linear. For five directly transmitted infections (based on k̂ values in Supplementary Table 1), the line is concave owing to variation in ν. c, Proportion of transmission expected from the most infectious 20% of cases, for 10 outbreak or surveillance data sets (triangles). Dashed lines show proportions expected under the 20/80 rule (top) and homogeneity (bottom). Superscript ‘v’ indicates a partially vaccinated population. d, Reported superspreading events (SSEs; diamonds) relative to estimated reproductive number R (squares) for twelve directly transmitted infections. Lines show 5–95 percentile range of Z∼Poisson(R), and crosses show the 99th-percentile proposed as threshold for SSEs. Stars represent SSEs caused by more than one source case. ‘Other’ diseases are: 1, Streptococcus group A; 2, Lassa fever; 3, Mycoplasma pneumonia; 4, pneumonic plague; 5, tuberculosis. R is not shown for ‘other’ diseases, and is off-scale for monkeypox. See Supplementary Notes for details.
Comparing results for eight directly transmitted infections reveals the differing degree of individual variation among diseases and outbreak settings (Fig. 1b, c and Supplementary Tables 1, 2). The Poisson offspring distribution is almost always strongly rejected. The geometric model has considerable support for several data sets, which indicates significant individual variation in transmission rates because real infectious periods are less dispersed than the exponential distribution20,21. The negative binomial model is selected decisively for several data sets, and enables comparative study of diseases through the dispersion parameter. Like SARS, measles in highly vaccinated populations shows high variation in two surveillance data sets, with narrow confidence intervals excluding the conventional models (note that heterogeneous vaccination coverage is an important environmental factor contributing to this pattern). Monkeypox and smallpox viruses show intermediate variation, consistent across multiple data sets, and pneumonic plague transmission is slightly less variable. Data limitations prevent definitive conclusions for other diseases. Comparing our findings to the 20/80 rule proposed for sexually transmitted and vector-borne diseases13, no general rule emerges but the core principle of heterogeneous transmission is certainly supported (Fig. 1c).
Numerous reports of superspreading events provide further evidence for variation in ν. We reviewed 37 published accounts of SSEs for 11 directly transmitted infections (Fig. 1d; see Supplementary Notes). Unrecognized or misdiagnosed illness is the most common cause of these SSEs, followed by alternative modes of spread (especially airborne), high contact rates, and co-infections that aid transmission. High pathogen load or shedding rates are occasionally implicated, but are rarely measured. A consistent and general definition of SSEs is currently lacking—for SARS, an SSE has been arbitrarily defined as Z ≥ 8 (ref. 6), Z ≥ 10 (ref. 5), Z > 10 (ref. 26) or ‘many more than the average number’9, and different thresholds are surely needed for measles (R0∼11–18; ref. 3) or monkeypox (R0 < 1).
We propose this general protocol for defining a superspreading event: (1) estimate the effective reproductive number, R, for the disease and population in question; (2) construct a Poisson distribution with mean R, representing the expected range of Z due to stochasticity without individual variation; (3) define an SSE as any infected individual who infects more than Z(n) others, where Z(n) is the nth percentile of the Poisson(R) distribution. A 99th-percentile SSE is then any case causing more infections than would occur in 99% of infectious histories in a homogeneous population (Fig. 1d). This approach complements a priori identification of potential superspreaders when that is feasible, as for sexually transmitted diseases (where promiscuity drives risk)3,12. In addition, the definition enables prediction of the frequency of SSEs once R0 and k have been estimated (Supplementary Fig. 1)—an outstanding challenge in emerging disease epidemiology8,9.
To assess the effect of individual variation on disease outbreaks, we analyse a branching process model with negative binomial offspring distribution, corresponding to gamma-distributed ν (Fig. 2a; see Supplementary Notes). Of primary interest is the probability of stochastic extinction, q, after the introduction of a single infected individual (Fig. 2b). For R0 < 1, all invasions die out, as in standard models. For R0 > 1, increased variation strongly favours extinction8. For example, if R0 = 3 then q = 0.06 under the assumption of homogeneous ν (k → ∞), or q = 0.33 if k = 1, but if k = 0.16 (as estimated for SARS) then q = 0.76. Extinction risk rises owing to a higher proportion of non-transmitting cases when ν is overdispersed (Figs 1a, 2a and Supplementary Fig. 2a). This effect thwarts invasion by diseases that are very potent spreaders on average: for arbitrarily high R0, q → 1 as k → 0 (Supplementary Fig. 2b). The expected number of cases before extinction is hardly affected by k (Supplementary Fig. 2c), because low-k outbreaks that fail probably lacked SSEs and thus resemble homogeneous outbreaks with lower R0. Accordingly, when individual variation is large, extinction occurs rapidly or not at all (Supplementary Fig. 2d).

a, The individual reproductive number ν is drawn from a gamma distribution with mean R0 and dispersion parameter k. Probability density functions are shown for six gamma distributions with R0 = 1.5 (‘k = Inf’ indicates k → ∞). b, Probability of stochastic extinction of an outbreak, q, versus population-average reproductive number, R0, following introduction of a single infected individual. The value of k increases from top to bottom (values and colours as in a). c, Growth of simulated outbreaks with R0 = 1.5 and one initial case, conditional on non-extinction. Boxes show median and interquartile range (IQR) of the first disease generation with 100 cases; whiskers show most extreme values within 1.5 × IQR of the boxes, and crosses show outliers. Percentages show the proportion of 10,000 simulated outbreaks that reached the 100-case threshold (roughly 1 - q).
For outbreaks avoiding stochastic extinction, epidemic growth rates strongly depend on variation in ν (Fig. 2c and Supplementary Fig. 2e, f). Diseases with high individual variation show infrequent but explosive epidemics after introduction of a single case. This pattern recalls SARS in 2003, for which many settings experienced no epidemic despite unprotected exposure to SARS cases27,28, whereas a few cities suffered explosive outbreaks8,9,10,15,26. Our results, using k̂ = 0.16 for SARS, explain this simply by the presence or absence of high-ν individuals in the early generations of each outbreak6. In contrast, conventional models (with k = 1 or k → ∞) cannot simultaneously generate frequent failed invasions and rapid growth rates without additional, subjective model structure.
Disease control interventions could increase or decrease individual variation in infectiousness. Infected individuals might reduce their number of non-essential contacts, or governments might impose quarantine or isolation on particular individuals. Here we explore several idealized cases theoretically, for an outbreak with offspring distribution Z∼negative binomial(R0,k) before control (see Supplementary Notes). Consider the effect of control effort c, where c = 0 reflects no control and c = 1 reflects complete blockage of transmission. Under population-wide control, the infectiousness of every individual in the population is reduced by a factor c (that is,  for all individuals). Under random, individual-specific control, a proportion c of infected individuals (chosen at random) is traced and isolated completely such that they cause zero infections (that is
  for a proportion c of infected individuals, and
  for the rest). Individual-specific control raises the degree of heterogeneity in the outbreak as measured by the variance-to-mean ratio of Z, whereas population-wide control reduces heterogeneity. Both approaches yield effective reproductive number R = (1 - c)R0, so the threshold control effort for guaranteed disease extinction is c ≥ 1 - 1/R0 as in conventional models. For intermediate values of c, however, the individual-specific approach always works better (Fig. 3a and Supplementary Fig. 3a, b), consistent with our finding that higher variation favours disease extinction (Fig. 2b). Branching process theory confirms that qind > qpop whenever c∈(0,1 - 1/R0) (see Supplementary Notes).

a, Increase in extinction probability (qind - qpop) under individual-specific control compared to population-wide control, for diseases with R0 = 3 and different degrees of individual variation, k, subject to control effort c. With population-wide control, the infectiousness of all individuals is reduced by a factor c. With individual-specific control, a proportion c of infectious individuals (selected at random) have their infectiousness reduced to zero. The outbreak is assumed to begin with one case, with control present from the outset. b, Estimates of R̂ and k̂ from outbreak data sets before and after control measures were initiated (joined by solid lines; Supplementary Table 2), and post-control values of kc estimated from theoretical models of control as described in the Supplementary Notes. c, Effect of random versus targeted control measures. The probability of outbreak containment (defined as never reaching the 100-case threshold) for four diseases with R0 = 3 and k = 0.1 (blue), k = 0.5 (green), k = 1 (black) or k → ∞ (purple). Control policies are population-wide (solid lines), random individual-specific (dotted lines), or targeted individual-specific (dashed lines, where half of all control effort is focused on the most infectious 20% of cases). For k → ∞, all individuals are identical, so targeting has no effect and dotted and dashed lines overlay one another. d, The factor by which targeting increases the effect of control on preventing a major outbreak, relative to random individual-specific control (see Supplementary Notes), when 20%, 40% or 60% of the total population is controlled. Results in c and d are the mean of 10,000 simulations, with control beginning in the second generation of cases.
To assess the realism of these idealized control scenarios, we analysed contact tracing data from four outbreaks before and after imposition of control measures. Control always lowered the estimated dispersion parameter (that is k̂c < k̂) as predicted by the individual-specific model (Fig. 3b), although small sample sizes often led to overlapping confidence intervals (Supplementary Table 2). This increased skew in transmission arose chiefly from undiagnosed or misdiagnosed individuals, who continued to infect others (and even cause SSEs), whereas controlled individuals infected very few. To further examine our control theories, we calculated  and
and  for each data set; k̂c was always closer to
  , although twice it fell between the two predictions, indicating a possible combination of control mechanisms (Fig. 3b). Real-world control thus seems to increase individual variation, favouring extinction but risking ongoing SSEs. Larger data sets are needed to establish this pattern definitively.
If highly infectious individuals can be identified predictively (see Supplementary Notes) then the efficiency of control could be greatly increased (Fig. 3c, d). Focusing half of all control effort on the most infectious 20% of cases is up to threefold more effective than random control (Fig. 3d). When k = 0.1 or 0.5, outbreak containment is assured for targeted control levels at roughly half the threshold level of c = 1 - 1/R0 for random control. Gains in efficiency increase with more intense targeting of high-ν cases, but saturate as overall coverage c increases (Supplementary Fig. 3c, d). Again, branching process theory generalizes these findings: for a given proportion c of individuals controlled, greater targeting of higher-ν individuals leads to lower effective reproductive number R and higher extinction probability q (see Supplementary Notes).
The data sets analysed here were collected from published literature, and may be subject to selection bias for successful invasions and SSEs rather than typical disease behaviour. Surveillance data sets are less vulnerable to this bias, but may under-report isolated cases. We urge that detailed transmission tracing data be collected and made public whenever possible, even if unexceptional. At a minimum, we propose a new measure for inclusion in outbreak reports: the proportion of cases not transmitting (p0), which, together with R0 is sufficient to estimate the degree of variation in ν (Supplementary Fig. 4). As more data become available, trends may emerge in the degree of variation present, for example, for different modes of spread or levels of virulence. Richer data sets may also enable testing of the branching process assumption that case outcomes are independent and identically distributed, by detecting possible correlations in ν values within transmission lineages or systematic changes as outbreaks progress.
Our results have broad implications for emerging disease epidemiology, and open challenges for further work. Explosive epidemics demand rapid action by authorities and can strain health infrastructures. High extinction probabilities indicate that disease introductions or host species jumps may be more frequent than currently suspected. Cluster-size surveillance for pathogen adaptation29 or dwindling population immunity30 should be tuned to observed levels of variation. Realization of targeted control measures requires a better understanding of factors determining individual infectiousness. This work must be integrated with established theory of sexually transmitted diseases and social networks, where high-risk groups exert nonlinear influence on R0 because contact rates affect infectiousness and susceptibility equally3,4,12,13,22. All diseases probably show intermediate degrees of covariation between infectiousness and susceptibility, a topic demanding empirical and theoretical study17. The central role of R0 in epidemic analysis is unassailable, but our findings show that emerging disease outbreaks cannot be fully understood if individual variation in infectiousness is neglected. Examination of other population processes dependent on small numbers of individuals may yield similar insights.
Methods
Analysis of disease data
For data sets including the full distribution of Z, we estimated R̂0 and k̂ using maximum-likelihood methods. The candidate models were compared using Akaike's information criterion (AICc) modified for small sample size. Confidence intervals for k̂ were estimated by bias-corrected non-parametric bootstrapping and corroborated by four other methods. For data sets including only estimates of R̂0 and the proportion of cases not transmitting (p̂0), we estimated k̂ by solving p̂0 = (1 + R̂0/k)-k numerically, and evaluated the candidate models using confidence intervals calculated by two methods. Expected proportions of transmission due to particular groups of infectious individuals (Fig. 1b, c) were calculated using the gamma distribution of ν with estimated values of R̂0 and k̂. See Supplementary Notes for details, and for descriptions of data sets.
Branching process analysis
Analysis of branching process models centres on the probability generating function (pgf) of the offspring distribution,  , defined for |s| ≤ 1. When R0 > 1, the long-term probability of disease extinction after introduction of a single infected individual is the unique solution of q = g(q) on the interval (0,1). For a negative binomial offspring distribution Z ≈ NegB(R0,k), the pgf is
  . Under population-wide control,
  and therefore
  , and the variance-to-mean ratio is 1 + (1 - c)R0/k. Under random individual-specific control, the exact pgf is
  with variance-to-mean ratio 1 + R0/k + cR0. This scenario can be approximated by
  , where
  is the solution to
  and decreases monotonically as c increases. Further details, descriptions of outbreak simulations and formal analysis of control measures are found in the Supplementary Notes.
References
Levin, S. A., Grenfell, B., Hastings, A. & Perelson, A. S. Mathematical and computational challenges in population biology and ecosystems science. Science 275, 334–343 (1997)
Becker, N. G. & Britton, T. Statistical studies of infectious disease incidence. J. R. Stat. Soc. B 61, 287–307 (1999)
Anderson, R. M. & May, R. M. Infectious Diseases of Humans: Dynamics and Control (Oxford Univ. Press, 1991)
Diekmann, O. & Heesterbeek, J. A. P. Mathematical Epidemiology of Infectious Diseases: Model Building, Analysis, and Interpretation (Wiley, Chichester, 2000)
Leo, Y. S. et al. Severe acute respiratory syndrome—Singapore, 2003. Morbid. Mortal. Wkly Rep. 52, 405–411 (2003)
Shen, Z. et al. Superspreading SARS events, Beijing, 2003. Emerg. Infect. Dis. 10, 256–260 (2004)
Dye, C. & Gay, N. Modeling the SARS epidemic. Science 300, 1884–1885 (2003)
Lipsitch, M. et al. Transmission dynamics and control of severe acute respiratory syndrome. Science 300, 1966–1970 (2003)
Riley, S. et al. Transmission dynamics of the etiological agent of SARS in Hong Kong: Impact of public health interventions. Science 300, 1961–1966 (2003)
Bauch, C. T., Lloyd-Smith, J. O., Coffee, M. & Galvani, A. P. Dynamically modeling SARS and other newly-emerging respiratory illnesses: past, present, future. Epidemiology 16, 791–801 (2005)
Koopman, J. Modeling infection transmission. Annu. Rev. Public Health 25, 303–326 (2004)
May, R. M. & Anderson, R. M. Transmission dynamics of HIV infection. Nature 326, 137–142 (1987)
Woolhouse, M. E. J. et al. Heterogeneities in the transmission of infectious agents: Implications for the design of control programs. Proc. Natl Acad. Sci. USA 94, 338–342 (1997)
Lloyd-Smith, J. O., Getz, W. M. & Westerhoff, H. V. Frequency-dependent incidence in models of sexually transmitted diseases: portrayal of pair-based transmission and effects of illness on contact behaviour. Proc. R. Soc. Lond. B 271, 625–634 (2004)
Anderson, R. M. et al. Epidemiology, transmission dynamics and control of SARS: the 2002–2003 epidemic. Phil. Trans. R. Soc. Lond. B 359, 1091–1105 (2004)
Gani, R. & Leach, S. Epidemiologic determinants for modeling pneumonic plague outbreaks. Emerg. Infect. Dis. 10, 608–614 (2004)
Becker, N. & Marschner, I. in Stochastic Processes in Epidemic Theory (eds Picard, P., Gabriel, J. P. & Lefevre, C.) 90–103 (Springer-Verlag, New York, 1990)
Becker, N. Analysis of Infectious Disease Data 48–59 (Chapman & Hall, London, 1989)
Bailey, N. T. J. The Mathematical Theory of Infectious Diseases 2nd edn, 263–265 (Griffin, London, 1975)
Keeling, M. J. & Grenfell, B. T. Disease extinction and community size: Modeling the persistence of measles. Science 275, 65–67 (1997)
Lloyd, A. L. Destabilization of epidemic models with the inclusion of realistic distributions of infectious periods. Proc. R. Soc. Lond. B 268, 985–993 (2001)
Meyers, L. A., Pourbohloul, B., Newman, M. E. J., Skowronski, D. M. & Brunham, R. C. Network theory and SARS: predicting outbreak diversity. J. Theor. Biol. 232, 71–81 (2005)
Boswell, M. T. & Patil, G. P. Random Counts in Models and Structures (ed. Patil, G. P.) 7–8 (Pennsylvania State Univ. Press, University Park, 1970)
Burnham, K. P. & Anderson, D. R. Model Selection and Multimodel Inference: A Practical Information-Theoretic Approach (Springer, New York, 2002)
Lloyd-Smith, J. O., Galvani, A. P. & Getz, W. M. Curtailing transmission of severe acute respiratory syndrome within a community and its hospital. Proc. R. Soc. Lond. B 270, 1979–1989 (2003)
Wallinga, J. & Teunis, P. Different epidemic curves for severe acute respiratory syndrome reveal similar impacts of control measures. Am. J. Epidemiol. 160, 509–516 (2004)
Ha, L. D. et al. Lack of SARS transmission among public hospital workers, Vietnam. Emerg. Infect. Dis. 10, 265–268 (2004)
Park, B. J. et al. Lack of SARS transmission among healthcare workers, United States. Emerg. Infect. Dis. 10, 244–248 (2004)
Ferguson, N. M., Fraser, C., Donnelly, C. A., Ghani, A. C. & Anderson, R. M. Public health risk from the avian H5N1 influenza epidemic. Science 304, 968–969 (2004)
Farrington, C. P., Kanaan, M. N. & Gay, N. J. Branching process models for surveillance of infectious diseases controlled by mass vaccination. Biostatistics 4, 279–295 (2003)
Acknowledgements
We are grateful for comments and data suggestions from B. Bolker, J. Edmunds, N. Ferguson, A. Galvani, R. Gani, N. Gay, J. Gog, B. Grenfell, H. Hethcote, D. Heymann, A. Hubbard, N. Jewell, J. Lauer, R. May, T. Porco, C. Roth, D. Smith and B. Williams. We thank R. Gani for providing unpublished data from a previous publication, and L. Matthews for sharing work ahead of print. Our research was supported by the NSF, NIH-NIDA, the James S. McDonnell Foundation, the NSF/NIH Ecology of Infectious Disease Program, and the South African Centre for Epidemiological Modelling and Analysis (SACEMA). Author Contributions J.O.L.-S. and W.M.G. conceived the study. J.O.L.-S. collected and analysed outbreak data, conducted dynamic modelling, and drafted and revised the text. S.J.S. conducted formal analysis of branching processes and control measures. W.M.G. provided technical input on superspreading and control analyses. All authors contributed conceptually, and edited or commented on the text.
Author information
Authors and Affiliations
Corresponding author
Ethics declarations
Competing interests
Reprints and permissions information is available at npg.nature.com/reprintsandpermissions. The authors declare no competing financial interests.
Supplementary information
Supplementary Notes
This file contains additional discussion of factors contributing to individual variation in infectiousness, methodological details on statistical and modelling analyses, and details of outbreak datasets and superspreading events. (PDF 435 kb)
Supplementary Figures
The file includes Supplementary Figures 1 to 4, with captions. The figures address the prediction of superspreading event frequency, further results on outbreak dynamics and control, and estimation of the dispersion parameter k with limited data. (PDF 322 kb)
Supplementary Table 1
A summary of results from our statistical analysis of uncontrolled outbreaks (corresponds to Figure 1a–c). (PDF 71 kb)
Supplementary Table 2
Detailed results from our statistical analysis of uncontrolled outbreaks (elaborating on Supplementary Table 1), and the analysis of data before and after control measures were applied in four outbreaks. (PDF 94 kb)
Rights and permissions
About this article
Cite this article
Lloyd-Smith, J., Schreiber, S., Kopp, P. et al. Superspreading and the effect of individual variation on disease emergence. Nature 438, 355–359 (2005). https://doi.org/10.1038/nature04153
Received:
Accepted:
Issue Date:
DOI: https://doi.org/10.1038/nature04153
This article is cited by
-
Transmission chains of the first local outbreak cause by Delta VariantB.1.617.2 COVID-19 in Guangzhou, Southern China
BMC Infectious Diseases (2024)
-
HPAIV outbreak triggers short-term colony connectivity in a seabird metapopulation
Scientific Reports (2024)
-
Frequency, kinetics and determinants of viable SARS-CoV-2 in bioaerosols from ambulatory COVID-19 patients infected with the Beta, Delta or Omicron variants
Nature Communications (2024)
-
Predicting nodal influence via local iterative metrics
Scientific Reports (2024)
-
Infectious Disease in the Workplace: Quantifying Uncertainty in Transmission
Bulletin of Mathematical Biology (2024)
Comments
By submitting a comment you agree to abide by our Terms and Community Guidelines. If you find something abusive or that does not comply with our terms or guidelines please flag it as inappropriate.
