

Abstract
Background: The Canadian Institute for Health Information (CIHI) annually reports on health system performance indicators, including various 30-day in-hospital mortality rates. We aimed to assess the impact of including out-of-hospital deaths on 3 CIHI indicators: 30-day acute myocardial infarction (AMI) in-hospital mortality, 30-day stroke in-hospital mortality and hospital deaths following major surgery.
Methods: We followed national cohorts of patients admitted to hospital in 1 of 9 Canadian provinces for AMI, stroke and major surgery for 30-day all-cause mortality in 2 fiscal years (2011/12 and 2016/17). We calculated descriptive statistics to characterize the cohorts. The CIHI Discharge Abstract Database was linked with the Canadian Vital Statistics Death Database using a probabilistic algorithm to identify out-of-hospital deaths. We calculated absolute numbers, relative proportions and 30-day mortality rates for in-hospital, out-of-hospital and all deaths. We compared results between fiscal years.
Results: We found that hospital admissions increased between fiscal years for each indicator; however, cohort characteristics remained consistent. In 2016/17, the number of out-of-hospital deaths that occurred was 325 for AMI, 545 for stroke and 820 for major surgery. The relative proportions of out-of-hospital deaths ranged from 12.3% for AMI to 14.9% for major surgery in 2016/17 (an increase from 10.6% and 13.1%, respectively, from 2011/12). In-hospital mortality rates improved over time for all 3 indicators, while out-of-hospital mortality rates remained consistent between fiscal years at 0.8% for AMI, 1.9%–2.0% for stroke and 0.2%–0.3% for major surgery.
Interpretation: Improvements between fiscal years were attributable to reductions in in-hospital mortality, rather than deaths occurring outside of hospitals. Trends over time were the same for each indicator irrespective of whether in-hospital mortality or all deaths were measured.
The Canadian Institute for Health Information (CIHI) supports national data collection, analysis and reporting to accelerate improvements in health system performance across Canada.1 As part of this work, CIHI annually reports on health system performance indicators, including various 30-day in-hospital mortality rates.2,3 The accuracy of 30-day mortality rates is dependent on the completeness and quality of the available data. The 30-day mortality rates measure in-hospital deaths documented in administrative health databases, such as the Discharge Abstract Database (DAD), based on the availability of timely data.4
This approach has been shown to underestimate overall 30-day mortality rates in other countries, as it does not include deaths that occur outside of the hospital.5–8 To report more comprehensive measures, administrative health data have been linked with national death registries to capture out-of-hospital deaths.9 In Canada, inclusion of both in- and out-of-hospital deaths may provide a more comprehensive and patient-centred assessment of health system performance, which is becoming increasingly important as hospital lengths of stay are becoming shorter as care shifts from inpatient to other settings. We aimed to assess the impact of including out-of-hospital deaths on 3 of CIHI’s key mortality indicators: 30-day acute myocardial infarction (AMI) in-hospital mortality, 30-day stroke in-hospital mortality and hospital deaths following major surgery.
Methods
Study design
We conducted a pan-Canadian study that followed cohorts of patients with AMI, stroke and those who had major surgery for 30 days after the index hospital date for all-cause mortality. Cohorts were constructed using the same inclusion and exclusion criteria documented in the denominator description for each indicator in the CIHI Indicator Library.10
Each cohort included Canadian residents aged 20 years and older who met the respective inclusion and exclusion criteria. The AMI and stroke indicators were patient-based, with the index date as the date of hospital admission for the first AMI or stroke within the measurement period. The stroke indicator included subarachnoid hemorrhage, intracerebral hemorrhage, ischemic stroke, stroke not specified as hemorrhage or infarction and venous sinus or cortical vein thrombosis. 11 The major surgery indicator was admission-based and included all major surgery episodes within the measurement period. The index date for the major surgery indicator was the date of surgery. If more than 1 major surgery was performed during the same admission, we used the date of the last major surgery. We defined major surgery by the list of CIHI case-mix groups meeting at least 2 of the following criteria: average operating room time greater than 2 hours, more than 75% of procedures using general anesthesia and less than 10% of procedures performed in a day-surgery setting.12 The cohorts used to calculate the 3 indicators were not mutually exclusive; patients may have been included in multiple cohorts if they had more than 1 exposure of interest (i.e., AMI, stroke and major surgery), as described by CIHI indicator definitions.10
We used fiscal years 2011/12 and 2016/17 based on the availability of linked data at the time of analysis. We restricted cohorts to acute care hospital admissions with an index date between April 1 and March 1 of the fiscal year to allow for the 30-day follow-up period, and with a discharge from the hospital on or before March 31 to be documented in the DAD for the fiscal year.
Data sources
We conducted this study using administrative health data from CIHI’s DAD linked with data from the Canadian Vital Statistics Death Database (CVSD). The databases were linked by Statistics Canada using a probabilistic linkage algorithm based on nonunique identifiers (e.g., name, sex, date of birth and postal code) and estimates of the likelihood that records could be attributed to the same patient.13
The DAD included administrative, clinical and demographic information on all hospital discharges including in-hospital deaths from all provinces and territories, except Quebec. The DAD provided near perfect coverage of acute care discharges.4 The CVSD, a census of all deaths that occurred in Canada each year, provided demographic characteristics of the deceased and cause of death. The reporting of deaths to provincial and territorial Vital Statistics Registries and providing these data to Statistics Canada are mandatory.14 Data for the Yukon were not available owing to differences in data-sharing agreements, and data for Nunavut and the Northwest Territories were not shown owing to small numbers.
Measurement of 30-day mortality rates
The primary outcomes were additional deaths identified through linkage with the CVSD, relative proportions of out-of-hospital deaths and the impact on the overall 30-day all-cause mortality rates. The analyses reported 3 metrics of 30-day mortality. In-hospital deaths were measured according to inpatient acute care hospital admissions (Facility Type Code = 1)12 documented in the DAD with a discharge disposition of death. We used the same inclusion and exclusion criteria as documented in the numerator description for each indicator.10 Out-of-hospital deaths after admission to hospital included additional deaths identified through the linkage of acute care hospital admissions from the DAD to a death record from the CVSD. Linked records without a documented in-hospital death in the DAD were considered to indicate an out-of-hospital death. All deaths included in- and out-of-hospital deaths.
Statistical analysis
We calculated descriptive statistics to characterize the sociodemographic information of the AMI, stroke and major surgery cohorts for fiscal years 2011/12 and 2016/17. Absolute numbers and relative proportions of in- and out-of-hospital deaths were reported. Thirty-day mortality rates were calculated based on in-hospital, out-of-hospital and all deaths to quantify the impact of including out-of-hospital deaths in CIHI’s indicators. We calculated cumulative mortality in 3-day intervals to assess whether the distributions of in-hospital deaths, occurring either during the index hospital stay or upon readmission, and outside-of-hospital deaths changed over the 30-day follow-up. We compared results between fiscal years.
We assessed the performance of the probabilistic linkage algorithm (i.e., coverage rate) by calculating the percentage of the DAD in-hospital deaths confirmed by linkage to a CVSD death record.
We conducted all statistical analyses using SAS 9.4 (SAS Institute Inc.). To meet the requirements for publication using CVSD records from Statistics Canada, we applied vetting rules: all counts were rounded to the nearest 5, and rates and proportions were calculated based on the rounded counts.
Ethics approval
Research ethics board review was not required by the Government of Canada Panel on Research Ethics as the research involved secondary use of routinely collected, clinical administrative health information and was not re-identifiable.
Results
The sociodemographic characteristics of the AMI, stroke and major surgery cohorts are presented in Table 1. We found that the number of acute care hospital admissions increased from 2011/12 to 2016/17 for each indicator; however, cohort characteristics were consistent over time. The absolute numbers and relative proportions of in- and out-of-hospital deaths and associated 30-day mortality rates are reported in Table 2.
Sociodemographic characteristics of cohorts of acute myocardial infarction, stroke and major surgery patients for 2 fiscal years (2011/12 and 2016/17)
Absolute numbers and relative proportions of in- and out-of-hospital deaths and associated 30-day mortality rates for 2 fiscal years (2011/12 and 2016/17)
Thirty-day acute myocardial infarction mortality
In 2016/17, the 30-day AMI in-hospital mortality rate was 5.7% (2315 deaths). Linkage with the CVSD identified 325 out-of-hospital deaths. Overall, 87.7% of deaths within 30 days were captured in the DAD, and 12.3% occurred outside of the hospital. Including out-of-hospital deaths increased the 30-day mortality rate by 0.8% (from 5.7% to 6.5%).
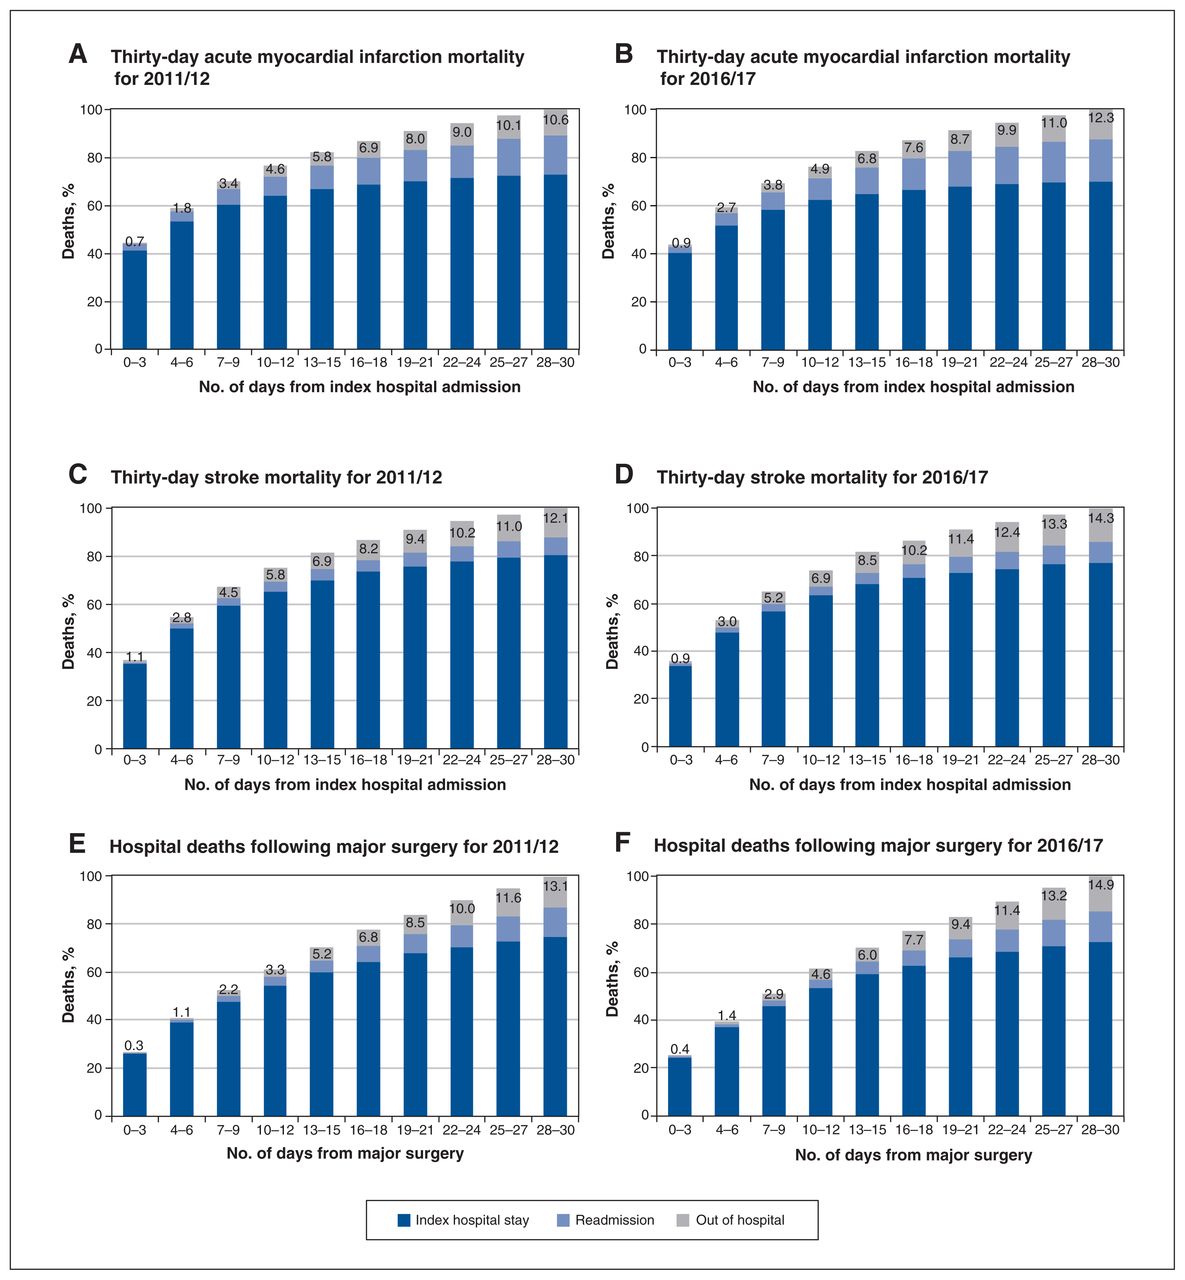
Cumulative mortality over the 30-day follow-up period is presented in Figure 1A and B and showed changes in the distributions of deaths occurring during the index hospital stay, upon readmission and outside of the hospital over follow-up for both fiscal years. In general, deaths in early follow-up occurred during the index hospital stay, with the proportions of deaths upon readmission and outside of the hospital increasing over the follow-up period.
Proportions of deaths that occurred during the index hospital stay, upon readmission and outside of the hospital over the 30-day follow-up period for each indicator, by fiscal year: acute myocardial infarction in (A) 2011/12 and (B) 2016/17; stroke in (C) 2011/12 and (D) 2016/17; and major surgery in (E) 2011/12 and (F) 2016/17.
We found that the relative proportion of out-of-hospital deaths increased from 10.6% in 2011/12 to 12.3% in 2016/17. This change was attributable to the decreasing rate of in-hospital mortality over time. The 30-day out-of-hospital mortality rate remained constant at 0.8% for both fiscal years (Table 2).
Thirty-day stroke mortality
Similar patterns emerged with the 30-day stroke mortality rates (Table 2). In 2016/17, the in-hospital mortality rate was 12.0% (3275 deaths). We identified an additional 545 deaths through linkage with the CVSD, which accounted for 14.3% of all deaths and increased the overall 30-day mortality rate by 2.0% (from 12.0% to 14.0%).
Cumulative proportions of in-hospital and out-of-hospital deaths over follow-up are presented in Figure 1C and D and showed similar patterns to the AMI indicator. The relative proportion of out-of-hospital deaths increased from 12.1% to 14.3% between fiscal years. This change was a result of lower in-hospital mortality. The 30-day out-of-hospital mortality rate remained consistent at 1.9% and 2.0% across both fiscal years (Table 2).
Deaths following major surgery
We found that all 30-day mortality rates for major surgery remained consistent over time, with in-hospital mortality rates of 1.6% and 1.5%, out-of-hospital rates of 0.2% and 0.3% and overall 30-day mortality rates of 1.9% and 1.8% for fiscal years 2011/12 and 2016/17, respectively (Table 2). The relative proportion of out-of-hospital deaths increased from 13.1% in 2011/12 to 14.9% in 2016/17 owing to small variations in relatively low mortality rates. Cumulative percentages of in-hospital and out-of-hospital deaths over the follow-up period are presented in Figure 1E and F and showed similar patterns to the AMI and stroke indicators.
Coverage rates
We found that the coverage rates were more than 95% in both fiscal years (Table 3), for each indicator.
Acute care hospital admissions from the Discharge Abstract Database with a documented in-hospital death that were matched with a Canadian Vital Statistics Death Database record
Interpretation
The inclusion of out-of-hospital deaths had differential impacts on 3 indicators of 30-day mortality. In 2016/17, the number of out-of-hospital deaths was 325 for AMI, 545 for stroke and 820 for major surgery, which increased the overall unadjusted 30-day mortality rates by 14.0%, 16.7% and 20.0%, respectively, compared with in-hospital mortality rates. The relative proportion of out-of-hospital deaths ranged from 12.3% to 14.9% in 2016/17, increasing from 10.6% to 13.1% in 2011/12. These increases in mortality rates are important because they are patient-centred and sensitive to all care received during the critical time after AMI, stroke or major surgery, and more accurately reflect the outcomes of these major conditions.
One constant across all indicators was that 30-day out-of-hospital mortality rates remained consistent between the 2 fiscal years. Observed improvements between fiscal years were mainly attributable to reductions in in-hospital mortality. The trends for each of the indicators were the same over time irrespective of whether in-hospital mortality or all deaths were measured.
The probabilistic linkage algorithm showed excellent performance. Only a small percentage of in-hospital deaths documented in the DAD (range 3.2%–4.5%) were not matched to a CVSD record. These findings suggest that the algorithm also matched more than 95% of out-of-hospital deaths with acute care hospital admissions in the DAD, providing near-perfect coverage of all deaths occurring within the 30-day follow-up period.
Similar analyses have been conducted for other countries. The Organisation for Economic Co-operation and Development released the Health at a Glance 2019: OECD indicators report that compared health system performance across 23 member countries.9 This report provided information about AMI and ischemic stroke with 30-day in-hospital mortality rates for deaths that occurred within the same hospital as the index admission and overall 30-day mortality rates including deaths that occurred at other hospitals or outside of the hospital. Overall, deaths that occurred in other hospitals or outside of the hospital accounted for 24.2% of the 30-day mortality for AMI and 37.4% for ischemic stroke. The overall 30-day mortality rates reported for Canada did not include out-of-hospital deaths.
Estimates from an Australian government report and research conducted using hospital data in Norway, and the United States showed that out-of-hospital deaths ranged from 18% to 35% for AMI and from 21% to 43% for stroke;5–8 however, there were no direct comparisons for the major surgery indicator. A 2018 study that evaluated in- and out-of-hospital deaths involving adult patients who were admitted for elective and nonelective inpatient surgery reported that out-of-hospital deaths after inpatient surgery accounted for 18% of 30-day mortality.15 Other studies have shown how the proportions of out-of-hospital deaths were dependent on the type of surgery, with out-of-hospital deaths ranging from 8% (bladder) to 50% (breast) after cancer surgeries, 16 and 53% after hip fracture surgeries.5
We found lower proportions of out-of-hospital deaths compared with the literature. A substantial contributor to this variation was the difference in definitions for out-of-hospital deaths among studies. Most of these studies defined out-of-hospital deaths as those that occurred after discharge from the index hospital admission such as deaths that occurred during hospital readmissions.5,7,8,15,16 This supported CIHI’s measurement approach, which included deaths that occurred during subsequent hospital admissions within 30 days of the index hospital admission date. Figure 1 shows the additional deaths captured by the CIHI indicators using this approach. The variation could also be explained by different outcome specifications (e.g., the Australian government report differentiated between ischemic and hemorrhagic stroke, and reported on 30-day mortality after the last hospital admission in the measurement period);5 uncertainty around estimates (proportions of out-of-hospital deaths were calculated based on reported point estimates and did not consider uncertainty around these estimates); and older data (despite being published in the last decade, many studies analyzed data from the early to mid-2000s).
Limitations
Our analysis did not capture data during the COVID-19 pandemic when trends of in- and out-of-hospital deaths may have been different. We did not risk adjust the reported 30-day mortality rates; we assessed the impact of including out-of-hospital deaths on crude 30-day mortality rates. Although the probabilistic linkage algorithm performed well overall, it is possible that out-of-hospital deaths were undercounted in cases where relevant CVSD records were not matched with corresponding hospital admissions in the DAD. These results may not be generalizable to less severe conditions with lower mortality rates, where relative proportions of in- and out-of-hospital deaths may differ. This study did not include hospital admissions from Quebec, Northwest Territories, Nunavut and Yukon, and the findings may not be generalizable to these parts of Canada.
Future research could evaluate the impact of including out-of-hospital deaths on CIHI’s indicators of health system performance. In particular, reporting all deaths may be important for programs with late complications, where institutions are shifting care to other settings and for chronic conditions. This work could also be expanded to assess the impact of out-of-hospital deaths on other indicators, such as CIHI’s 30-day readmission rates, where it may be appropriate to censor patients when deaths occur outside of the hospital.
Additional work could focus on improving the probabilistic linkage algorithm to match all in-hospital deaths with a CVSD record. Alternatively, efforts could focus on the implementation of unique patient identifiers to link between CIHI’s administrative health databases and the CVSD to facilitate reporting of overall 30-day mortality rates.9
Conclusion
The CIHI 30-day in-hospital mortality indicators for AMI, stroke and major surgery provide a reasonable approximation of the overall 30-day mortality rate including out-of-hospital deaths in Canada. The trends over time remained the same whether measuring in-hospital mortality or both in- and out-of-hospital deaths. These findings support CIHI’s measurement approach and are generalizable to international health system performance indicators that leverage administrative heath data and use similar methodology.
Including out-of-hospital deaths would provide a more comprehensive and patient-centred assessment of 30-day mortality; however, the timeliness of CVSD data could negatively affect CIHI’s ability to provide actionable information to accelerate improvements in health system performance. It will be important to continue monitoring the proportions of out-of-hospital deaths over time, particularly if substantial improvements are realized for in-hospital mortality and consider modifying the measurement approach given timely access to CVSD records.
Footnotes
Competing interests: Ania Syrowatka received partial salary support from grants funded by IBM Watson Health, outside the submitted work. No other competing interests were declared.
This article has been peer reviewed.
Contributors: Ania Syrowatka, Mingyang Li and Yana Gurevich contributed to the conception and design of the work. Mingyang Li, Jing Gu and Ling Yin contributed to the acquisition and analysis of the data. Ania Syrowatka and Danielle Rice drafted the manuscript. All of the authors interpreted the data, revised the manuscript critically for important intellectual content, gave final approval of the version to be published and agreed to be accountable for all aspects of the work.
Data sharing: Data used in this study are available through formal data requests to the Canadian Institute for Health Information and Statistics Canada.
Disclaimer: The views expressed in this article are the authors’ and do not necessarily represent the views of the Canadian Institute for Health Information.
Supplemental information: For reviewer comments and the original submission of this manuscript, please see www.cmajopen.ca/content/10/4/E882/suppl/DC1.
This is an Open Access article distributed in accordance with the terms of the Creative Commons Attribution (CC BY-NC-ND 4.0) licence, which permits use, distribution and reproduction in any medium, provided that the original publication is properly cited, the use is noncommercial (i.e., research or educational use), and no modifications or adaptations are made. See: https://creativecommons.org/licenses/by-nc-nd/4.0/
References
- © 2022 CMA Impact Inc. or its licensors