


Article Figures & Tables
Figures
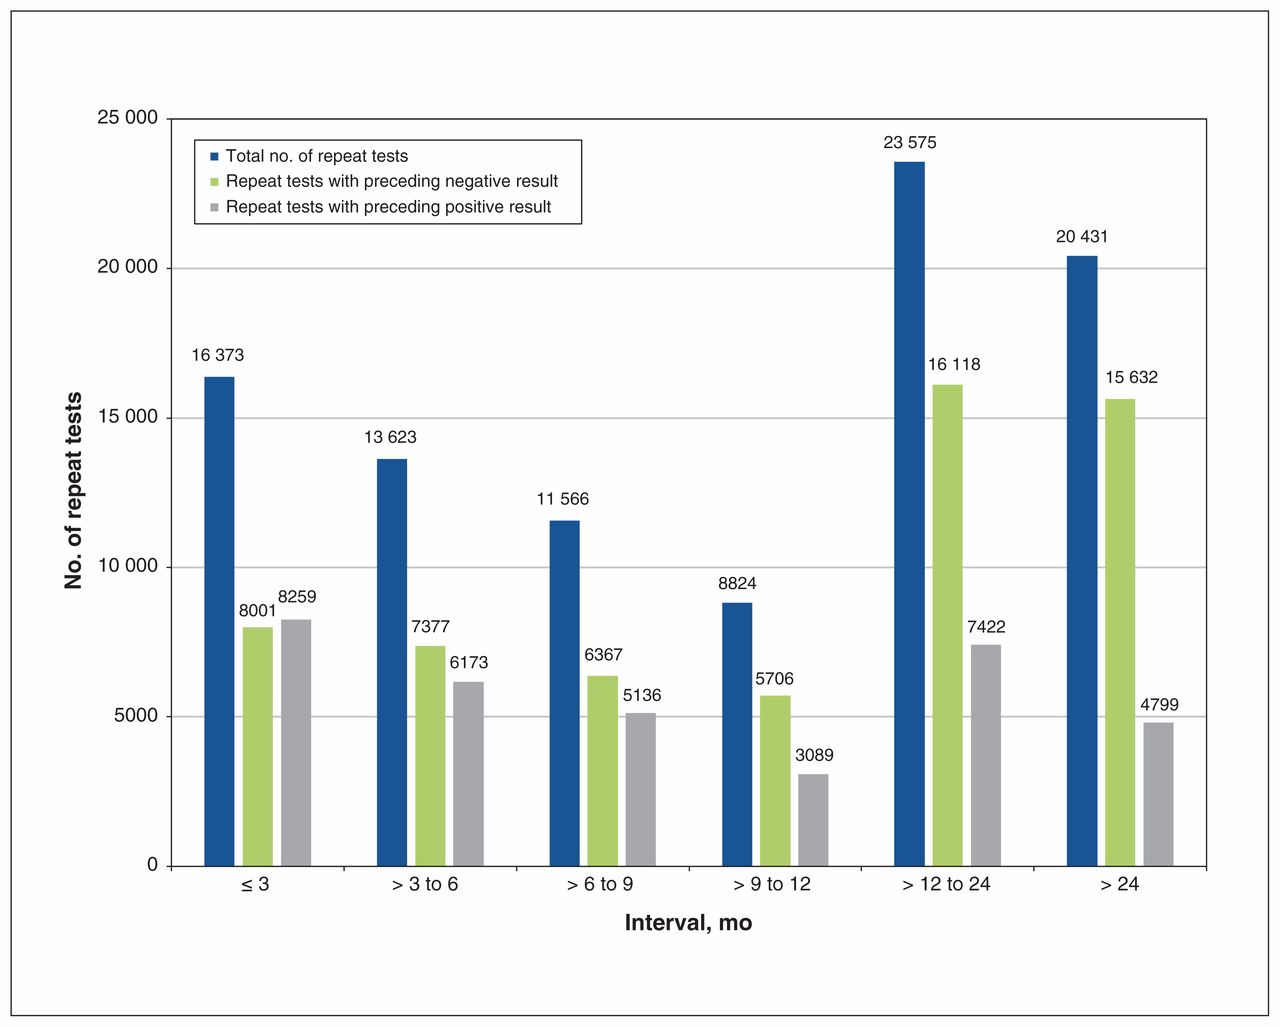
- Figure 1:
Number of repeat antinuclear antibody (ANA) tests ordered by the same practitioner, according to result and by time interval. A small proportion (0.005%–0.8%) of tests had unknown results, and, therefore, the number of positive and negative results within each time interval may not add up to the cumulative total.

Tables
- Table 1:
Frequency of total and repeat antinuclear antibody tests overall and by ordering physician type
Variable No. (%) of tests Total
n = 7136Family physicians
n = 4643Rheumatologists
n = 188Internal medicine
n = 313Other
n = 1992No. of tests (% of total tests) 587 357 (100.0) 358 422 (61.0) 65 071 (11.1) 26 409 (4.5) 137 455 (23.4) Positive result 126 322 (21.5) 64 262 (17.9) 28 393 (43.6) 5884 (22.3) 27 783 (20.2) Repeat test within 12 mo of previous test (regardless of who ordered previous test) 82 332 (14.0) 32 994 (9.2) 23 507 (36.1) 4707 (17.8) 21 124 (15.4) Repeat test within 12 mo of previous test ordered by same practitioner type who ordered previous test* 51 411 (8.8) 25 213 (7.0) 13 093 (20.1) 1656 (6.3) 11 071 (8.0) ↵* Individual categories do not total 51 411 as practitioner specialty was unknown for 378 tests.
- Table 2:
Characteristics of patients with antinuclear antibody tests, overall and by number of tests
Characteristic No. (%) of patients* Total
n = 437 9661 test
n = 346 282≥ 2 tests
n = 91 684Age, yr, mean ± SD 52.4 ± 16.3 51.9 ± 16.5 54.5 ± 15.3 Female sex 294 130 (67.2) 226 363 (65.4) 67 767 (73.9) Connective tissue disease 24 037 (5.5) 13 610 (3.9) 10 427 (11.4) Hospital admission in 2 yr preceding index test 22 600 (5.2) 17 701 (5.1) 4899 (5.3) Urban residence 378 822 (86.5) 299 480 (86.5) 79 342 (86.5) Note: SD = standard deviation.
↵* Except where noted otherwise.
- Table 3:
Provider and patient characteristics associated with repeat antinuclear antibody testing within 12 months of previous test and repeat testing after a positive test result
Characteristic Any physician, adjusted OR (95% CI)* Same physician, adjusted OR (95% CI)* Repeat testing within 12 mo of previous test Repeat testing after prior positive test result Repeat testing within 12 mo of previous test Repeat testing after prior positive test result Physicians Family physicians (reference = rheumatologists) 0.26 (0.22–0.31) 0.23 (0.20–0.28) 0.80 (0.64–1.00) 0.55 (0.44–0.69) Internists (reference = rheumatologists) 0.59 (0.44–0.79) 0.58 (0.44–0.76) 0.63 (0.47–0.85) 0.66 (0.50–0.87) All other practitioners (reference = rheumatologists) 0.39 (0.32–0.48) 0.33 (0.26–0.42) 0.63 (0.47–0.84) 0.56 (0.42–0.73) Physician age ≤ 50 year (reference = > 50 yr) 0.98 (0.88–1.10) 0.90 (0.79–1.03) 1.29 (1.15–1.46) 1.12 (0.97–1.29) Female (reference = male) 0.93 (0.84–1.03) 1.05 (0.93–1.19) 0.95 (0.85–1.07) 1.10 (0.96–1.27) Academic centre (reference = community practice) 1.53 (0.87–2.69) 1.32 (0.83–2.12) 1.53 (0.94–2.48) 1.33 (0.89–1.98) International medical school graduate (reference = Canadian medical school graduate) 0.96 (0.87–1.07) 0.91 (0.80–1.05) 0.81 (0.70–0.93) 0.75 (0.63–0.88) Patients Age 1.01 (1.00–1.01) 1.00 (1.00–1.01) 1.01 (1.01–1.01) 1.01 (1.00–1.01) Female (reference = male) 1.29 (1.25–1.34) 1.82 (1.73–1.91) 1.29 (1.23–1.36) 1.83 (1.72–1.94) Income quintile† (reference = 1 lowest) 2 1.03 (0.99–1.07) 1.06 (1.00–1.12) 1.05 (1.00–1.10) 1.06 (0.99–1.15) 3 1.05 (1.01–1.10) 1.12 (1.06–1.19) 1.04 (0.99–1.09) 1.10 (1.02–1.19) 4 1.07 (1.03–1.12) 1.19 (1.12–1.26) 1.04 (0.99–1.10) 1.16 (1.07–1.25) 5 (highest) 1.08 (1.03–1.12) 1.17 (1.10–1.25) 1.02 (0.97–1.07) 1.10 (1.01–1.19) Urban residence (reference = rural) 0.93 (0.86–0.99) 0.96 (0.89–1.05) 1.01 (0.93–1.09) 1.03 (0.94–1.13) Connective tissue disease 2.20 (2.01–2.41) 4.18 (3.70–4.73) 3.08 (2.70–3.51) 5.37 (4.69–6.14) Hospital admission in previous 6 mo 0.95 (0.89–1.00) 0.92 (0.83–1.02) 0.92 (0.84–1.01) 0.94 (0.80–1.10) Charlson Comorbidity Index score‡ (reference = 0) 1 1.17 (1.10–1.25) 1.14 (1.03–1.26) 1.20 (1.10–1.30) 1.18 (1.04–1.34) ≥ 2 1.11 (1.02–1.21) 0.97 (0.86–1.09) 1.16 (1.05–1.29) 0.98 (0.85–1.13) Year of index test (reference = 2010) 2008 0.24 (0.21–0.28) 0.19 (0.16–0.24) 0.27 (0.22–0.32) 0.23 (0.17–0.30) 2009 0.75 (0.71–0.80) 0.74 (0.67–0.81) 0.76 (0.70–0.83) 0.74 (0.65–0.83) 2011 1.09 (1.03–1.16) 1.16 (1.07–1.25) 1.06 (0.99–1.13) 1.08 (0.97–1.20) 2012 1.17 (1.10–1.26) 1.31 (1.19–1.44) 1.12 (1.04–1.21) 1.20 (1.07–1.34) 2013 1.30 (1.22–1.39) 1.32 (1.21–1.46) 1.26 (1.16–1.37) 1.33 (1.17–1.50) 2014 1.45 (1.36–1.56) 1.44 (1.32–1.58) 1.39 (1.27–1.52) 1.36 (1.21–1.51) 2015 1.70 (1.56–1.86) 1.68 (1.50–1.88) 1.79 (1.59–2.01) 1.80 (1.54–2.09) Note: CI = confidence interval, OR = odds ratio.
↵* Adjusted for patient covariates (age, sex, income quintile, urban residence, year of testing, prior hospital admissions, Charlson Comorbidity Index score, testing or diagnosis for connective tissue disease) and physician covariates (specialty, age, sex, international medical graduate, academic setting).
↵† Based on patients’ postal code and census neighbourhood income quintile.
↵‡ With a look-back period of 2 years before the index test.
In this issue

Article tools


