


Article Figures & Tables
Figures
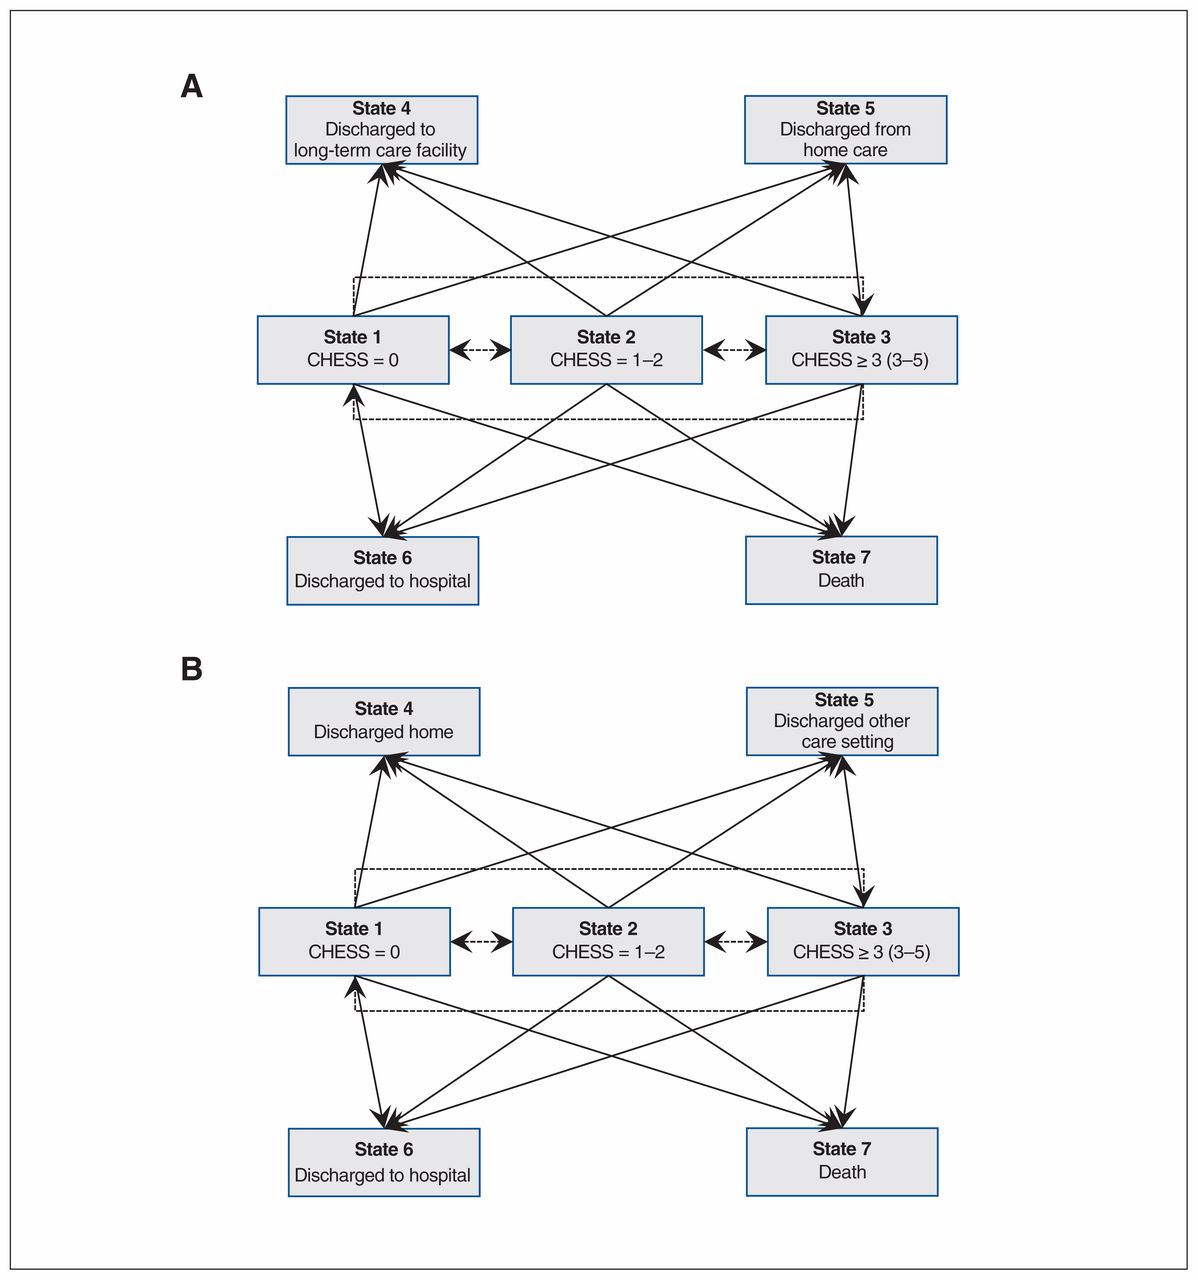
- Figure 1:
State-space diagram for possible transitions from home care (A) and long-term (B) care in multistate Markov model. At admission to home care (A) or long-term care (B), clients can be in State 1 (CHESS score = 0), State 2 (CHESS score = 1 or 2) or State 3 (CHESS score ≥ 3), with State 3 representing the greatest health instability and State 1 the least health instability. From this initial state, clients who remain in home care (A) or long-term care (B) can improve (e.g., a transition from State 2 to State 1, or a transition from State 3 to State 1 or 2) or can worsen (e.g., transition from State 1 to State 2 or 3, or transition from State 2 to State 3). A client can also transition out of home care (A) from 1 of the 3 initial admission states (State 1, 2 or 3) to 1 of 4 possible discharge possibilities: discharge to a long-term care facility (State 4), discharge from home care (no longer requiring services, State 5), discharge to hospital (State 6) or death (State 7). A long-term care resident (B) can transition out of long-term care from 1 of the 3 initial admission states (State 1, 2 and 3) to 1 of 4 possible discharge possibilities: discharge home (State 4), discharge to another care setting (State 5), discharge to hospital (State 6) or death (State 7). In Figure 1A the broken lines reflect transitions between health states for those remaining in home care. The solid lines reflect transitions to “absorbing states” outside of the home care. In Figure 1B the broken lines reflect transitions between health states within the long-term care facility. The solid lines reflect transitions to “absorbing states” outside of the long-term care facility.
- Figure 2:
Unadjusted rates of transitions from home care by CHESS score and by province. The figure depicts the percentage of home care clients who were admitted to long-term care, who died (at home or in hospital) or who were admitted to hospital but did not die there within 6 months of intake assessment, by CHESS score at intake, in Ontario (ON), Alberta (AB) and British Columbia (BC). Note: CHESS = Changes in Health, End-Stage Disease, Signs, and Symptoms Scale.
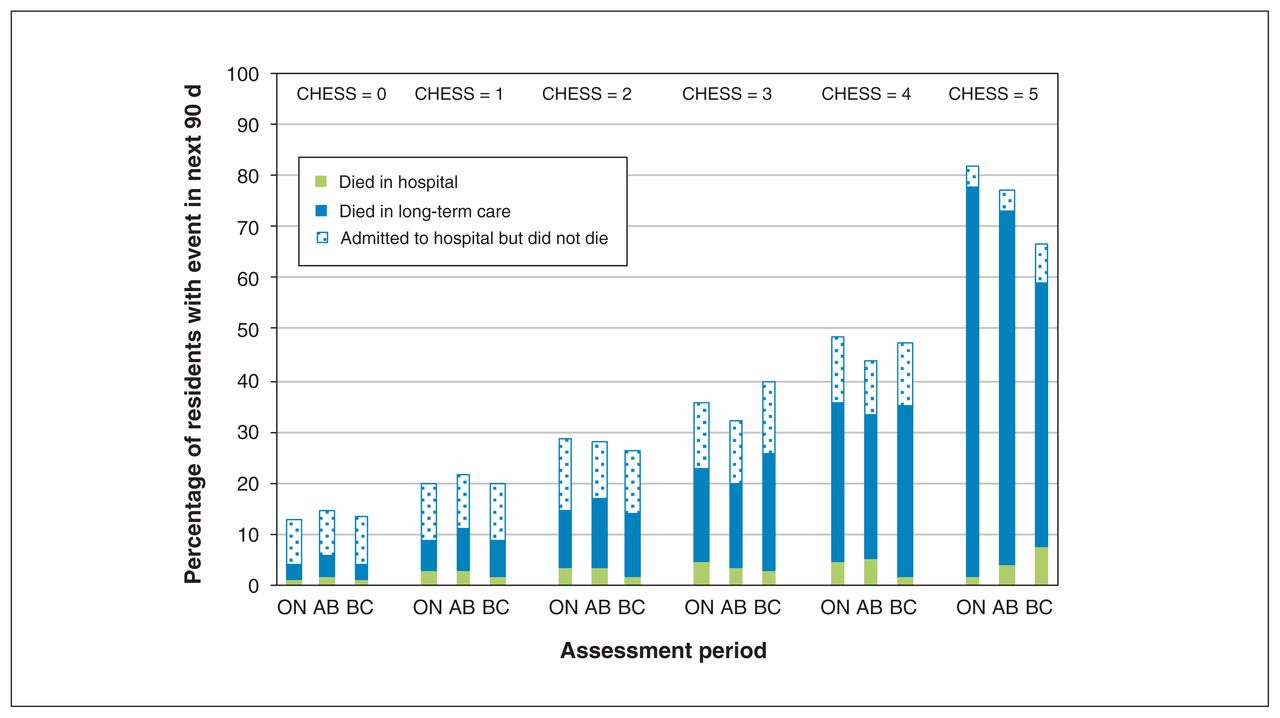
- Figure 3:
Unadjusted rates of transitions from long-term care by CHESS score and by province. The figure depicts the percentage of residents who died (in a long-term care facility or hospital) or were admitted to hospital but did not die there within 90 days of admission assessment, by CHESS score at admission, in Ontario (ON), Alberta (AB) and British Columbia (BC). Note: CHESS = Changes in Health, End-Stage Disease, Signs, and Symptoms Scale.


Tables
Covariate/domain No. (%) of patients; region Ontario
n = 194 094British Columbia
n = 46 359Alberta
n = 13 983Yukon
n = 228Overall
n = 254 664*Age group, yr 65–74 43 941 (23) 6592 (14) 2838 (20) 69 (30) 53 440 (21) 75–84 83 866 (43) 18 767 (40) 5925 (42) 107 (47) 108 665 (43) 85–94 61 763 (33) 19 181 (41) 4885 (35) 50 (22) 85 879 (34) ≥ 95 4524 (2) 1819 (4) 335 (2) 2 (1) 6680 (3) Sex Female 115 723 (60) 27 749 (60) 8331 (60) 122 (54) 151 925 (60) Marital status Married† 88 506 (46) 16 049 (35) NA 70 (31) 104 625 (43) CHESS score 0 32 708 (17) 10 842 (23) 4642 (33) 79 (35) 48 271 (19) 1 60 761 (31) 14 031 (30) 4186 (30) 71 (31) 79 049 (31) 2 57 666 (30) 12 781 (28) 3111 (23) 44 (19) 73 602 (29) 3 33 266 (17) 6284 (14) 1547 (11) 24 (11) 41 121 (16) 4 9030 (5) 2165 (5) 456 (3) 9 (4) 11 660 (5) 5 663 (0) 256 (1) 41 (0) 1 (0) 961 (0) Diagnoses Congestive heart failure 22 860 (12) 6763 (15) 2026 (14) 18 (8) 31 667 (12) Chronic obstructive pulmonary disease 33 603 (17) 8177 (18) 2850 (20) 53 (23) 44 683 (18) Pneumonia 6566 (3) 835 (2) 447 (3) 6 (3) 7854 (3) Diabetes 51 006 (26) 10 172 (22) 3408 (24) 54 (24) 64 640 (25) Arthritis 89 113 (46) 17 804 (38) 6617 (47) 112 (49) 113 646 (45) Renal infection 13 803 (7) 5290 (11) 1099 (8) 6 (3) 20 198 (8) Urinary tract infection 10 724 (6) 2322 (5) 903 (6) 8 (4) 13 957 (5) Dementia 41 128 (21) 17 234 (37) 3620 (26) 51 (22) 62 033 (24) Depression 22 388 (12) 7237 (16) 1906 (14) 16 (7) 31 547 (12) Cancer 34 531 (18) 5593 (12) 1971 (14) 37 (16) 42 132 (17) Nurse visits in the last 7 d 54 906 (28) 5942 (13) 4043 (29) 46 (20) 64 937 (25) Cognitive Performance Scale score 0 75 913 (39) 11 198 (24) 6241 (45) 98 (43) 93 450 (37) 1 or 2 98 933 (51) 26 766 (58) 6390 (46) 108 (47) 132 197 (52) 3 or 4 14 340 (7) 6612 (14) 1010 (7) 21 (9) 21 983 (9) 5 or 6 4908 (3) 1783 (4) 342 (2) 1 (0) 7034 (3) Activities of Daily Living Hierarchy Scale score 0 119 003 (61) 27 841 (60) 10 759 (77) 190 (83) 157 793 (62) 1 or 2 53 350 (27) 12 647 (27) 2343 (17) 28 (12) 68 368 (27) ≥ 3 21 741 (11) 5871 (13) 881 (6) 10 (4) 28 503 (11) Functional improvements in activities of daily living Yes 61 273 (32) 11 045 (24) 3869 (28) 73 (32) 76 260 (30) Covariate/domain No. (%) of patients; region Ontario
n = 113 552British Columbia
n = 22 732Alberta
n = 25 761Overall
n = 162 045*Age group, yr 65–74 12 317 (11) 2409 (11) 2980 (12) 17 706 (11) 75–84 41 164 (36) 7783 (34) 8874 (34) 57 821 (36) 85–94 52 842 (47) 10 771 (47) 11 844 (46) 75 457 (47) ≥ 95 7229 (6.4) 1769 (8) 2063 (8) 11 061 (7) Sex Female 74 023 (65) 14 407 (63) 15 966 (62) 104 396 (64) Marital status Married† 35 651 (31) 6666 (29) NA 42 317 (31) Diagnoses Congestive heart failure 16 504 (15) 3626 (16) 4701 (18) 24 831 (15) Chronic obstructive pulmonary disease 18 375 (16) 3374 (15) 5291 (21) 27 040 (17) Pneumonia 2103 (2) 347 (2) 566 (2) 3016 (2) Diabetes 29 677 (26) 4739 (21) 6079 (24) 40 495 (25) Arthritis 46 807 (41) 6753 (30) 9371 (36) 62 931 (39) Renal infection 11 791 (10) 2769 (12) 2755 (11) 17 315 (11) Urinary tract infection 9758 (9) 1883 (8) 3108 (12) 14 749 (9) Dementia 70 244 (62) 14 521 (64) 15 597 (61) 100 362 (62) Depression 25 913 (23) 4308 (19) 7223 (28) 37 444 (23) Cancer 12 060 (11) 2246 (10) 2666 (10) 16 972 (11) CHESS score 0 55 901 (49) 13 431 (59) 9081 (35) 78 413 (48) 1 36 206 (32) 5882 (26) 8034 (31) 50 122 (31) 2 15 305 (13) 2431 (11) 5425 (21) 23 161 (14) 3 4552 (4) 735 (3) 2257 (9) 7544 (5) 4 1363 (1) 213 (1) 877 (3) 2453 (2) 5 225 (0) 40 (0) 87 (0) 352 (0) Physician examination in last 14 d 96 057 (85) 11 708 (52) 21 038 (82) 128 803 (80) Cognitive Performance Scale score 0 14 444 (13) 2134 (9) 1930 (7) 18 508 (11) 1 or 2 41 830 (37) 8100 (36) 8214 (33) 58 144 (36) 3 or 4 46 466 (41) 9464 (42) 11 640 (45) 67 570 (42) 5 or 6 10 812 (10) 3034 (13) 3977 (15) 17 823 (11) Activities of Daily Living Hierarchy Scale score 0 5238 (4.6) 2298 (10.1) 517 (2) 8053 (5) 1 or 2 29 518 (26) 8157 (36) 5441 (21) 43 116 (27) ≥ 3 78 796 (69) 12 277 (54) 19 803 (77) 110 876 (68) Functional improvements in activities of daily living Yes 27 578 (24) 5930 (26) 6890 (27) 40 398 (25) Advanced directive Do not hospitalize 26 679 (25) 4557 (24) 4664 (31) 35 900 (26) Do not resuscitate 74 464 (70) 13 982 (72) 12 360 (83) 100 806 (71) Facility size, no. of beds 1–49 3764 (3) 1426 (6) 2468 (10) 7658 (5) 50–99 27 656 (24) 7046 (31) 6363 (25) 41 065 (25) 100–149 57 147 (50) 6559 (29) 11 123 (43) 74 829 (46) ≥ 150 24 985 (22) 7701 (34) 5807 (23) 38 493 (24) - Table 3:
Effect of province on home care transitions: odds of transition from baseline health instability score in home care to another health instability score (if the patient stayed in home care) or to hospital, death, long-term care or other setting at 6-mo follow-up
Region Adjusted odds ratio (95% CI) for transition at 6-mo follow-up (T2)* Remained in home care; health instability score† Admitted to hospital Died Admitted to long-term care Discharged to other setting‡ Low (0) Medium (1, 2) High (≥ 3) Alberta (Ref. = Ontario); health instability score at baseline (T1)† Low (0) – 0.82 (0.75–0.90) NS 2.08 (1.92–2.24) 1.80 (1.48–2.20) 0.26 (0.18–0.36) 0.67 (0.62–0.72) Medium (1, 2) 1.85 (1.71–2.00) – NS 2.44 (2.30–2.59) 2.11 (1.84–2.42) 0.42 (0.35–0.49) 1.14 (1.07–1.21) High (≥ 3) 4.83 (3.82–6.12) 1.80 (1.51–2.16) – 3.77 (3.24–4.40) 2.63 (2.09–3.32) NS 2.67 (2.26–3.16) British Columbia (Ref. = Ontario); health instability score at baseline (T1)† Low (0) – 1.44 (1.38–1.51) 1.98 (1.80–2.18) 1.46 (1.39–1.54) 0.46 (0.37–0.56) 0.55 (0.48–0.62) 0.31 (0.30–0.33) Medium (1, 2) 1.67 (1.60–1.73) – 1.45 (1.39–1.52) 1.39 (1.35–1.43) 0.54 (0.49–0.60) 0.76 (0.72–0.81) 0.62 (0.60–0.64) High (≥ 3) 3.13 (2.81–3.48 1.39 (1.30–1.48) – 1.28 (1.21–1.35) 0.39 (0.34–0.45) 0.85 (0.78–0.93) 1.53 (1.44–1.63) Note: CI = confidence interval, NS = not significant, Ref. = reference category.
↵* Multistate transition models were adjusted for home nursing visits, age, sex, marital status, Activities of Daily Living Hierarchy Scale score, Cognitive Performance Scale score, diagnosis (binary variables for chronic obstructive pulmonary disease, pneumonia, diabetes, arthritis, renal failure, urinary tract infection, Alzheimer’s dementia and related dementias, heart failure, cancer, depression), day of stay and functional improvement potential.
↵† Health instability was measured with the Changes in Health, End-Stage Disease, Signs, and Symptoms Scale (CHESS); higher scores indicate greater instability.
↵‡ Other settings typically involved discontinuation of home care services (i.e., discharge from the program).
- Table 4:
Effect of province on long-term care facility transitions (ref = Ontario): odds of transition from baseline health instability score in long-term care to another health instability score (if the patient remained in the same long-term care facility) or to hospital, death, another setting or home at 90-d follow-up
Region Adjusted odds ratio (95% CI) for transition at 90-d follow-up (T2)* Remained in the same long-term care facility; health instability score† Admitted to hospital Died Discharged to other setting‡ Discharged home Low (0) Medium (1, 2) High (≥ 3) Alberta (Ref. = Ontario); health instability score at baseline (T1)† Low (0) – 1.43 (1.37–1.48) 2.02 (1.83–2.23) 0.38 (0.35–0.40) 1.21 (1.09–1.36) 2.31 (1.93–2.77) NS Medium (1, 2) 0.96 (0.92–0.99) – 1.46 (1.38–1.54) 0.39 (0.37–0.41) 0.93 (0.87–0.98) 1.46 (1.24–1.71) NS High (≥ 3) 0.76 (0.66–0.87) 0.77 (0.71–0.85) – 0.39 (0.34–0.43) 0.52 (0.47–0.58) NS NS British Columbia (Ref. = Ontario); health instability score at baseline (T1)† Low (0) – 0.84 (0.77–0.93) 0.84 (0.77–0.93) 0.44 (0.42–0.46) 1.39 (1.28–1.51) 0.74 (0.62–0.90) 0.50 (0.42–0.60) Medium (1, 2) NS – 1.15 (1.08–1.22) 0.51 (0.48–0.53) 1.35 (1.27–1.43) NS 0.55 (0.43–0.70) High (≥ 3) 0.40 (0.34–0.48) 0.55 (0.50–0.61) – 0.33 (0.29–0.37) 0.58 (0.52–0.65) 0.51 (0.31–0.83) 0.52 (0.27–0.99) Note: CI = confidence interval, NS = not significant, Ref. = reference category.
↵* Multistate transition models adjusted for physician visits, age, gender, marital status, ADL Hierarchy scale score, Cognitive Performance Scale score, diagnosis (binary variables for Chronic Obstructive Pulmonary Disease, pneumonia, diabetes, arthritis, renal failure, Urinary tract infection, Alzheimer’s Dementia and Related Dementias, heart failure, cancer, depression), facility size, Advanced directives (i.e., do not resuscitate, do not hospitalize), day of stay, functional improvement potential.
↵† Health instability was measured with the Changes in Health, End-Stage Disease, Signs, and Symptoms Scale (CHESS); higher scores indicate greater instability.
↵‡ Other settings for transitions from nursing homes included discharges to other nursing homes, assisted living or retirement homes.
In this issue

Article tools


Related Articles
Cited By...
- No citing articles found.