


Abstract
Background: Several Canadian public drug plans have income-based deductibles, but we have limited data on their impact, particularly for vulnerable populations. Therefore, we studied the impact of deductibles in British Columbia’s Fair PharmaCare program on drug use among lower-income adults.
Methods: We used a quasi-experimental regression discontinuity design to study the impact of BC rules that impose no deductible before receiving public coverage on households with incomes less than $15 000, a deductible of 2% of household income on those with incomes between $15 000 and $30 000, and a deductible of 3% of household income on those with incomes above $30 000. We studied the impact of these thresholds on public and total drug expenditures between 2003 and 2015 using 24 million person-years of data.
Results: Both thresholds decreased the proportion of beneficiaries receiving benefits, by 0.33 (95% confidence interval [CI] −0.34 to −0.30) and 0.05 (95% CI −0.064 to −0.032) respectively. There were also substantial reductions in the extent of public drug plan expenditures ($59.94 [95% CI −74.74 to −45.14] and $26.12 [95% CI −39.78 to −12.46], respectively). The change at the $15 000 threshold reduced patient drug expenditures by $26.00 (95% CI −45.48 to −6.51), or 7.2%. In contrast, we found no statistically significant change in total expenditures when households moved from a deductible of 2% to 3% at the $30 000 threshold.
Interpretation: Income-based deductibles considerably affected the extent of public subsidy for prescription drugs. For lower-income households making around $15 000, the deductible led to a reduction of 7.2% in overall drug use and costs. Although deductibles are a useful tool to limit public expenditures, policy-makers should be cautious in their use among vulnerable populations.
Drug coverage in Canada varies widely despite universal coverage for physician and hospital services.1 Some provinces, including British Columbia, Saskatchewan, Manitoba, and Newfoundland and Labrador, provide coverage through so-called income-based coverage programs. These programs require households to spend a fixed proportion of their household income on prescription drugs before public coverage takes effect. Other provinces have coverage programs that include deductibles for particular segments of the population, such as Ontario’s Trillium Program for residents aged 25–64 years.
We know from prior surveys that cost-related nonadherence remains an issue for many Canadians.2 Furthermore, the use of deductibles is potentially problematic, as there is extensive evidence, from both Canada and other countries, that out-of-pocket copayments reduce the use of essential drugs.3–5 However, the specific impact of income-based deductibles remains less clear. For example, an analysis done shortly after BC’s income-based plan Fair PharmaCare was implemented, in 2003, suggested the plan did not alter population-level prescription drug use,6 whereas, evidence from Manitoba suggested that income-based deductibles decreased the use of inhaled corticosteroids by children with asthma.7 Yet as with the BC study, the prior coverage regimen in Manitoba included a deductible per family.7 Our recent study using a regression discontinuity design showed that income-based deductibles did not affect overall use of drugs or health care services.8 That study, however, focused on older adults, and, therefore, the results may not be generalizable to other segments of the population.
The implications of the existing evidence on the impact of income-based deductibles on drug use for specific populations in Canada are unclear. Prior work in the United States showed that deductibles can reduce expenditures, but it is unclear for whom.9 This uncertainty has led to a major debate on the role that income-based deductibles should play in Canadian drug plans. For example, although a report from the Institute for Research on Public Policy indicated that Fair PharmaCare should not be emulated in other provinces,10 other bodies such as the C.D. Howe Institute have recommended it as a model policy for reforming Ontario’s public drug plan.11 One important aspect of this debate is the degree to which government can offset expenditures while minimizing the impact on patients. To help inform this debate, we studied the impact of 2 thresholds in BC’s Fair PharmaCare using a strong observational study design with a particular focus on lower-income adults.
Methods
Context
British Columbia offers residents public drug coverage through the Fair PharmaCare program, which provides drug coverage to all residents with a deductible that is based on household income. The plan covers a comprehensive list of prescription drugs. Fair PharmaCare deductibles are determined based on net household income, verified by the Canada Revenue Agency, from 2 years prior. The program operates alongside universal hospital and physician coverage for medically necessary services that does not use patient copayments.
Our study leveraged “breaks” in coverage created by 2 changes in the deductible structure of Fair PharmaCare. One such break occurs at $15 000, where households move from having no deductible to having a deductible equivalent to 2% of household income. A second break, at $30 000, requires households to spend 3% of net household income before receiving public coverage. Beyond these thresholds, households must pay 30% of the cost of prescription drugs up to a household maximum of 3% and 4%, respectively. These 2 thresholds introduce substantial discontinuities into the out-of-pocket obligations for households just below and just above these 2 income levels (Appendix 1, available at www.cmajopen.ca/content/7/1/E167/suppl/DC1). For instance, a household with a total income of $14 999 would have no deductible and pay a maximum of $300 per year, whereas one with an income of $15 000 would have a $300 deductible and pay a maximum of $450.
Data sources
We obtained data from the BC PharmaNet system, a population-based administrative data system on drug dispensations in BC between 2003 and 2015. As all community pharmacies are required to submit claims through this system, the database is highly accurate and complete, capturing all drug dispensations in the community setting in real time. Using PharmaNet, we captured data on individual prescriptions, including drug information, total cost and the publicly paid portion.
Population
Our study focused on a population-based open cohort of people eligible for BC Fair PharmaCare coverage during the study period. We included only those who registered for Fair PharmaCare, as household income data were not available for nonregistered households. In fiscal 2016/17, 1 253 497 families, representing about two-thirds of BC’s 1 881 970 households, 12 were registered for Fair Pharmacare.13 People who received drug benefits through the federal government were also excluded as they would not have been subject to the same program rules.
This analysis included all enrollees who were consistently eligible for the standard Fair PharmaCare benefit (known as Plan I) in each calendar year and for whom verified income information was available. Given the structure of Fair PharmaCare, this would include only people born after 1939, as those born in 1939 or earlier would have been eligible for so-called enhanced assistance, which had lower deductibles. Plan I is the largest of BC’s pharmacare programs and is open to all BC residents. Other pharmacare programs are available for people receiving social assistance, those with particular illnesses and those in residential care facilities.13 Importantly for this analysis, Plan I is the only program that includes the described deductibles. We focused our analysis on households with incomes of $61 667 or less. We chose this threshold as it represented the top end of the income bracket that was double the $30 000 threshold. We defined this a priori and assumed it would give us enough points to fit a smooth line without being unduly influenced by higher income levels. As we could obtain only 1 of the 25 different Fair PharmaCare income bands for each person, we assigned each person the midpoint income within each Fair Pharma-Care plan code for all analyses (e.g., we used $22 500 for Plan Code IB, which includes households with incomes between $21 250 and $23 750).
The unit of analysis was the person-year. We excluded any residents who had claims under any other Fair PharmaCare plan (B, C, D, F, G or P) during the year(s) in question to limit potential contamination from other plans that do not impose the same deductible structure. We also excluded person-years in which the person changed income bands during the year in question.
Outcome measures
We studied the impact of income-based deductibles on outcomes within 2 broad categories:
System-level outcomes: We calculated the proportion of enrollees in each income band per person-year to estimate the impact of deductibles on the proportion receiving any public drug plan benefits. Second, we calculated the average amount paid by the public Fair PharmaCare program per person-year to estimate the impact of deductibles on the extent of public plan spending.
Patient-level outcomes: We calculated the average total prescription drug expenditure (including both public and private portions), the average number of prescriptions dispensed and the number of unique medicines (based on Anatomical Therapeutic Chemical Classification System level 7 codes) per person-year in our cohort.
Statistical analysis
We used a regression discontinuity analysis, one of the strongest quasi-experimental research designs, to study the impact of deductibles on our outcomes.14,15 This method leverages the quasi-random nature of the change in program design at the $15 000 and $30 000 household income thresholds to derive causal estimates of real-world impacts.16 As people on either side of these thresholds are likely similar on other characteristics, any abrupt differences in their drug use may be attributed to the effects of the plan design. The major assumption in such an analysis is that all potential confounders do not have abrupt changes across this threshold. Regression discontinuity designs have a long history in economics, and their use is increasing within the medical literature.17,18
To fit our statistical models, we first determined the average for each outcome across all person-years in our data set within each income band. As the use of deductibles varied based on household income, this was the forcing variable in our models. Using these aggregate figures, we fit linear regression models that included breaks at both thresholds, as well as linear and quadratic trend parameters within each group:
where X represents the forcing variable of household income, and 15 000 and 30 000 represent the 2 cut-off points. The parameters of interest from the regression results are β3, which represents the change in the outcome at the $15 000 income threshold, and β6, which represents the change in the outcome at the $30 000 threshold.
Ethics approval
The study was approved by the University of British Columbia Behavioural Research Ethics Board.
Results
Cohort characteristics
After we excluded 11 420 158 person-years with income greater than $61 666, our final cohort consisted of 12 706 804 person-years contributed by 2 178 162 unique individuals. The cohort had slightly more females than males (51.6% v. 48.4%), and the average age of people in their first year in the cohort was 38.1 years. The mean number of prescriptions dispensed per year was 6.7 (Table 1).
Descriptive characteristics of the contributing person-years
System-level outcomes
Analysis of the proportion of enrollees receiving Fair Pharma-Care benefit payments showed that the move from no deductible to a deductible of 2% of household income led to an absolute decrease of 33% (95% CI −0.34 to −0.30) in the proportion of enrollees receiving public benefits, from 54% to 21% (Figure 1). This represents a relative decrease of 61%. We found a smaller reduction (5%, 95% CI −0.064 to −0.032) in the proportion receiving benefits at the $30 000 threshold, from 18% to 13%.
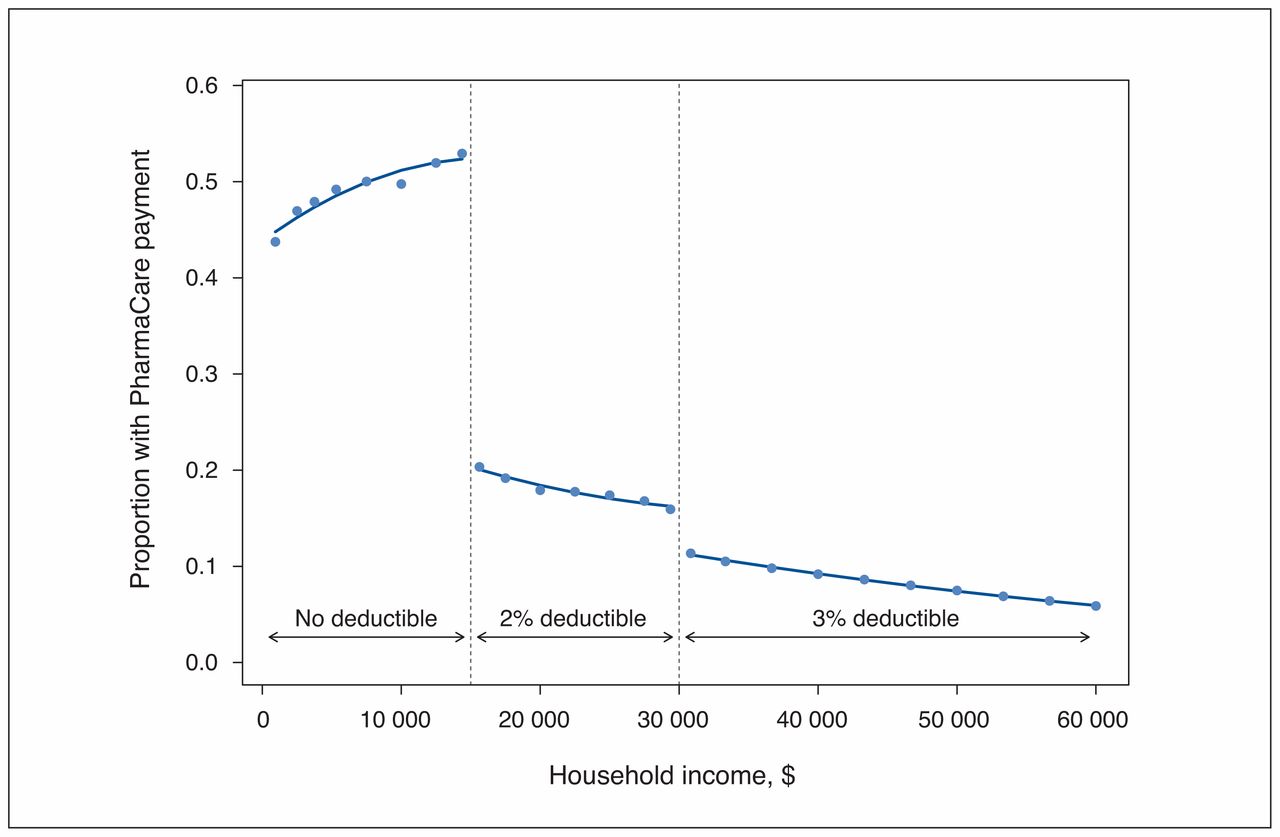
Regression discontinuity analysis across income thresholds of mean proportion of beneficiaries with a claim where Fair PharmaCare paid a portion.
Consistent with this decrease in the proportion receiving benefits, we found substantial decreases in the extent of public drug plan expenditures across the 2 income thresholds. There was a reduction of $59.94 (95% CI −74.74 to −45.14) in the mean annual Fair PharmaCare reimbursement at the $15 000 threshold, representing a relative decrease of 27%, and a decrease of $26.12 (95% CI −39.78 to −12.46) at the $30 000 threshold (Figure 2).

Regression discontinuity analysis of mean annual drug expenditures by the Fair PharmaCare program across income thresholds.
Patient-level outcomes
In comparison to the large difference in public subsidies, we found smaller changes in patient drug use and costs at the 2 income thresholds. There was a reduction of $26.00 (95% CI −45.48 to −6.51) in annual total drug expenditures at the $15 000 threshold (Figure 3). This represented an absolute decrease of 7.2% in total expenditures when households moved across the threshold from no public drug plan deductible to a deductible of 2% of household income. In contrast, we found no statistically significant change in total expenditures when households moved from deductibles of 2% to 3% of household income at the $30 000 threshold (estimate $6.10, 95% CI −24.08 to 11.89).

Regression discontinuity analysis of average total prescription drug expenditure above and below the income thresholds.
Analysis of total prescriptions showed only small reductions in the average number of individual prescriptions received. We found nonsignificant reductions of 0.35 prescriptions (95% CI −0.79 to 0.09) at the $15 000 threshold and 0.14 prescriptions (95% CI −0.54 to 0.267) at the $30 000 threshold (Figure 4). We also found a small decrease in the number of unique medicines received: the average annual number of unique drugs filled above and below the $15 000 thresholds was reduced by 0.07 drugs (95% CI −0.12 to −0.03) per beneficiary, an absolute decrease of 4.8% (Figure 5). We found no significant change in the number of unique medicines received at the $30 000 threshold (estimate 0.00, 95% CI −0.04 to 0.04).
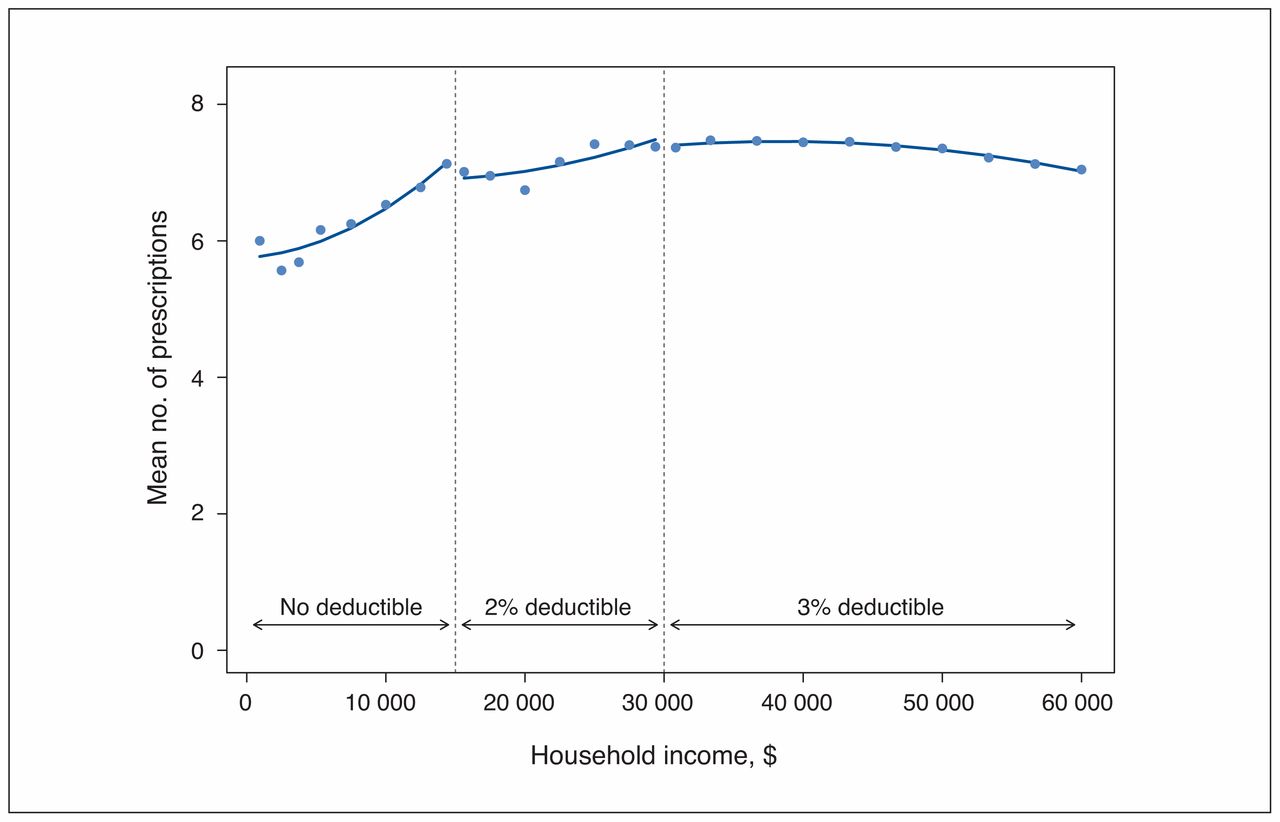
Regression discontinuity analysis of average annual number of prescriptions filled above and below the income thresholds.
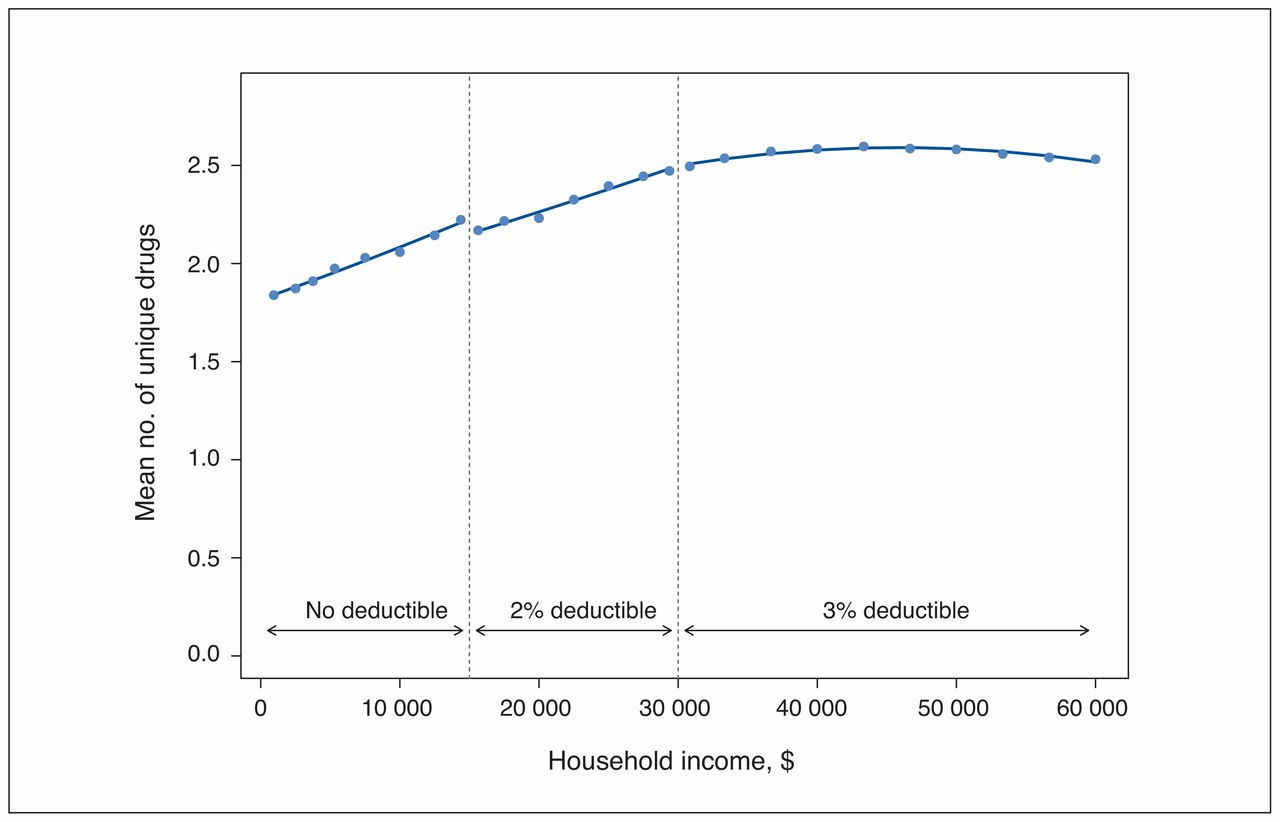
Regression discontinuity analysis of average annual number of unique drugs (Anatomical Therapeutic Chemical Classification System level 7) filled above and below the income thresholds.
Interpretation
In this quasi-experimental study of the impact of household-level deductibles on drug use, we found that, for lower-income households with incomes around $15 000, deductibles led to a notable reduction in the proportion of beneficiaries who receive any public subsidy, as well as in overall drug use and costs. In contrast, once at an income of $30 000, a move from a deductible of 2% of household income to 3% of household income appeared to have no notable impact on these same outcomes.
Our results suggest that the impact of deductibles differs between different populations in BC. In contrast, our prior study examining a very similar change from no deductible to a deductible of 2% of household income for those born in 1939 or earlier and after 1939 showed no change in overall drug use.8 Although the population in that study had incomes just above the threshold in the present study ($15 000–$30 000), we believe that the major difference is the age of the populations under study — an average age of 66 years in the prior study versus 38 years in the present study. This is consistent with differences in cost-related nonadherence reported in a survey study, in which younger populations consistently reported more issues in affording their prescription drugs than did older populations.19 Our lack of an impact of the change from a deductible of 2% of household income to 3% of household income at $30 000 suggests that, beyond a certain income level, marginal changes in the deductible may not be major determinants of drug access.
Limitations
As with any analysis of administrative claims data, our study has several limitations worth noting. First, we did not have data on the clinical indication for the prescriptions that were written, nor did we have information on the characteristics of prescriptions that were foregone by people at different income levels. Furthermore, we lacked data on the presence or lack of private drug insurance held by the person in question or another person such as a spouse. This is a major missing factor in our analysis, particularly as private insurance would insulate them from paying the Fair PharmaCare deductibles. It is important to note, however, that private insurance does cover 60% of Canadians,20 and, thus, we feel that our results represent the true impact of income-based deductibles in Canada. In addition, we feel that the presence of employer-based coverage would likely not have biased our results, as there is no reason to believe that there is an abrupt change in private coverage at a household income of $15 000 or $30 000. This also precluded our ability to examine changes in out-of-pocket payments across the income thresholds. Our analysis was restricted to those who were registered for Fair PharmaCare. Although it is unknown whether there are sociodemographic differences between those who register and those who do not, lower-income people without private insurance are more likely than those with higher incomes to rely on public drug programs. Thus, this restriction is unlikely to have biased our significant result at the $15 000 threshold. Finally, we were unable to assess the impact of deductibles on patient outcomes or the use of other health care services.
Conclusion
Our results suggest that public drug coverage programs should be cognizant of how using income-based deductibles may affect the members of their plans. In particular, our results show that the current use of deductibles is offsetting significant public expenditure in BC. Furthermore, this is having an impact on prescription drug use for households with low incomes, reducing it by an estimated 7.2%, but an increase in the deductible at a higher income level did not have a similar impact. Moves in the US to cover first-line medicines for chronic conditions — so-called value-based insurance designs — might provide a model for how to exempt certain classes from deductibles to avoid this type of impact.21,22 Moreover, it will be important to assess the impact of changes to the deductible structure by the BC government that will increase the threshold for the imposition of deductibles to $30 000 on Jan. 1, 2019.
Footnotes
Competing interests: Michael Law has consulted for Health Canada and the Hospital Employees’ Union, and acted as an expert witness for the Attorney General of Canada. Muhammad Mamdani has served as an advisory board member for AstraZeneca, Bristol-Myers Squibb Canada, Eli Lilly and Company, GlaxoSmithKline, Hoffmann–La Roche, Novartis Pharmaceuticals Canada, Novo Nordisk and Pfizer Canada. No other competing interests were declared.
This article has been peer reviewed.
Contributors: Michael Law conceived of the study, acquired the data and drafted the manuscript. Sumit Majumdar, Kimberlyn McGrail, Fiona Chan, Tracey-Lea Laba and Muhammad Mamdani made substantial contributions to the design of the work. Lucy Cheng and Heather Worthington analyzed the data. Lucy Cheng, Heather Worthington, Sumit Majumdar, Kimberlyn McGrail, Fiona Chan, Tracey-Lea Laba and Muhammad Mamdani revised the manuscript for important intellectual content. All of the authors interpreted the data, gave final approval of the version to be published and agreed to act as guarantors of the work.
Disclaimer: Data for this study were obtained via Population Data BC, including data from the BC PharmaNet system. All inferences, opinions and conclusions drawn in this publication are those of the authors and do not reflect the opinions of Population Data BC or the data steward(s).
Funding: This analysis was funded by a research grant from the Institute for Health System Transformation and Sustainability. Michael Law received salary support through a Canada Research Chair and a Michael Smith Foundation for Health Research Scholar Award. Sumit Majumdar held the Endowed Chair in Patient Health Management, supported by the Faculties of Medicine and Dentistry and of Pharmacy and Pharmaceutical Sciences, University of Alberta.
Supplemental information: For reviewer comments and the original submission of this manuscript, please see www.cmajopen.ca/content/7/1/E167/suppl/DC1.
References
- Copyright 2019, Joule Inc. or its licensors
In this issue

Article tools


Related Articles
Cited By...
- No citing articles found.