


Article Figures & Tables
Figures
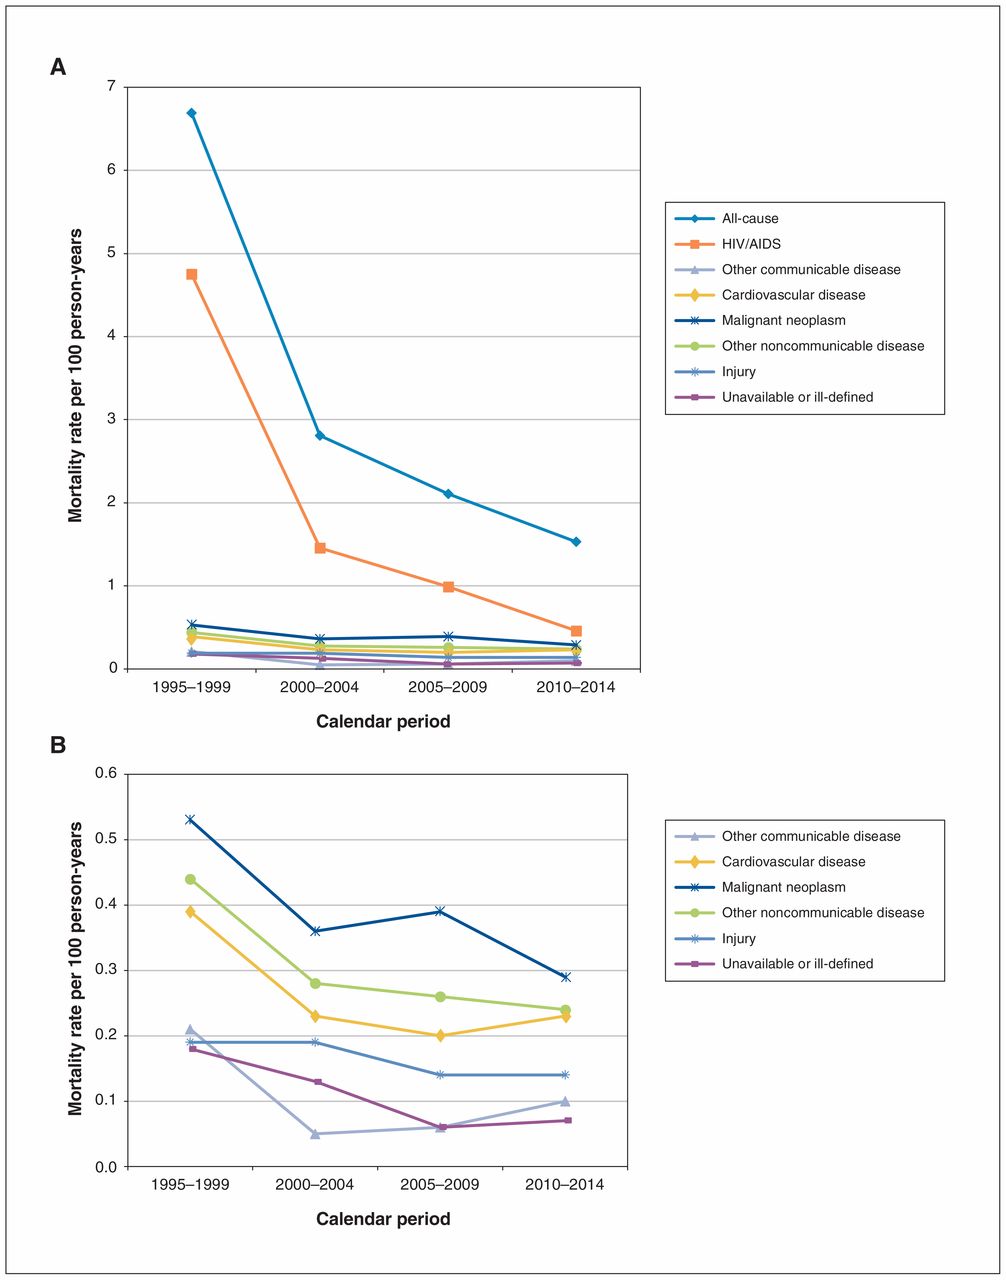
- Figure 1
All-cause (A) and cause-specific (B) age-adjusted mortality rate per 100 person-years among HIV-infected people in Ontario, 1995–2014.

Tables
- Table 1
Characteristics of HIV-infected people at the start of follow-up, Ontario, 1995–2014
Characteristic No. (%) of people*
n = 23 043Year of presentation for HIV infection care 1994 or earlier 5647 (24.5) 1995–1999 4827 (20.9) 2000–2004 4188 (18.2) 2005–2009 4541 (19.7) 2010–2014 3840 (16.7) Age at start of follow up, yr, mean ± SD 37.89 ± 11.2 Age at start of follow up, yr ≤ 25 2366 (10.3) 26–35 8454 (36.7) 36–45 7425 (32.2) 46–55 3212 (13.9) ≥ 56 1586 (6.9) Female sex 4360 (18.9) Urban/rural residence Major urban centre 20 625 (89.5) Nonmajor urban centre 1509 (6.5) Rural 595 (2.6) Missing 314 (1.4) Neighbourhood income quintile 1 (lowest) 7165 (31.1) 2 4789 (20.8) 3 3845 (16.7) 4 3285 (14.2) 5 (highest) 3387 (14.7) Missing 572 (2.5) Immigrant status Long-term resident† 18 891 (82.0) Immigrant from nonendemic country 1735 (7.5) Immigrant from country with generalized HIV infection epidemic 2417 (10.5) - Table 2
Age-adjusted all-cause and cause-specific mortality rates per 100 person-years among HIV-infected people in Ontario, 1995–2014
Cause of death 1995–1999 2000–2004 2005–2009 2010–2014 No. (%) of deaths Mortality rate per 100 person-years* (95% CI) No. (%) of deaths Mortality rate per 100 person-years* (95% CI) No. (%) of deaths Mortality rate per 100 person-years* (95% CI) No. (%) of deaths Mortality rate per 100 person-years* (95% CI) Any 1895 (100.0) 6.69 (6.22–7.19) 1024 (100.0) 2.81 (2.57–3.06) 1081 (100.0) 2.11 (1.95–2.27) 1015 (100.0) 1.53 (1.42–1.64) HIV/AIDS 1506 (79.5) 4.75 (4.39–5.14) 619 (60.4) 1.46 (1.30–1.63) 602 (55.7) 0.99 (0.89–1.09) 353 (34.8) 0.46 (0.41–0.52) Other communicable disease 50 (2.6) 0.21 (0.13–0.32) 24 (2.3) 0.05 (0.03–0.09) 30 (2.8) 0.06 (0.04–0.10) 68 (6.7) 0.10 (0.07–0.13) Cardiovascular disease 56 (3.0) 0.39 (0.32–0.47) 69 (6.7) 0.23 (0.19–0.27) 73 (6.8) 0.20 (0.15–0.26) 124 (12.2) 0.23 (0.19–0.28) Malignant neoplasm 75 (4.0) 0.53 (0.37–0.71) 97 (9.5) 0.36 (0.27–0.47) 155 (14.3) 0.39 (0.32–0.47) 183 (18.0) 0.29 (0.24–0.34) Other noncommunicable disease 82 (4.3) 0.44 (0.31–0.6) 79 (7.7) 0.28 (0.20–0.38) 99 (9.2) 0.26 (0.21–0.33) 149 (14.7) 0.24 (0.20–0.29) Injury 76 (4.0) 0.19 (0.13–0.28) 96 (9.4) 0.19 (0.14–0.24) 87 (8.0) 0.14 (0.10–0.18) 96 (9.4) 0.14 (0.11–0.17) Unavailable or ill-defined 50 (2.6) 0.18 (0.11–0.27) 40 (3.9) 0.13 (0.08–0.19) 35 (3.2) 0.06 (0.04–0.10) 42 (4.1) 0.07 (0.05–0.09) Note: CI = confidence interval.
↵* Age-adjusted rate, standardized to the 2011 Ontario population.
In this issue

Article tools
Respond to this article


Related Articles
Cited By...
- The burden of cancer among people living with HIV in Ontario, Canada, 1997-2020: a retrospective population-based cohort study using administrative health data
- British Columbia CARMA-CHIWOS Collaboration (BCC3): protocol for a community-collaborative cohort study examining healthy ageing with and for women living with HIV