


Abstract
Background: Negative health outcomes associated with the use of both prescribed and nonprescribed opioids are increasingly prevalent. We examined long-term trends in opioid-related harms in Ontario across a set of 6 indicators and the relation between harms and neighbourhood income in 2016.
Methods: We examined rates of neonatal abstinence syndrome, opioid poisoning (fatal and nonfatal) and nonpoisoning opioid-related events from 2003 to 2016 in Ontario using population-based health administrative databases. We conducted descriptive analyses for harm indicators across neighbourhood income quintiles in 2016 (2015 for death). We examined social inequalities in opioid-related harms on both relative (prevalence ratio) and absolute (potential rate reduction) scales.
Results: Rates of opioid-related harms increased dramatically between 2003 and 2016. In 2016, neonatal abstinence syndrome and opioid poisoning and nonpoisoning events showed a strong social gradient, with harm rates being lowest in higher-income neighbourhoods and highest in lower-income neighbourhoods. Prevalence ratios for the lowest-income neighbourhoods compared to the highest-income neighbourhoods ranged from 2.36 (95% confidence interval [CI] 2.15–2.58) for emergency department visits for opioid poisoning to 3.70 (95% CI 2.62–5.23) for neonatal abstinence syndrome. Potential rate reductions for opioid-related harms ranged from 34.8% (95% CI 29.1–40.1) to 49.9% (95% CI 36.7–60.5), which suggests that at least one-third of all harmful events could be prevented if all neighbourhoods had the same socioeconomic profile as the highest-income neighbourhoods.
Interpretation: Rates of opioid-related harms increased in Ontario between 2003 and 2016, and people in lower-income neighbourhoods experienced substantially higher rates of opioid-related harms than those in higher-income neighbourhoods. This finding can inform planning for opioid-related public health interventions with consideration of health equity.
In the past 25 years, rates of opioid-related death in Ontario have increased by 285%, with 867 deaths in the province in 2016 alone.1 This increase, consistent with those seen across Canada and internationally, has been associated with the widespread dispensing of prescription opioids. 2–5 Globally, Canada is the second-largest consumer of prescription opioids, with Ontario having the highest dispensing rates of potent opioids in the country.6,7 Adding to the challenge of high rates of opioid exposure in the population is the availability of fentanyl in the illicit drug supply, which has led to a rapidly growing number of opioid-related deaths in both the United States and Canada.1,8,9
Previous analyses of opioid-related harms in Ontario have focused almost exclusively on the burden of accidental and intentional opioid poisoning, which provides an important but limited assessment of the array of harms related to opioid use. We aimed to expand on this by investigating trends in less common indicators of opioid use, such as opioid dependence and neonatal abstinence syndrome. Furthermore, unemployed people and those living in poverty are especially at risk for opioid-related harms: studies have shown increased poisonings occurring after income assistance payments, and deaths during economic downturns.10–14 Our objectives in the present study were twofold. The first was to identify long-term trends in the prevalence of multiple indicators of opioid-related harms — neonatal abstinence syndrome, opioid poisoning (emergency department visit, hospital admission and death) and nonpoisoning opioid-related events (emergency department visit and hospital admission) — in Ontario from 2003 to 2016. Our second objective was to conduct a descriptive analysis of these indicators and their relation with neighbourhood income in 2016.
Methods
Data sources and case identification
To complete our first objective, we conducted a population-based assessment including all cases of opioid-related illness and death identified in population-based health administrative data sets in Ontario from 2003 to 2016. We extracted age, sex, date of hospital admission, postal code of residence and all diagnosis codes for all cases. We used the following databases to capture morbidity: the Canadian Institute for Health Information Discharge Abstract Database, which captures administrative and demographic information on Canadian hospital discharges, 15 the National Ambulatory Care Reporting System, which contains clinical information for all hospital-based ambulatory care,16 and the Ontario Mental Health Reporting System, which contains administrative data on adult acute care mental health beds.17 Data from these sources have been shown to be valid and reliable.18 We retrieved data on opioid-related deaths from the Ontario Opioid-Related Death Database, the methods for which have been described previously.19 The database now contains detailed information on all opioid-related deaths that occurred in Ontario between 1991 and 2016, as determined by the Office of the Chief Coroner of Ontario. Case counts can shift slightly over time as confirmed cases from the Office of the Chief Coroner are entered. At the time of data extraction for this study, death data were available only to 2015.
Neonatal abstinence syndrome is defined by withdrawal symptoms an infant may experience after birth if the mother used certain medications or other substances during pregnancy. 20 We identified cases of neonatal abstinence syndrome in the Discharge Abstract Database by International Statistical Classification of Diseases and Related Health Problems, 10th revision, enhanced Canadian version (ICD-10-CA) code P96.1. Cases were excluded if the infant was older than 28 days. One case was counted per infant regardless of how many times the infant was admitted to hospital in the first 28 days of life.
Opioid poisoning includes any therapeutic, intentional, accidental or unknown use of opioids resulting in poisoning. We identified opioid poisoning resulting in an emergency department visit, hospital admission or death from the National Ambulatory Care Reporting System, Discharge Abstract Database and Ontario Opioid-Related Death Database, respectively. We identified unique cases by ICD-10-CA codes for poisoning by drugs, medicaments and biological substances (T40.0–40.4, T40.6).
Nonpoisoning opioid-related events include any harmful effect of opioid use that does not result in poisoning, such as opioid use disorder or opioid withdrawal. We identified nonpoisoning emergency department visits from the National Ambulatory Care Reporting System, and hospital admissions from the Discharge Abstract Database and Ontario Mental Health Reporting System. We identified unique cases of nonpoisoning opioid-related events resulting in an emergency department visit or hospital admission by ICD-10-CA codes for mental and behavioural disorders due to use of opioids (F11.0–F11.9). We identified nonpoisoning opioid-related admissions to a mental health hospital by Diagnostic and Statistical Manual of Mental Disorders, fourth edition, text revision21 codes 305.50 and 304.00, and Diagnostic and Statistical Manual of Mental Disorders, fifth edition22 codes 305.50 and 304.00. For all indicators, cases were excluded if they had a query or suspect diagnosis.
Quantifying neighbourhood income
To complete our second objective, we quantified neighbourhood income in Ontario using the 2011 Statistics Canada Annual Estimates for Census Families and Individuals (T1 Family File) after-tax low-income measure.23 The low-income measure is defined as 50% of the median census family income for a given family type and size. We used tax filer data from 2011 on the basis of availability and because Statistics Canada data showed that the proportion of low-income residents in Ontario did not change substantially from 2011 to 2015.24
For the purposes of this investigation, we ranked Ontario dissemination areas by the proportion of census families in the area earning less than the after-tax low-income measure. Dissemination areas are made up of about 400–700 people living in 1 or more adjacent city blocks, as defined by the Statistics Canada Census Program; there were 19 688 dissemination areas in Ontario in 2011.25 We categorized dissemination areas into quintiles, with quintile 1 comprising areas with the lowest income and quintile 5 comprising areas with the highest income. We excluded 327 dissemination areas from the quintile calculation as they had a population of 0 or tax information was suppressed in the data because fewer than 100 people in the area filed tax returns. Descriptive characteristics of each income quintile are given in Supplementary Table A1, Appendix 1, available at www.cmajopen.ca/content/6/4/E478/suppl/DC1.
Geocoding of cases to income quintiles
Postal code boundaries in Canada do not directly align with dissemination area boundaries. To mitigate this, we geocoded cases of neonatal abstinence syndrome and opioid poisoning and nonpoisoning events to their corresponding census dissemination areas by joining the postal code of residence with the Statistics Canada Postal CodeOM Conversion File.26 We used the single-link indicator if the postal code of a case corresponded to more than 1 dissemination area. The single-link indicator determines the postal code to which a dissemination area corresponds by determining where the majority of dwellings in a given postal code are located.
Rate calculations
We obtained annual counts of live births in Ontario hospitals from 2003 to 2016 from the Discharge Abstract Database and used them as the denominator to calculate yearly rates of neonatal abstinence syndrome. We obtained Ontario population estimates for 2003 to 2015 and projections for 2016 from IntelliHealth Ontario and used them as the denominator to calculate yearly rates of opioid-related poisoning and nonpoisoning events.27,28
To calculate quintile-specific rates for neonatal abstinence syndrome and opioid poisoning and nonpoisoning events, we first created our quintiles as determined by the 2011 Statistics Canada T1 Family File. However, because the Ontario population grew by about 700 000 between 2011 and 2016, the total population estimated by the T1 Family File is markedly smaller than the current Ontario population. Therefore, if we were to create quintile-specific rates of neonatal abstinence syndrome and opioid poisoning and nonpoisoning events using this measure of population, they would be overestimates of the true incidence. To account for this, we calculated the proportion of the population in each income quintile as estimated by the T1 Family File and applied it to the total Ontario 2016 population used in our yearly rates to create a more accurate denominator. We were then able to compare our annual rates for neonatal abstinence syndrome and opioid poisoning and nonpoisoning events to our quintile-specific rates. Owing to a lack of data on opioid-related deaths for 2016, we calculated quintile-specific rates for deaths for 2015.
Statistical analysis
We calculated crude rates and 95% confidence intervals (CIs) of neonatal abstinence syndrome, opioid poisoning and nonpoisoning opioid-related events in the population and across income quintiles. We calculated prevalence ratios (PRs) and corresponding 95% CIs by comparing rates of neonatal abstinence syndrome and opioid poisoning and nonpoisoning events in the lowest quintile to those in the highest quintile. We calculated potential rate reductions (PRRs) and corresponding 95% CIs for each opioid-related indicator.29 The PRR represents the potential reduction in rates of a health outcome if all groups had the same income profile as the highest income quintile. A higher PRR represents greater inequality in the population. We calculated attributable cases and corresponding 95% CIs by multiplying each PRR by the total number of cases in the population for a given indicator. The attributable cases represent the absolute number of cases in a population that could be prevented if all groups experienced the same rate of opioid-related harms as the highest income quintile. All statistical analyses were conducted with the use of SAS version 9.3 statistical software (SAS Institute).
Ethics approval
This project was approved by the Public Health Ontario Ethics Review Board.
Results
Descriptive statistics
Table 1 presents the distribution of neonatal abstinence syndrome, emergency department visits and hospital admissions for opioid poisonings and nonpoisoning events (2016) and for opioid-related deaths (2015) by age, sex and income quintile related to the most recent available data. Opioid poisoning and nonpoisoning events occurred primarily in people aged 25–64 years. Hospital admission for both opioid poisoning and nonpoisoning events was relatively evenly distributed between the sexes, whereas the proportions of deaths and poisoning and nonpoisoning emergency department visits were higher among males than among females. People from lower income quintiles, particularly the lowest quintile, were more likely to experience opioid-related events across all indicators than those from higher income quintiles.
Descriptive characteristics of neonatal abstinence syndrome and opioid poisoning and nonpoisoning events in 2016, and opioid-related death in 2015
Long-term trends in the prevalence of opioid-related harms
Figure 1 presents crude rates of neonatal abstinence syndrome, opioid poisoning and nonpoisoning opioid-related events in Ontario from 2003 to 2016. Annual rates and corresponding 95% CIs for neonatal abstinence syndrome and opioid poisoning and nonpoisoning events can be found in Supplementary Table A2, Appendix 1. Over the study period, the percent change in indicator rates ranged from an increase of 39.8% in opioid poisoning hospital admissions to an increase of 499.9% in neonatal abstinence syndrome. From 2014 to 2016, however, rates of neonatal abstinence syndrome held relatively constant, around 6.5 cases per 1000 live births. Rates of emergency department visits for nonpoisoning events increased by 286.0%, from 14.06 per 100 000 in 2003 (n = 1721) to 54.26 per 100 000 in 2016 (n = 7575). Despite a large absolute decrease in nonpoisoning emergency department visits between 2011 (n = 7046) and 2014 (n = 5659), rates returned to their previous levels in 2016.

Crude rates of neonatal abstinence syndrome (A) and opioid poisoning and nonpoisoning events (B) in Ontario, 2003–2016. Note: ED = emergency department.
Rates of opioid-related harms by income quintile
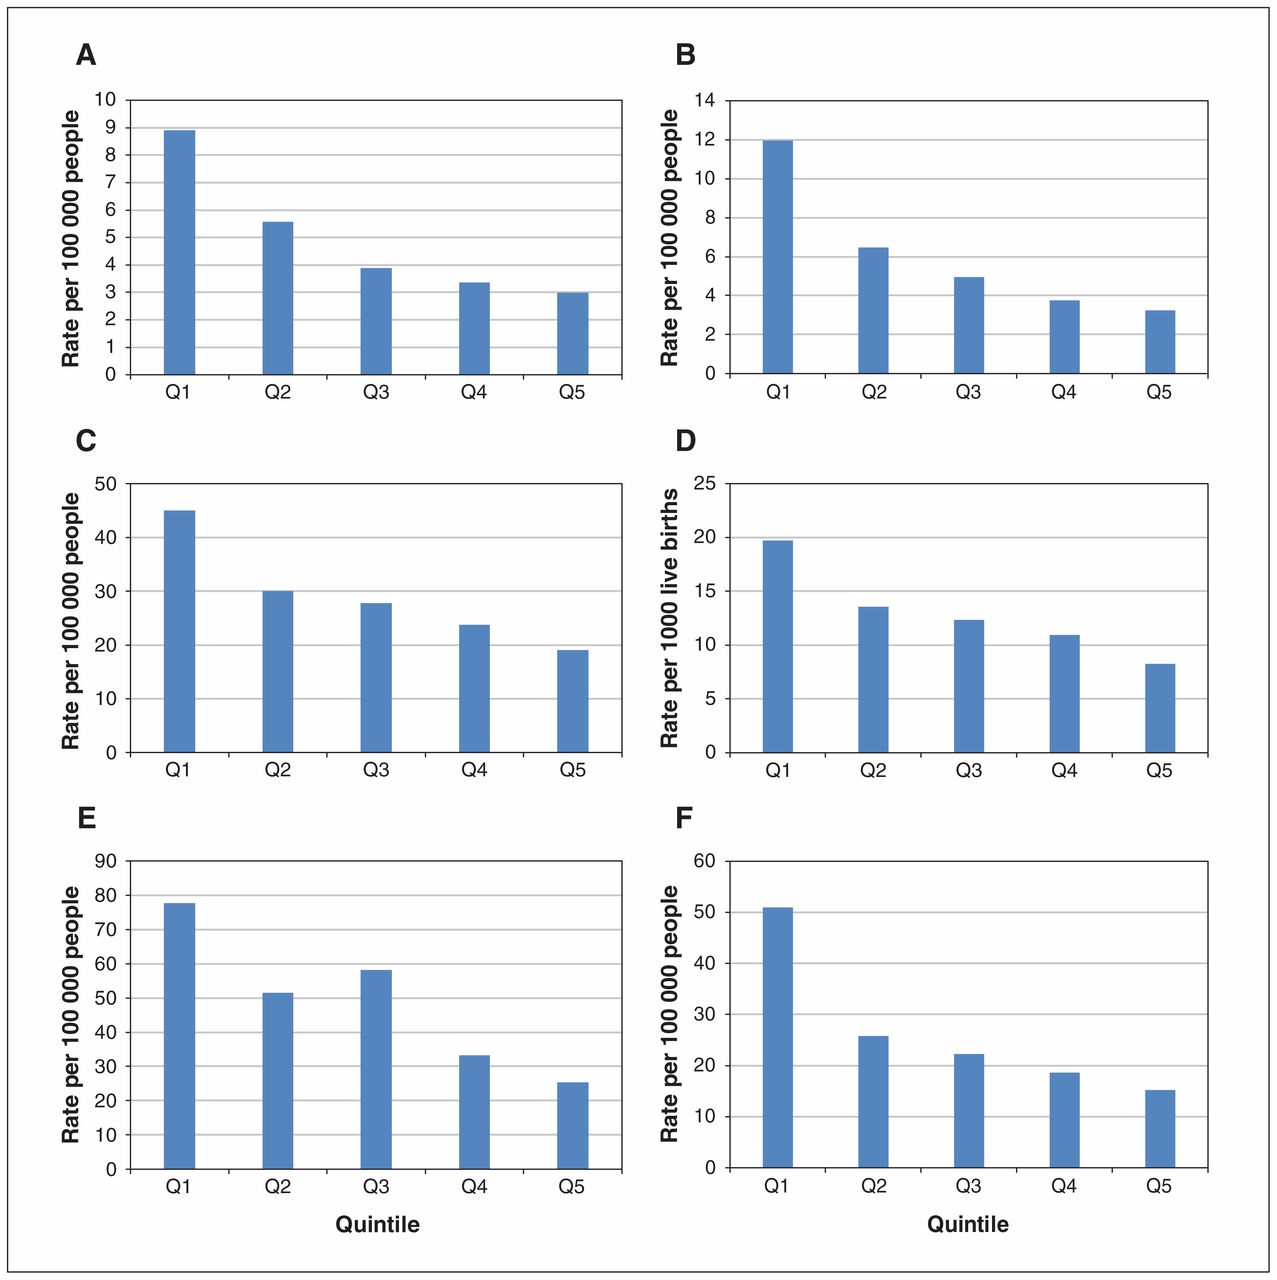
Figure 2 presents crude rates of each outcome in 2016 (2015 for death) by income quintile. All indicators showed a social gradient, with rates of opioid-related harms increasing from the highest to the lowest income quintile. The rates of opioid-related harms differed most between the highest and lowest income quintiles for neonatal abstinence syndrome (3.23 v. 11.95 per 1000 live births), nonpoisoning hospital admissions (15.27 v. 51.03 per 100 000 people) and nonpoisoning emergency department visits (25.36 v. 74.36 per 100 000 people).

Crude rates of emergency department visits (A) and hospital admission (B) for opioid poisoning, nonpoisoning opioid-related emergency department visits (E) and hospital admission (F), and neonatal abstinence syndrome (D) by neighbourhood income quintile in Ontario in 2016, and of opioid-related death by neighbourhood income quintile in Ontario in 2015 (C). Note: Q1 = lowest-income neighbourhood, Q5 = highest-income neighbourhood.
Prevalence of opioid-related harms and cases attributable to income inequality
Table 2 presents the PR, PRR and absolute number of cases attributable to socioeconomic inequalities in the population for neonatal abstinence syndrome and opioid poisoning and nonpoisoning events. Significant social inequalities were observed on both absolute and relative scales. Compared to living in the highest-income neighbourhoods, living in the lowest-income neighbourhoods was associated with at least double the prevalence of opioid-related harms for neonatal abstinence syndrome (PR 3.70, 95% CI 2.62–5.23), hospital admission (PR 2.38, 95% CI 2.07–2.73) and emergency department visits (PR 2.36, 95% CI 2.15–2.58) for opioid poisoning, death (PR 2.99, 95% CI 2.25–3.97), and nonpoisoning hospital admission (PR 3.34, 95% CI 2.92–3.83) and emergency department visits (PR 3.06, 95% CI 2.77–3.38).
Prevalence ratios, potential rate reductions and cases attributable to socioeconomic inequality of neonatal abstinence syndrome and opioid poisoning and nonpoisoning emergency department visits and hospital admissions in 2016, and opioid-related deaths in 2015
Rates of opioid-related harms would decrease markedly if all income groups were to experience the same rates as the highest-income neighbourhoods, ranging from a PRR of 34.8% for poisoning emergency department visits to 49.9% for neonatal abstinence syndrome. In absolute terms, this would mean a substantial annual reduction in the number of emergency department visits, hospital admissions and deaths due to neonatal abstinence syndrome, opioid poisoning and nonpoisoning opioid-related events.
Interpretation
Rates of opioid-related harms increased markedly from 2003 to 2016 in Ontario. In 2016, rates of neonatal abstinence syndrome and opioid poisoning and nonpoisoning events were all higher with lower neighbourhood income. The lowest income quintile was particularly at risk for opioid-related harms, with rates at least double those of the highest income quintile. Potential rate reduction calculations indicated that at least 30% of the cases of opioid poisoning, nonpoisoning opioid-related events and neonatal abstinence syndrome could be prevented if all income groups experienced the same rates as the highest-income group. Together, these results suggest that there may be substantial disparities in opioid-related illness and death between low- and high-income areas in Ontario. Notably, because people who use opioids may not pursue medical help at a hospital, for a variety of reasons, reported values are likely to be an underestimate of the true rates and income inequalities in opioid-related harms in the province.
Our results expand on a well-established pattern in the literature showing increases in rates of neonatal abstinence syndrome over time30–32 by demonstrating that, in Ontario, the syndrome is disproportionately experienced by infants from low-income neighbourhoods. This finding is consistent with findings from other jurisdictions outside of Canada.33,34 The observed rates of other opioid poisoning and nonpoisoning events also fit with what is known on opioid-related harms in Ontario and the United States.1,35–39 One particular trend of interest is that of the large decrease in nonpoisoning opioid-related emergency department visits around 2011, with a subsequent rise in 2014. Although it could not be causally connected, we speculate that this may be related to the introduction in February 2012 of tamper-resistant oxycodone in Ontario, as this trend maps with the decrease in oxycodone-related deaths in Ontario and the rise in deaths related to fentanyl and hydromorphone soon after.40 It may also be related to the change in opioid-prescribing guidelines in 2010 and the expansion of methadone and buprenorphine programs.41,42 The lack of a concomitant decrease in other indicators suggests that the change in oxycodone formulation did not affect opioid use in poisoning events.
Limitations
The use of administrative databases presents several limitations to our study: we captured only Ontario residents who visited an emergency department, were admitted to hospital or died in the province over our study period, and 6.6% (n = 1289) of all cases were excluded because the postal code of residence was not recorded, was invalid or was geocoded to a suppressed dissemination area. We were not able to determine whether people identified in the databases used opioids acquired by prescription, obtained them through diversion of prescription medication or used an illicit opioid. Although this limits the specificity of our analysis, it captures the overall burden in the entire population rather than only those who were prescribed opioids. Finally, the set of indicators used in this analysis does not represent a comprehensive list of all opioid-related harms; rather, the indicators are those that could be adequately captured with available data. To our knowledge, there have been no validation studies for the ICD-10-CA codes used to capture cases of the indicators; however, these codes have been consistently used in similar studies of opioid-related harms in which administrative databases were used.2,25,41
Our analysis also makes some important assumptions. We used neighbourhood income as a proxy for individual income; however, although the two often reflect similar trends, they are not always equivalent. In addition, assigning 2011 income levels to 2015 and 2016 health data may have introduced misclassification errors if neighbourhood income had changed substantially over that time. However, misclassification in neighbourhood income over time is likely to be nondifferential, which would serve only to decrease the strength of the relation between income and opioid-related harms. Maternal opioid use is not the only cause of neonatal abstinence syndrome, but it has been widely used as an indicator of opioid use in previous research.43–46 In a study of infants with neonatal abstinence syndrome born in Ontario between 2006 and 2011, 67% of mothers had received an opioid prescription within 100 days of delivery.47 We could not calculate age-standardized rates owing to methodological limitations in using tax filer data for creating income quintiles; this presents an important next step in future analyses of this topic. However, because age-specific rates of opioid-related illness and death over time have neither been constant nor held a consistent relation between age groups, the use of crude rates remains appropriate.1,48,49 Last, because this study evaluated the effect of income inequality, the relative and absolute calculations presented are notably high and are likely representative of the many risks for opioid-related harms associated with income disparities.10–14
Conclusion
We observed steady increases in rates of neonatal abstinence syndrome, emergency department visits and hospital admissions for opioid poisoning, and nonpoisoning opioid-related emergency department visits and hospital admissions from 2003 to 2016 in Ontario. Our results suggest that people living in lower-income neighbourhoods experienced higher rates of opioid-related harms in 2016 (2015 for death) than those in higher-income neighbourhoods. The results affirm a long-established pattern wherein social and structural root causes such as income inequality often go unaddressed, to the detriment of those most at risk. These findings can be used not only to inform opioid-related public health interventions as they relate to high-risk populations and neighbourhoods but also to encourage further discussion about health inequities and their underlying causes.
Footnotes
Competing interests: None declared.
This article has been peer reviewed.
Contributors: Zoe Cairncross, Jeremy Herring and Karin Hohenadel conceptualized and designed the study, acquired, analyzed and interpreted the data, and drafted the manuscript. Trevor van Ingen, Brendan Smith and Pamela Leece contributed to the conceptualization and design of the study, and the interpretation of the data. Brian Schwartz supervised the conceptualization and design of the study, and the analysis and interpretation of the data. Trevor van Ingen, Brendan Smith, Pamela Leece and Brian Schwartz critically revised the manuscript for important intellectual content. All of the authors gave final approval of the version to be published and agreed to be accountable for all aspects of the work.
Supplemental information: For reviewer comments and the original submission of this manuscript, please see www.cmajopen.ca/content/6/4/E478/suppl/DC1.
References
- Copyright 2018, Joule Inc. or its licensors
In this issue

Article tools


Related Articles
Cited By...
- No citing articles found.