


Abstract
Background: The Network of Ontario Pediatric Diabetes Programs was implemented in 2001. The objective of this study was to determine whether implementation of the network was associated with a decrease in the risk of acute diabetes-related complications and a reduction in the socioeconomic and geographic disparities in these outcomes.
Methods: We conducted a population-based time trend analysis of children (< 18 yr) with diabetes using health administrative databases in Ontario from 1996 to 2011. We determined the relation between network implementation and diabetes-related emergency department visits and hospital admissions using linear mixed-effects models with a Poisson link function.
Results: Data for 13 806 children with established diabetes were analyzed. After the network was implemented, there was a significant decrease in the rate per 100 children of emergency department visits (17.0 in 2001 v. 10.00 in 2011, p < 0.001) and hospital admissions (8.8 v. 5.0, p < 0.001). The decrease was most significant for those in the lowest socioeconomic quintile and in urban areas. After network implementation, children in the lowest socioeconomic quintile remained at higher risk than those in the highest socioeconomic quintile for emergency department visits (adjusted rate ratio [RRafter] 1.77 [95% confidence interval (CI) 1.55 to 2.03]) and hospital admissions (RRafter 2.11 [95% CI 1.77 to 2.52]). However, the yearly decrease in rates of emergency department visits and hospital admissions for the lowest compared to the highest socioeconomic quintile shifted toward a decreasing disparity after network implementation (p < 0.05). Before the network was implemented, geographic location was not associated with outcomes. After implementation, the risk of emergency department visits among patients from urban areas was significantly lower than that among patients from rural areas.
Interpretation: The establishment of a pediatric diabetes network was associated with better health outcomes, particularly for patients of lower socioeconomic status. Further work is needed to address the health care needs of those in rural areas.
The incidence of type 1 diabetes mellitus in children is increasing at a rate of 3%-5% per year, which represents a growing public health burden.1 Acute complications, such as diabetic ketoacidosis and severe hypoglycemia, remain the leading cause of avoidable hospital admissions and emergency department visits among children with type 1 diabetes.2,3 Regular access to specialized health care services is essential in preventing diabetes-related complications.4-7 Low socioeconomic status and remote geographic location may impede access to services.7-9 Various models of health care delivery, including clinical networks, have been developed to foster continuity of care and equitable access to specialized diabetes services.10 As the management of pediatric diabetes becomes more complex, access to specialized care is increasingly recognized as an important priority.11 However, except for a publicly reported audit from a pediatric diabetes network in the United Kingdom, the effect of clinical networks has been described only among adults with diabetes.12,13 Furthermore, the effect of diabetes networks on acute diabetes-related complications and on the socioeconomic and geographic disparities in these outcomes has not been evaluated.
In 2001, the Network of Ontario Pediatric Diabetes Programs was established to promote equitable distribution and timely access to quality diabetes care for all children in Ontario.14 The network, funded through the Ontario Ministry of Health and Long-Term Care, consists of 35 specialized pediatric diabetes centres. Each centre provides, at a minimum, access to a team consisting of physicians, nurses, dietitians and social workers with training in diabetes care.15 The workforce in these centres varies from generalists (family physicians, pediatricians) to pediatric endocrinologists (at academic centres), and all of the community centres are affiliated with 1 of the 5 academic pediatric centres.15 The overall goal of the network is to promote linkages among the centres, assist with the development and dissemination of resources and guidelines, and provide support and infrastructure for implementing evidence-based care and for coordinating services, while promoting consistency in standards of practice through professional development. To date, accountability measures for the network have not included patient outcomes and are not publicly reported.
The objective of our study was to determine whether implementation of a pediatric clinical diabetes network was associated with 1) a decrease in the risk of acute diabetes-related complications and 2) a reduction in the socioeconomic and geographic disparities in these outcomes.
Methods
Design
We conducted a population-based time-trend analysis of the acute complications of diabetes using multiple linked health administrative databases from Ontario available at the Institute for Clinical Evaluative Sciences.
Participants and data sources
We used the Ontario Diabetes Database, a validated population-based database, to identify all children (age < 18 yr) with a diabetes duration of at least 1 year who were living in Ontario from Apr. 1, 1996, to Mar. 31, 2011.16 The database does not distinguish between type 1 and type 2 diabetes; however, Canadian studies have shown that most people under age 20 years with diabetes have type 1 diabetes.15,17 Once cases enter the database, they remain until the patient dies or migrates out of Ontario. Using a unique encoded identifier, we linked records to the Registered Persons Database (demographic information), the Ontario Health Insurance Plan database (physicians' billing claims) and the Canadian Institute for Health Information Discharge Abstract Database (hospital admissions). Patients with invalid health insurance numbers were excluded. We linked patient records to census data by means of patients' postal codes to determine neighbourhood income quintile and rural/urban status. Patients with missing postal codes were excluded because the dissemination or enumeration areas in which they were located were "unstable" neighbourhoods with frequent migration (student housing, long-term care homes).
Outcome measures
Outcomes were diabetes-related emergency department visits and hospital admissions. We identified emergency department visits not resulting in hospital admission using Ontario Health Insurance Plan physicians' service claims bearing a diagnostic code for diabetes (International Classification of Diseases, 9th revision [ICD-9] code 250) and indicating that the encounter occurred in the emergency department. Hospital admissions were identified as those with the most responsible diagnosis code for hyperglycemia (ICD-9 250.1), including diabetic ketoacidosis (ICD-9 250.2, ICD-10 10.1-14.1) and hyperosmolar hyperglycemic coma (ICD-9 250.3, ICD-10 10.0-14.0), and for hypoglycemia (ICD-9 251, ICD-10 E10.63-E14.63). We used ICD-10 codes for hospital admissions after 2001.
Explanatory variables
Our exposure was implementation of the pediatric diabetes network, in 2001. We measured the effect of the network from 2001 to 2011. The following covariates were determined a priori: age, sex, socioeconomic status and urban/rural status. We grouped age into the categories preschool (1-4 yr), school age (5-9 yr), early adolescent (10-14 yr) and late adolescent (15-18 yr). We measured socioeconomic status using neighbourhood income quintiles derived from census-based median household income level of the patient's neighbourhood of residence enumeration area (1996 census) or dissemination area (population 400-700) (2001 census). Geographic location of residence was categorized as urban (population ≥ 10 000) or rural (population < 10 000). Age, socioeconomic status and urban/rural status were assigned at the start of each fiscal year.
Statistical analysis
We examined whether rates of diabetes-related emergency department visits and hospital admissions changed significantly after the diabetes network was implemented. The numerator was the total number of episodes in each year, and the denominator was the total number of eligible people in the Ontario Diabetes Database in that year.
We estimated the effect of network implementation on emergency department visits and hospital admissions using the segmented regression analysis approach.18 We used generalized linear mixed-effects models to assess the relation between network implementation and annual rates of diabetes-related emergency department visits and hospital admissions. We used aggregate data of annual crude rates for each level of socioeconomic status, urban/rural status, sex and age. For each model, we used a Poisson link function and accounted for correlation (compound symmetry structure) within groups over the follow-up period. We determined population average adjusted rate ratios (RRs) by accounting for the number of patients in each aggregate. For the base model, we created 3 variables: a continuous variable representing fiscal year (preimplementation trend estimate), a dummy variable representing network implementation (immediate network effect) and an interaction term between network implementation and fiscal year (difference between pre- and postimplementation trend estimate). We included all the covariates selected a priori and interaction terms between network implementation and socioeconomic status as well as network implementation and geographic location to determine whether socioeconomic status and geographic location modified the effect of the diabetes network.
To determine whether there was a change in the trend of annual rates of emergency department visits or hospital admissions following network implementation, and by socioeconomic status and geographic location, we repeated the multivariate analysis with the addition to the model of interaction terms between 1) year, network implementation and socioeconomic status and between 2) year, network implementation and geographic location. From these models, we calculated yearly predicted adjusted rates (modelled rates postimplementation) and the projected adjusted rates (rates had the network not been implemented) using the means method, which involved setting each confounder to its mean value. We calculated the difference in the predicted adjusted rates between network implementation (2001) and 2011 using the marginal standardization method, with confidence intervals (CIs) determined by means of the δ method.19 Statistical tests were two-sided, with significance assigned at p < 0.05.
We performed statistical analyses using SAS 9.4 (SAS Institute).
Ethics approval
This study was approved by the research ethics boards of the Sunnybrook Health Sciences Centre and McGill University Health Centre.
Results
A total of 14 425 children with established diabetes were identified in the Ontario Diabetes Database, of whom 13 806 had valid postal codes and were included in the final analysis.
Emergency department visits
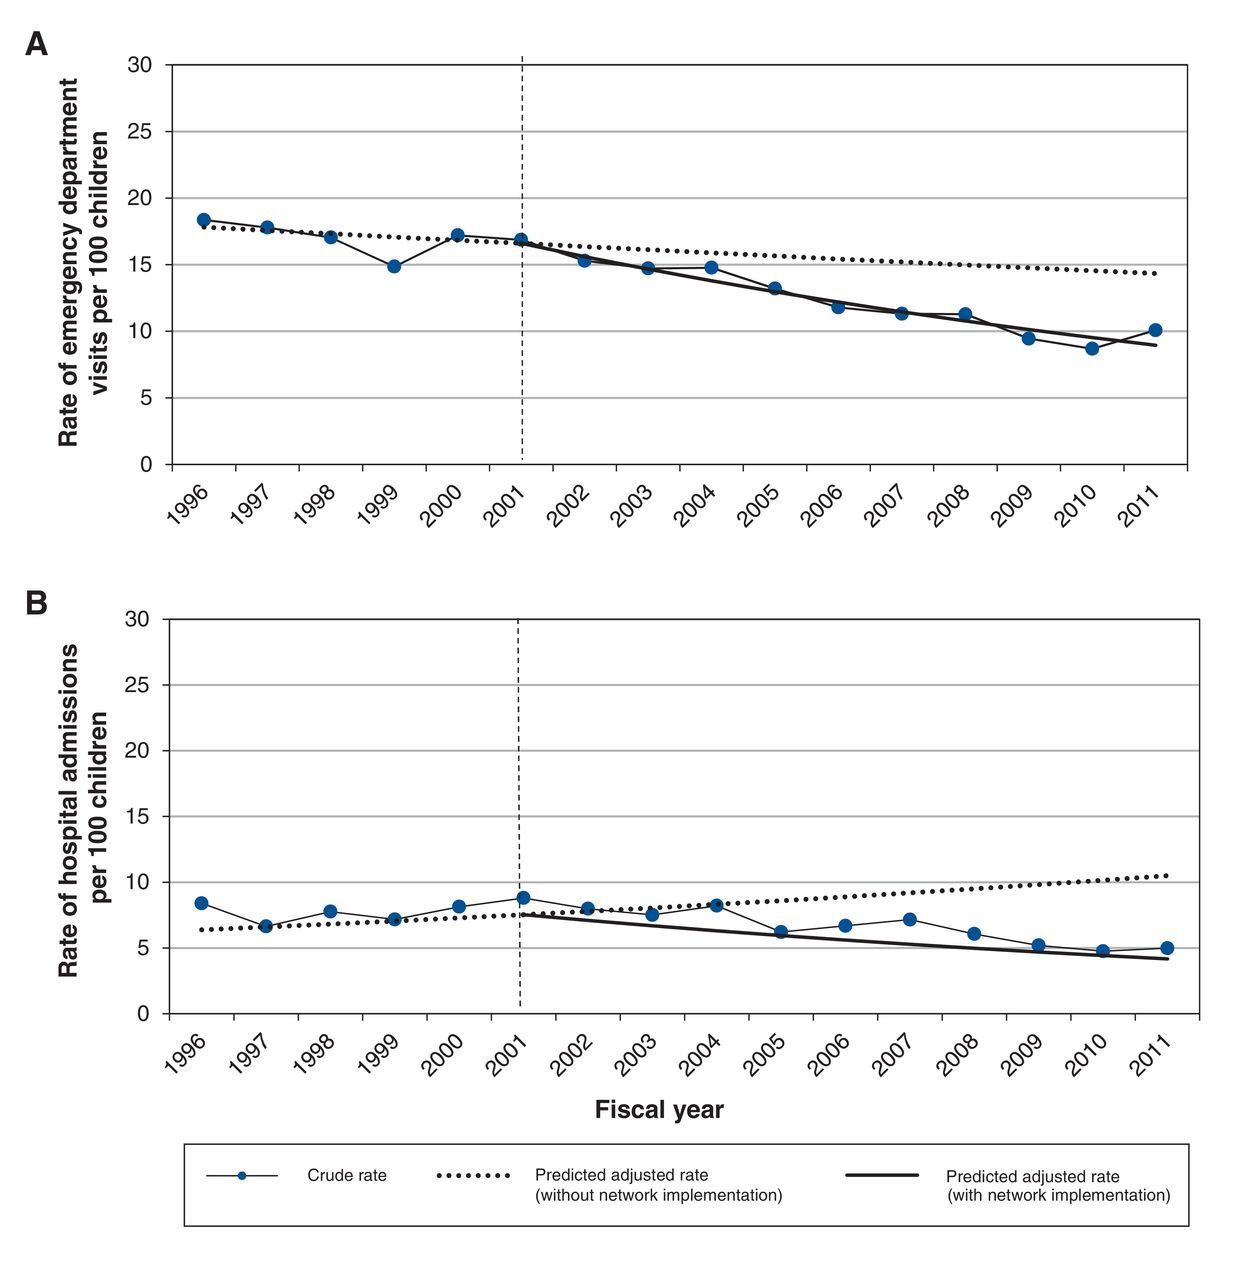
Figure 1A presents the observed crude rates of emergency department visits as well as the trends in rates with (predicted rates) and without (projected rates) network implementation. Before implementation, the rate of emergency department visits remained unchanged (18/100 in 1996 v. 17/100 in 2001, p = 0.2 for trend). After implementation, the rate decreased to 10/100 in 2011 (p < 0.001 for trend). The decreasing trend in emergency department visits after the network was implemented was seen across socioeconomic quintiles and geographic locations (Figure 2A and Figure 3A).

Observed crude rates of (A) emergency department visits and (B) hospital admissions among Ontario children with type 1 diabetes mellitus, and trends in rates with (predicted rates) and without (projected rates) implementation of the Network of Ontario Pediatric Diabetes Programs. Dotted vertical line = implementation of the program.

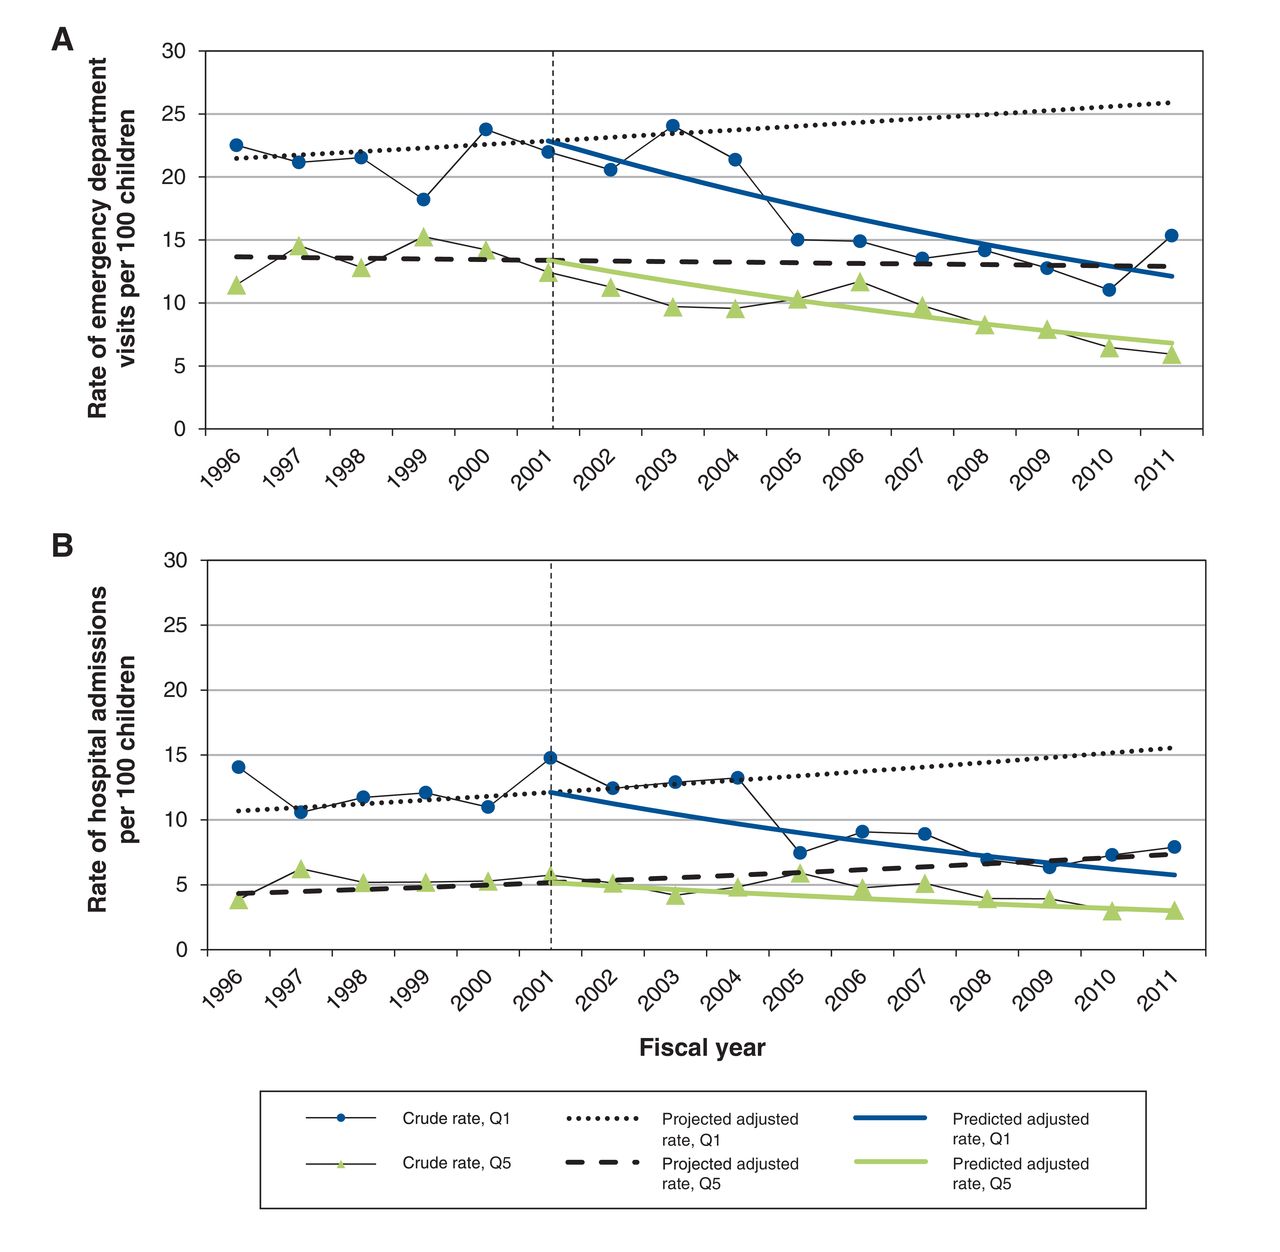
Observed crude rates of (A) emergency department visits and (B) hospital admissions for the lowest (Q1) and highest (Q5) socioeconomic quintiles, and trends in rates with (predicted rates) and without (projected rates) implementation of the Network of Ontario Pediatric Diabetes Programs. Dotted vertical line = implementation of the program.

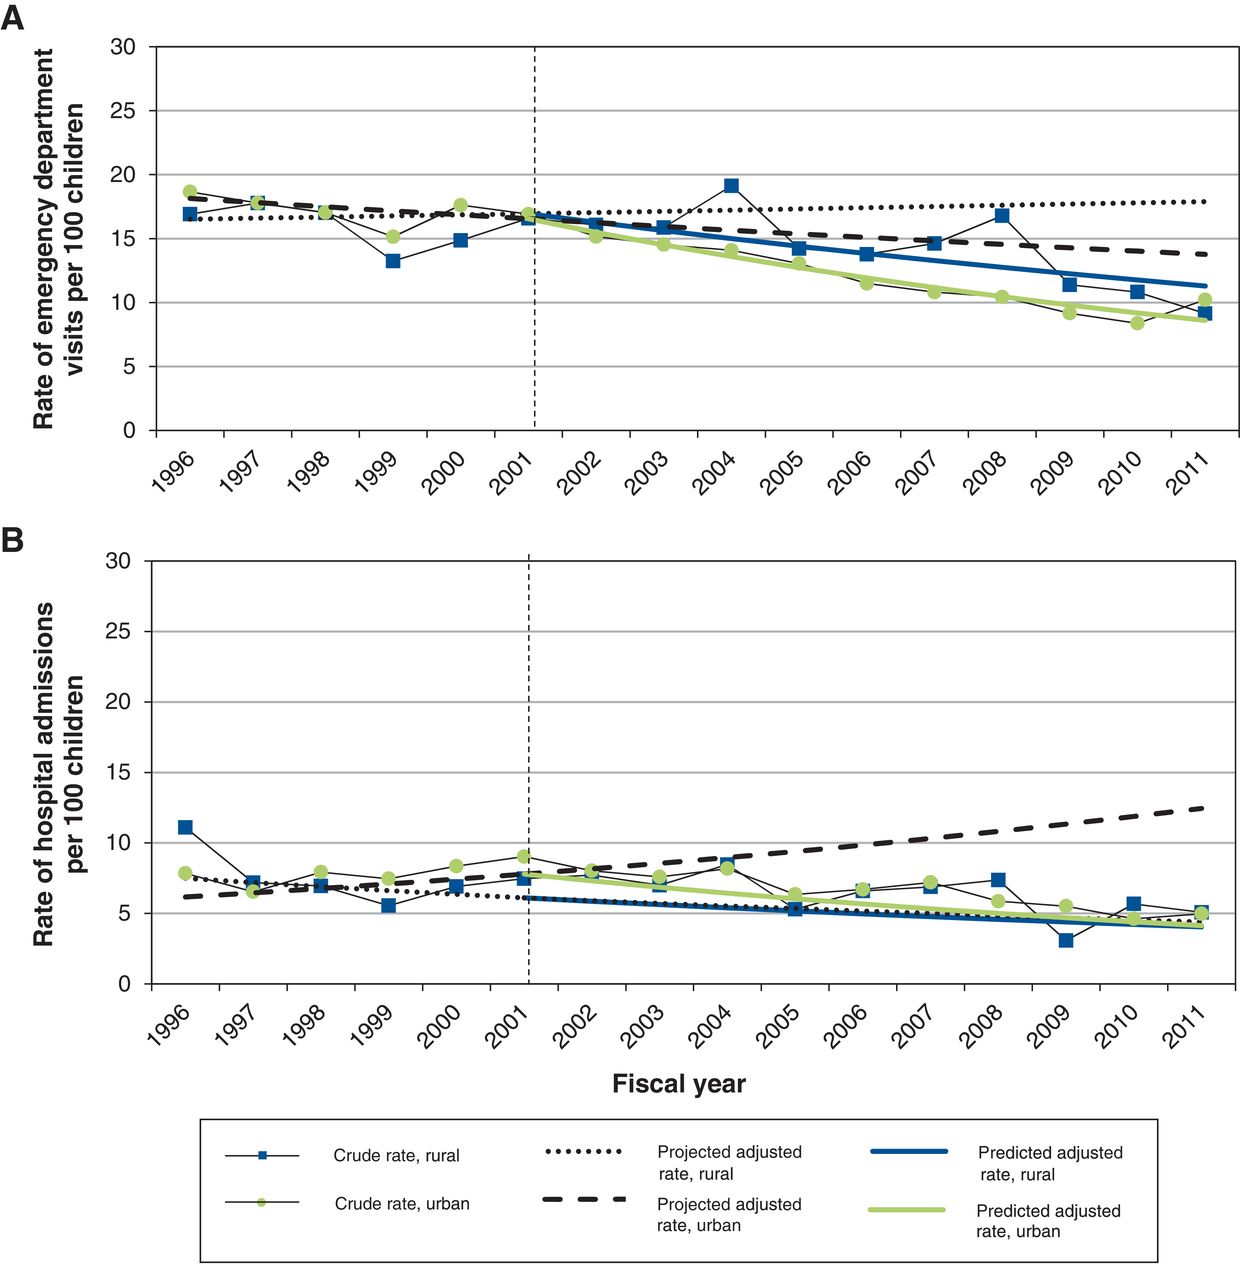
Observed crude rates of (A) emergency department visits and (B) hospital admissions by geographic location, and trends in rates with (predicted rates) and without (projected rates) implementation of the Network of Ontario Pediatric Diabetes Programs. Dotted vertical line = implementation of the program.
In multivariate analysis, lower socioeconomic status was associated with an increased risk of emergency department visits that persisted after network implementation (Table 1). After implementation, patients living in rural regions had a 20% (adjusted RR 1.20, 95% CI 1.06 to 1.34) increased risk of emergency department visits compared with those living in urban areas. Male sex was also associated with a decreased risk in multivariate analysis (adjusted RR 0.78 [95% CI 0.72 to 0.84]) (data not shown).
In multivariate analysis, we found a significant difference in the overall pre- and postimplementation trend estimates, with a significant decrease in the long-term trend in annual rates after implementation compared with trends before implementation (Table 2). This decrease was statistically significant for patients in the highest socioeconomic quintile (Q5), in the lowest socioeconomic quintile (Q1) and from urban areas. Although socioeconomic disparities persisted after the network was implemented, the relative yearly decrease in emergency department visits among patients in Q1 compared to those in Q5 shifted toward a decreasing disparity (Figure 2A). Furthermore, the absolute difference in the predicted adjusted rates between Q1 and Q5 in 2011 (5.2% [95% CI 3.29% to 7.14%]) was significantly less than in 2001 (9.3% [95% CI 6.12% to 12.50%]) (difference -4.0% [95% CI -0.2% to -8.0%]).
Hospital admissions
Before implementation of the network, the rate of hospital admissions remained unchanged (8.4/100 in 1996 v. 8.8/100 in 2001, p = 0.18 for trend) (Figure 1B). After implementation, the rates decreased to 5.0/100 in 2011 (p < 0.001 for trend). Had the network not been implemented, hospital admission rates would have increased over time (Figure 1B). This decreasing trend in hospital admissions after implementation was seen across socioeconomic quintiles and urban areas (Figure 2B and Figure 3B).
In multivariate analysis, hospital admission rates increased with decreasing socioeconomic quintile, before and after network implementation (Table 1). There were no geographic disparities. Other associations included male sex (adjusted RRmale 0.71 [95% CI 0.64 to 0.78]) and older age (adjusted rate ratio 1.67 [95% CI 1.23 to 2.27] for 10-14 yr and 1.91 [95% CI 1.41 to 2.59] for 15-18 yr compared to 1-4 yr) (data not shown).
Implementation of the network was associated with a 6% (adjusted RR 0.94, 95% CI 0.93 to 0.95) decrease per year in the long-term trend in hospital admission rates compared with a 3% (adjusted RR 1.03, 95% CI 1.01-1.06) increase per year before implementation (Table 2). This decrease was significant for patients in the middle and lowest socioeconomic quintiles as well as for those from urban areas.
The relative yearly decrease in the rate of hospital admissions in Q1 compared to Q5 shifted toward a decreasing disparity (Figure 2B). The absolute difference in the predicted adjusted rates between Q1 and Q5 decreased from 7.8% (95% CI 5.4% to 10.1%) in 2001 to 3.1% (95% CI 1.7% to 4.5%) in 2011 (difference -4.7% [95% CI -1.8% to -7.6%]).
Interpretation
In this population-based study, efforts of a diabetes network to standardize and improve access to specialized pediatric diabetes care were associated with better health outcomes, particularly for those of lower socioeconomic status. Our work extends previous findings that have highlighted the importance of comprehensive ambulatory care in preventing acute diabetes-related complications.7,20 Furthermore, our findings are consistent with those of another pediatric diabetes network in the UK, which has shown improvements in care delivery with implementation of a network model.21 In a recent audit report, the network reported an increase in the proportion of children who received all recommended care processes, from 4.1% in 2009/10 to 16% in 2013/14.21
Research in other pediatric chronic diseases has also shown the positive effect clinical networks can have on care delivery and outcomes.22 For example, improvements in care processes as well as an increase in the proportion of patients whose disease was in remission at follow-up were reported with a pediatric inflammatory bowel disease network.23,24 Although clinical networks may differ with respect to structure, governance and accountability mechanisms, our findings are in agreement with reports showing that such networks are associated with improved care delivery and outcomes.
Our finding that patients of low socioeconomic status are most at risk for diabetes-related emergency department visits and hospital admissions within a universal-access health care system supports previous Ontario research.25,26 Lower-income families may be limited in purchasing glucometer strips, which may lead to reduced frequency of glucose monitoring and an increased risk of poor outcomes.27 Transportation costs or restrictions in taking time off work may limit lower-income families' abilities to attend diabetes care visits, which may result in missed opportunities for education and guidance.4,7
We found a significant trend toward decreasing socioeconomic disparities after the diabetes network was implemented. Children of lower socioeconomic status had the greatest improvement in outcomes, which suggests that the network was most successful in possibly increasing access to effective care for these patients. A 1997 Canadian study showed that visit rates for primary care were 15% higher in populations of low versus high socioeconomic status, but an inverse gradient was seen for specialist visits.28 Arguably, primary care delivery is more accessible in terms of distance and scheduling than specialized care.28 Thus, by providing more accessible diabetes care, the pediatric network may have reduced some barriers. In addition, the network promoted more equitable availability of other diabetes professionals such as dietitians and nurses, which may have had additional benefits for those of lower socioeconomic status.
Before the pediatric diabetes network was implemented, there were no geographic disparities in outcomes, which contrasts with previous findings among adults.8,9 This suggests that gaps in service delivery in rural areas existed but other factors such as socioeconomic status may have been a stronger driver of complication risk, or, alternatively, access to specialized diabetes care may not have been an important gap in rural areas, as patients travelled to urban centres to receive care. After the network was implemented, there was increasing geographic disparity in rates of emergency department visits and a significant decrease in emergency department visits and hospital admissions in urban areas but not in rural areas, which suggests that the network may have improved care more in urban areas than in rural areas. The reason for these findings is unclear but may be related to differential implementation of diabetes care between rural and urban centres; future research should more closely examine this disparity.
Limitations
Administrative data did not allow us to control for factors such as hemoglobin A1c29 and education levels,30 which are known to contribute to complication risk. Furthermore, we could not measure the effect of the network on hemoglobin A1c levels. We did not assess ambulatory care use because some pediatric subspecialists are salaried and, hence, their "shadow" billings data may not be complete. Availability of additional resources, including 24-hour support, physician type (endocrinologist, pediatrician) or access to mental health services, may vary between centres, which may result in differing outcomes within the network. Also, it is possible that improvements in outcomes over time took place independent of the network, owing to an increase in the supply of pediatric endocrinologists or advancements in diabetes management, including insulin pump therapy. However, a recent study of Ontario children using insulin pumps suggested no significant association on selected outcomes with diabetes centre resources, including physician type.31 Furthermore, several population-based studies have shown that, despite improvements in hemoglobin A1c levels, trends for diabetes-related hospital admissions among children with diabetes remained stable over a similar period (1995-2009,32 1993-200433 and 2005-201034). Although we could not capture treatment modalities using administrative data, it is unlikely that advancements in care, much of which rely on more intensive management, would have had a greater impact on outcomes among children of lower socioeconomic status than among those of higher socioeconomic status.31,35 Previous Ontario studies have shown that children of low socioeconomic status were less likely to be using pumps and that those who were using pumps had an increased risk of diabetic ketoacidosis compared to children of higher socioeconomic status.31,35
Conclusion
Within a universal-access health care system, the establishment of a pediatric clinical diabetes network was associated with reductions in diabetes-related emergency department visits and hospital admission rates as well as with decreasing socioeconomic disparities in these outcomes. This has implications for health policy efforts in other jurisdictions that are aimed at improving the quality of care for children with diabetes. Future work should include comparative effectiveness studies, including cost-effectiveness analyses, of the differing models of care within the network.
Supplemental information
For reviewer comments and the original submission of this manuscript, please see www.cmajopen.ca/content/5/3/E586/suppl/DC1.
Footnotes
Competing interests: See the end of the article.
Contributors: Meranda Nakhla, Elham Rahme and Astrid Guttmann conceptualized and designed the study, oversaw the analysis and interpreted the data. Marc Simard contributed to the study conception and design, carried out the analysis and contributed to data interpretation. Meranda Nakhla drafted the initial manuscript, and Elham Rahme, Astrid Guttmann and Marc Simard critically revised the manuscript for important intellectual content. All of the authors approved the final version to be published and agreed to act and guarantors of the work.
Funding: Meranda Nakhla holds a Fonds de recherche du Québec - Santé Junior Clinician-Scientist Award. Astrid Guttmann receives salary support from a Canadian Institutes of Health Research Applied Chair in Reproductive and Child Health Services and Policy Research. This research was supported by Meranda Nakhla's grants from the Research Institute of the McGill University Health Centre and the Fonds de recherche du Québec. The funders played no role in the conduct or management of the study, data collection, analysis or interpretation, or preparation of the manuscript.
Disclaimer: This study was supported by the Institute for Clinical Evaluative Sciences (ICES), which is funded by an annual grant from the Ontario Ministry of Health and Long-Term Care (MOHLTC). No endorsement by the ICES or the Ontario MOHLTC is intended or should be inferred. Parts of this material are based on data and information compiled and provided by the Canadian Institute for Health Information (CIHI). However, the analyses, conclusions, opinions and statements expressed herein are those of the authors and not necessarily those of the CIHI.
References
- Copyright 2017, Joule Inc. or its licensors
In this issue

Article tools


