


Abstract
Background: We aimed to define rates and causes of death in custody and after release in people admitted to provincial custody in Ontario, and to compare these data with data for the general population.
Methods: We linked data on adults admitted to provincial custody in Ontario in 2000 with data on deaths between 2000 and 2012. We examined rates and causes of death by age, sex, custodial status and period after release, and compared them with data for the general population, using indirect adjustment for age.
Results: Between 2000 and 2012, 8.6% (95% confidence interval [CI] 8.3%-8.8%) of those incarcerated died in provincial custody or after release. The crude death rate was 7.1 (95% CI 6.9-7.3) per 1000 person-years. The standardized mortality ratio for those incarcerated in 2000 was 4.0 (95% CI 3.9-4.1) overall and 1.9 (95% CI 1.5-2.4) while in provincial custody. The most common causes of death were injury and poisoning (38.2% of all deaths), including overdose (13.6%) and suicide (8.2%), diseases of the circulatory system (15.8%) and neoplasms (14.5%). In the 2 weeks after release, the standardized mortality ratio was 5.7 overall and 56.0 for overdose. Life expectancy was 72.3 years for women and 73.4 for men who experienced incarceration in 2000.
Interpretation: Mortality was high for people who experienced incarceration, and life expectancy was 4.2 years less for men and 10.6 years less for women compared with the general population. Efforts should be made to reduce the gap in mortality between people who experience incarceration and those who do not. Time in custody could serve as an opportunity to intervene to decrease risk.
Worldwide, more than 11 million people are incarcerated at any given time,1 and an estimated 30 million people move through the prison system annually.2 In Canada, there are more than 250 000 admissions to correctional facilities each year3 and about 40 000 people in correctional facilities on any given day.1 This translates into an estimated 1 in 250 people who experience incarceration in Canada each year.4
International research reveals that people who experience incarceration have poor health compared with the general population, including higher rates of mental illness, substance use disorders, infectious diseases and injury.5-7 An emerging body of literature identifies ways to improve health in this population, both in custody and after release,8 and empirical and theoretical evidence suggests that such interventions could benefit all of society by decreasing health care costs,9 improving health in the general population,9-14 improving public safety9 and decreasing reincarceration.9,15,16
In Canada, there is a lack of data on many indicators of health for people who experience incarceration.7,17 Regarding mortality in particular, several reports have examined deaths in custody18-23 and have noted high rates of death and a large proportion of deaths from preventable causes, such as homicide, suicide and overdose. The postrelease period has been identified across international studies as very risky for death.24-39
We aimed to define rates and causes of death in custody and after release in people who were admitted to provincial custody in Ontario in 2000, and to compare these data with data for the general population.
Methods
Setting and design
We defined exposure as having been admitted to a provincial correctional facility for adults in Ontario in 2000. This includes people who were remanded (i.e., detained and not yet sentenced) or incarcerated (i.e., sentenced); in this article we use the term incarcerated to represent both of these groups.
Sources of data
We obtained demographic data, health card numbers and information on death while under supervision from the Ontario Ministry of Community Safety and Correctional Services. These data are collected by correctional facilities for administrative purposes. Race is a categorical variable that is self-reported on admission to custody. On each admission, correctional staff verify or request the health card number for eligible people from the Ministry of Health and Long-Term Care, for the purposes of physician billings and other health care use. Eligible people who do not have a valid health card number are provided with a temporary number while in custody.
Data linkage
These data were transferred to the Institute for Clinical Evaluative Sciences, an independent, nonprofit organization funded by the Ontario Ministry of Health and Long-Term Care. We linked eligible people in the Ministry of Community Safety and Correctional Services data set to people in the Registered Persons Database, which is a roster of all people eligible for the Ontario Health Insurance Plan (OHIP). Through the Registered Persons Database, we accessed a unique encrypted health card number (IKN), which is used to identify individuals across health care databases. We used deterministic linkage for people with a health card number provided by the Ontario Ministry of Community Safety and Correctional Services, and probabilistic linkage using name and date of birth for people with no health card number provided by the Ontario Ministry of Community Safety and Correctional Services.40
Data on mortality are from the Ontario Registrar General Death database. Cause of death was classified at the Institute for Clinical Evaluative Sciences during the period of follow-up using the International Classification of Diseases, 9th revision (ICD-9).
Outcome
We accessed data on deaths from the time of first admission to provincial custody in 2000 until the end of 2012. We classified a person as having died in provincial custody if the reason for release from custody was death, or if the date of death provided by the Ontario Ministry of Community Safety and Correctional Services and in the Registered Persons Database was during the period in custody. We defined death while not in provincial custody as a death in the Registered Persons Database while the person was not in provincial custody or death in the Ontario Ministry of Community Safety and Correctional Services data set while the person was under community supervision, as long as the person had no admissions to custody after that date. No death was defined as no death recorded in either the Ontario Ministry of Community Safety and Correctional Services data set or the Registered Persons Database, or no death in the Ontario Ministry of Community Safety and Correctional Services data set and death in the Registered Persons Database but in custody subsequent to date of death listed in the Registered Persons Database.
We categorized cause of death into broad categories using ICD-9 chapters, deaths due to specific preventable diseases of interest, and certain risk factors,41 with specific ICD-9 and International Statistical Classification of Diseases and Related Health Problems, 10th revision (ICD-10) codes provided in Appendix 1, available at www.cmajopen.ca/content/4/2/E153/suppl/DC1.
For data on mortality in the general population, we used publicly available data from Statistics Canada. We used Ontario data for overall and sex-specific mortality,42 and data for the Canadian population for cause-specific mortality43 and life expectancy,44 because these data were not available for Ontario. We used mortality data from 2006 as the midpoint of the period of follow-up, and life expectancy data for the period of 1991 to 2006.44
Statistical analysis
We calculated person-years of observation as the total years from the date of first admission to custody in 2000 to the end of 2012, or to the date of death in those who died during this period. We calculated crude mortality for demographic characteristics while in custody and for specific periods after release. We used indirect standardization to adjust for age distribution in comparing mortality in those incarcerated in 2000 with mortality for the general population, including by sex, cause, period after release and custodial status. Specifically, we applied the mortality for the general population to the person-years of observations for those incarcerated in 2000 to generate the expected number of deaths, and we then took the ratio of observed to expected deaths as the standardized mortality ratio.45 We used life tables to calculate life expectancy, with Monte Carlo simulations to estimate the confidence limits.46 Analyses were conducted in SAS, Stata and Excel.
Sample size
We decided a priori to obtain data on the about 50 000 people admitted to provincial custody in Ontario in 2000 as the exposed population. We expected this number of people would be adequate for our planned analyses based on other studies of mortality in marginalized populations in Canada and in incarcerated people in the United States.33,47,48 Also, we wanted to include all people admitted over a full year to prevent bias due to seasonal variation in admissions that could affect patterns of mortality.
Study approval
We obtained approval for the study from the Ontario Ministry for Community Safety and Correctional Services and the St. Michael's Hospital Research Ethics Board.
Results
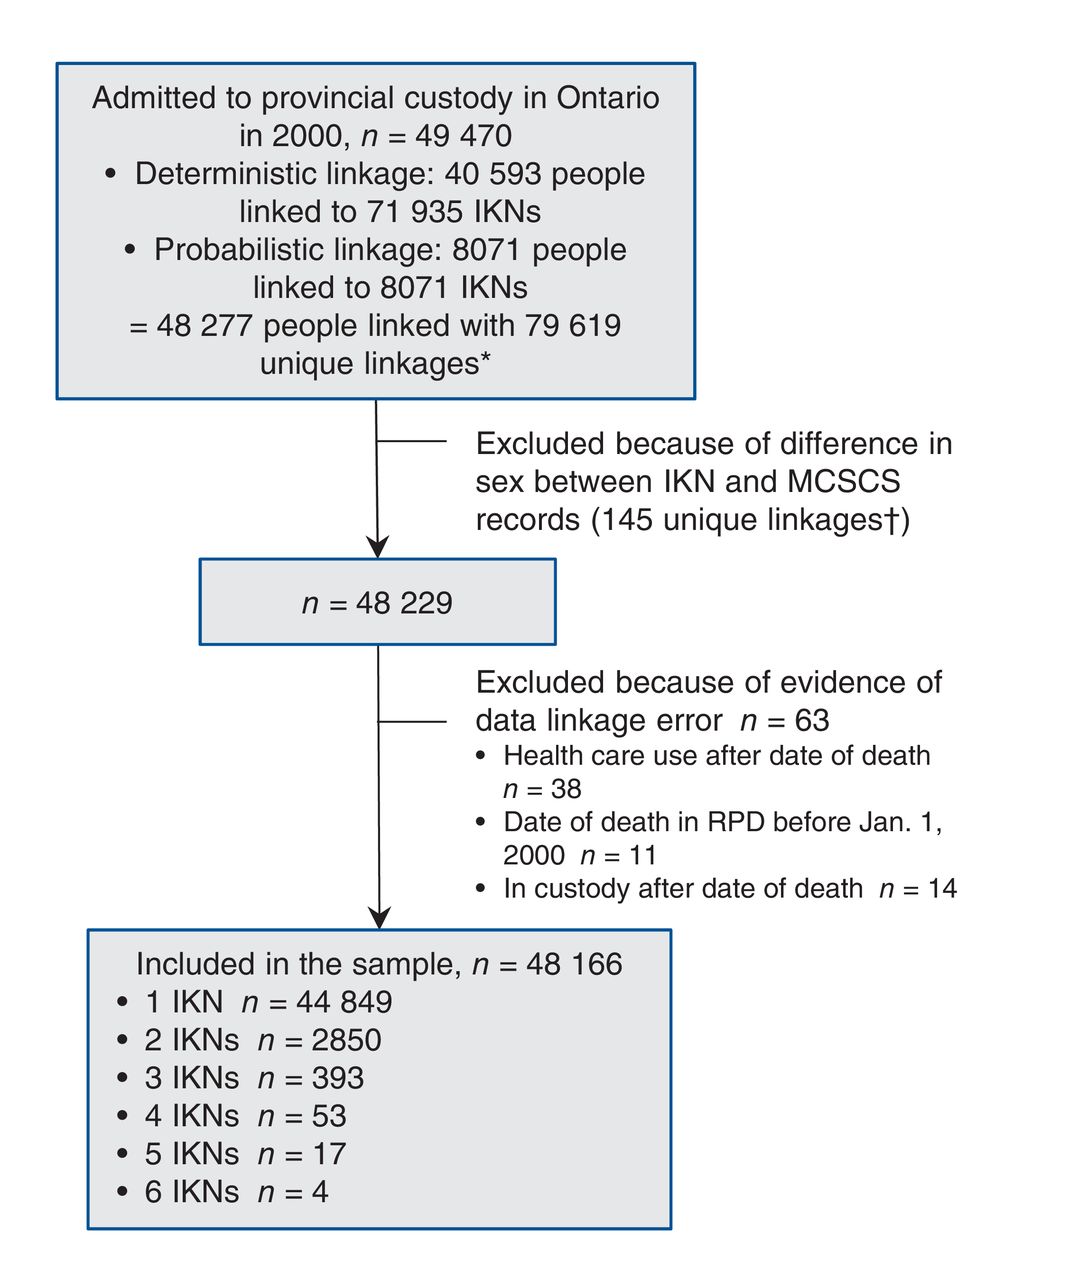
There were 49 470 people admitted to provincial custody in Ontario in 2000. Of those, 40 593 were linked deterministically to 71 935 valid IKNs, and 8071 were linked probabilistically to an IKN. There was overlap in people and IKNs identified in the probabilistic and deterministic linkage, such that the total number of people matched was 48 277 and there were 79 619 unique combinations of people and IKNs. For 145 combinations of people and IKNs, the sex in the IKN differed from the sex specified by the Ontario Ministry of Community Safety and Correctional Services, and these records were removed from the data set, leaving 48 229 people. We excluded people for whom the data suggested a linkage error, that is, those with OHIP billings after the date of death (n = 38), people for whom the date of death in the Registered Persons Database was before Jan. 1, 2000 (n = 11) and those who were in custody after the date of death in the Registered Persons Database (n = 14). This left 48 166 people in the sample, which is 97.4% of the initial sample. Of these, 44 849 had 1 IKN, 2850 had 2 IKNs, 393 had 3 IKNs, 53 had 4 IKNs, 17 had 5 IKNs and 4 had 6 IKNs. A flow diagram of inclusion in the final sample is shown in Figure 1.

Flow diagram of inclusion in final sample of people admitted to provincial custody in Ontario in 2000. Note: IKN = a unique encrypted health card number, MCSCS = Ontario Ministry of Community Safety and Correctional Services, RPD = Registered Persons Database. *Numbers of people and of IKNs do not sum because of overlap in people and IKNs from deterministic and probabilistic linkage. †This number represents the number of combinations of people and IKNs.
Characteristics of the final sample of people incarcerated in 2000 are shown in Table 1. Of those included in the final sample, 90.1% were men. The median age was 32 years for men and 33 years for women. Regarding race, 69.0% self-identified as white, 12.4% as black and 7.2% as Aboriginal. A total of31.2% were in the lowest neighbourhood income quintile. Overall, 33.5% had only 1 admission to provincial custody during the follow-up period, 33.4% had between 2 and 4 admissions, and 33.2% had 5 or more admissions. A total of10.9% of men and 5.6% of women were transferred to a federal facility at some point during the follow-up period. Overall, 19.4% spent less than 1 week in provincial custody over the follow-up period, 29.7% spent between 1 week and 3 months, and 51.0% spent more than 3 months in provincial custody.
A total of 4126 people (8.6%, 95% CI 8.3%-8.8%) died during the follow-up period from 2000 to 2012: 418 women (8.8%, 95% CI 8.0%-9.0%) and 3708 men (8.5%, 95% CI 8.3%-8.8%). The crude death rate was 7.1 (95% CI 6.9-7.3) per 1000 person-years: 7.1 (95% CI 6.9-7.3) for men and 7.3 (95% CI 6.6-8.0) for women. The mean age at death was 47.5 years. A total of 74 people (0.2%, 95% CI 0.1%-0.2%) died in custody, for a crude death rate of 2.0 (95% CI 1.6-2.5) per 1000 person-years.
The risk of death was significantly higher for those incarcerated in 2000 than for the general population in Ontario for men from age groups 15-19 to 75-79 and for women from age groups 20-24 to 65-69, as shown in Figure 2.
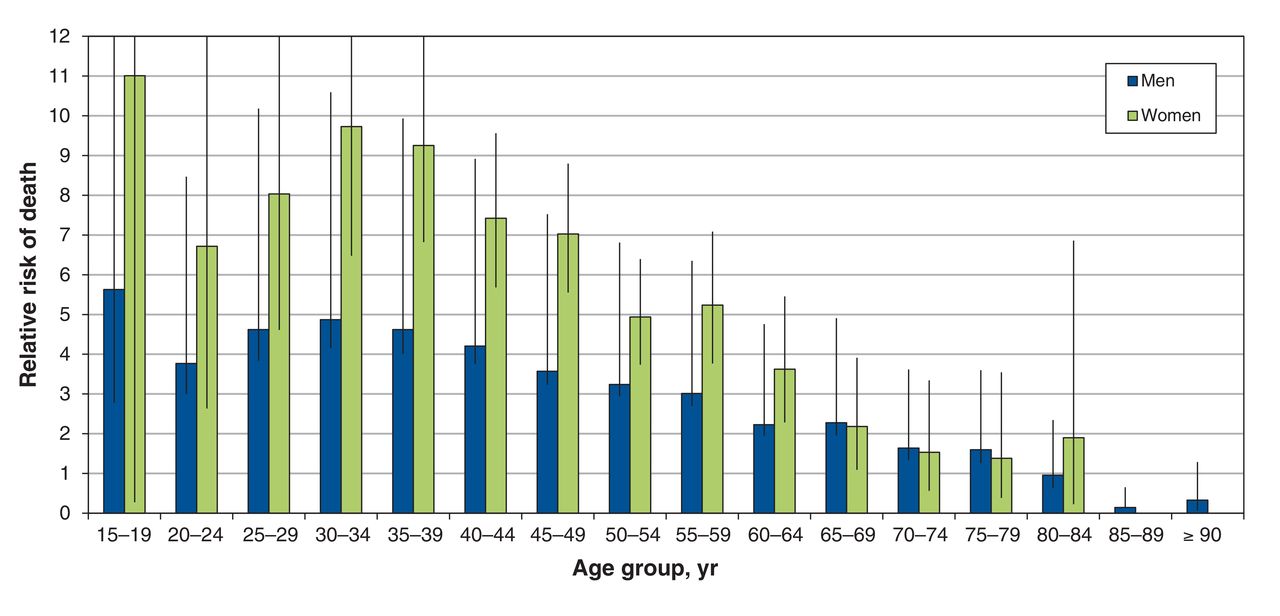
Relative risk of death in people admitted to provincial custody in 2000 compared with the general population,* by age group and sex. 95% confidence intervals shown with vertical lines. *Death rates between 2000 and 2012 for those incarcerated in 2000 and for the Ontario population aged 15 and older in 2006.
Standardized to the Ontario age distribution, the mortality ratio for those incarcerated in 2000 was 4.0 (95% CI 3.9-4.1) overall (Table 2): 1.9 (95% CI 1.5-2.4) while in provincial custody and 4.1 (95% CI 3.9-4.2) while not in provincial custody (data not shown). The standardized mortality ratio was 3.2 (95% CI 3.1-3.3) for men and 5.6 (95% CI 5.1-6.2) for women (data not shown).
A qualitative examination of causes of deaths revealed a similar distribution of deaths by cause for men and women. In total, 38.2% (n = 1575) of deaths were due to injury and poisoning, including 13.6% due to overdose (n = 563) and 8.2% due to suicide and self-inflicted injury (n = 340) (Table 2). Of the deaths, 14.5%were caused by neoplasms (n = 600) and 10.1% by ischemic heart disease (n = 416). In total, 2.1% of deaths were from viral hepatitis (n = 87) and 2.3% were fromHIV (n = 96). In provincial custody, 18.9% of 74 deaths (n = 14) were due to overdose, 24.3% (n = 18) to suicide and self-inflicted injury, 13.5% (n = 10) to cardiovascular disease, 6.8% (n = 5) had no known cause of death, and 8.1% (n = 6) were attributed to symptoms, signs and ill-defined conditions.
Compared with the population of Canada, the standardized mortality ratio was significantly elevated across almost all categories of disease (i.e., by ICD-9 chapter) (Table 2). Regarding specific preventable causes of death, the standardized mortality ratio was greater than 8 for both HIV and viral hepatitis. The standardized mortality ratio was not significantly increased for colorectal, breast or cervical cancer; however, the standardized mortality ratio was greater than 2 for all other chronic diseases that we examined (i.e., diabetes, epilepsy, cerebrovascular disease, hypertensive disease and ischemic heart disease). Regarding types of injury, the standardized mortality ratio was 4.3 for suicide and self-inflicted injury, and very high for homicide (14.8), legal intervention (37.0), overdose (20.3) and events of undetermined intent (i.e., events for which it is unclear whether they were accidentally or purposefully inflicted) (8.7).
Considering certain behavioural risk factors in people aged 25 years and older, the standardized mortality ratio was 40.0 for alcohol-related diseases, 14.5 for drug-related diseases, and 6.4 for deaths due to smoking-related diseases (Table 2).
Looking at deaths by period subsequent to the first release from provincial custody, the crude mortality rate from all causes did not differ significantly over time. In contrast, for overdose and suicide, the rate was higher in the weeks after release than later in the postrelease period, at 2.3 (95% CI 0.6-6.0) deaths due to overdose per 1000 person-years in the first 2 weeks after release compared with 0.4 (95% CI 0.3-0.5) per 1000 person-years after 26 weeks postrelease, and 2.3 (95% CI 1.0-4.6) deaths per 1000 person-years due to suicide in the first 4 weeks postrelease compared with 0.4 (95% CI 0.3-0.5) per 1000 person-years after 52 weeks postrelease. As shown in Figure 3, the standardized mortality ratio decreased from the immediate postrelease period to later periods postrelease for deaths due to all causes, overdose and suicide, respectively. The standardized mortality ratio for deaths in the first month postrelease was 5.8, a large proportion of which is due to deaths from overdose, with standardized mortality ratios for overdose of 56.0 (95% CI 15.3-143.4) in the first 2 weeks and 29.0 (95% CI 3.5-104.8) between weeks 2 and 4 postrelease, and deaths from suicide, with standardized mortality ratios for suicide of 14.0 (95% CI 2.9-40.9) in the first 2 weeks and 24.2 (95% CI 7.9-56.5) in weeks 2 to 4 postrelease.

Standardized mortality ratio for all causes, overdose and suicide, by period postrelease from first admission to provincial custody in 2000, n = 46 442.* Standardized to the Canadian population in 2000. 95% confidence intervals shown with vertical lines. *Excludes 960 people who were transferred to federal custody.
Life expectancy contingent on survival to age 25 was 72.3 (95% CI 70.6-74.0) years for women and 73.4 (95% CI 72.6-74.1) years for men who were incarcerated in 2000.
Interpretation
In this Canadian study examining long-term mortality in people who have experienced incarceration, we found a high death rate in people who experienced incarceration. Over the 12-year follow-up period, 8.6% of people died, with a crude rate of 7.1 deaths per 1000 person-years and a mean age at death of 47.5 years. Controlling for age, people in the incarcerated sample were 4 times more likely to die than the general population, and almost twice as likely to die while in custody. Many of the deaths were due to preventable and treatable causes, including 13.6% of deaths due to overdose, 10.1% to ischemic heart disease, and 8.2% to suicide and self-inflicted injury. The life expectancy of people incarcerated in 2000 was 73.4 years for men and 72.3 for women, which is 4.2 years less for men and 10.6 years less for women compared with the general population.44
The high mortality in this cohort is consistent with the findings of recent studies from other countries.2,32,33 Also consistent with other studies,2 we found that standardized mortality rates were particularly high for women, and we also noted that mortality seemed lower in people with longer periods of incarceration and higher in people who self-identified as white or Aboriginal, which deserves further attention in future research. Other studies have identified that people who experience incarceration are at greater risk of overdose, especially in the weeks after release,2,32,49 suggesting a role for interventions including diversion programs for people with addictions, training in overdose prevention and distribution of naloxone before release or after release including through probation and parole programs, access to opioid substitution therapies and drug treatment programs, and appropriate use of prescribed opioids.32,50 Other studies have also noted high rates of death due to HIV and hepatitis C,32,33 each of which caused 2% of deaths in this cohort. That notwithstanding, the increased risk of death due to almost all causes and behavioural risk factors (Table 2) compared with the general population indicates that upstream and broad interventions are also needed for this population,8 for example, programs focused on behavioural factors such as smoking and alcohol use,51 release planning and the provision of case management at the time of release,52 and improving linkage with and access to primary care.53 Recognizing that competing causes of death likely contribute to an underestimate of the risk of death for any specific cause examined, such interventions have the potential to narrow the large gap in mortality between people who experience incarceration and the general population.
Strengths and limitations
This study has several noteworthy strengths and limitations. We used data on a large sample of people who experienced provincial incarceration, which allowed us to identify causes of death that occur less frequently and are amenable to intervention, such as bloodborne infections,8 and the sample was representative of those who experience provincial incarceration in Ontario because we included all those admitted in a year. Because almost all people who are admitted to federal custody are first admitted to provincial custody in Canada, estimates of overall mortality (though not mortality postrelease or in custody), include people who were transferred to federal custody. The long period of follow-up allows examination of mortality by time in custody and over periods of time after release. We achieved a very high rate of linkage of data from the Ontario Ministry of Community Safety and Correctional Services with health administrative databases, with over 80% of cohort members linked deterministically using provincial health card numbers and 97.4% linked in total. There were no missing data for variables provided by the Ontario Ministry of Community Safety and Correctional Services (Table 1), with the exception of neighbourhood income quintile, which is likely due to a large proportion of people reporting no fixed address at the time of admission to custody.54 This suggests that these data were complete; however, we are unable to otherwise assess the quality of data.
Regarding limitations, we did not have data on health status, risk behaviours or criminological history, and these data would allow a more nuanced assessment of the distribution of risk across a heterogeneous population. There may have been errors in data linkage despite the use of a validated procedure for probabilistic linkage.40 Linkage to data on people who had not been incarcerated would likely underestimate the absolute and relative mortality in this cohort, assuming death rates are higher in people with a history of incarceration. A significant number of people in the Ontario Ministry of Community Safety and Correctional Services data set had more than 1 OHIP number across admissions, contributing to about 6.9% of the final sample having more than 1 IKN, which is unusually high. Having multiple IKNs may be due to multiple aliases,55 to losing identification or not having identification at the time of admission to custody, or to clerical errors in data entry at admission to custody. If aliases represent people having multiple identities that are not shared with others, then inclusion of multiple IKNs would not affect outcome classification, whereas if aliases are identities that are shared with others, the inclusion of multiple IKNs could lead to an overestimate of deaths. Further, we did not capture deaths in cohort members that occurred outside of Ontario, which would likely lead to an underestimate of deaths in those with a history of incarceration.2 We did not ascertain the date of release from federal custody in people who were transferred to federal facilities, and therefore we could not determine the total postrelease mortality. We also did not separately examine causes of death for those who were transferred to a federal facility, which may be different than the causes of death for those who were incarcerated only in provincial facilities during the follow-up period.
Conclusion
Although being in custody is a temporary state, it is conceivable that spending any time in custody may serve as a flag for a high risk of adverse health outcomes such as death. This perspective leads to 2 considerations: people who have spent any time in custody should be recognized as being at increased risk of death, and time in custody should be viewed as an opportunity to identify risk and to intervene to mitigate risk. Although in Canada the median length of time in provincial or territorial custody is only days to weeks,3 most people in this cohort spent more than 3 months in custody over the period of follow-up; this large amount of time could be used to provide or to link with programs and services to improve health.8 We suggest a greater focus in Canada on defining health status and improving health in people who experience incarceration, with potential benefits for the whole population.9
Supplemental information
For reviewer comments and the original submission of this manuscript, please see www.cmajopen.ca/content/4/2/E153/suppl/DC1.
Acknowledgements
We are grateful to Kathy Underhill at the Ontario Ministry of Community Safety and Correctional Services for assembling the data set, and to Alexander Kopp at the Institute for Clinical Evaluative Sciences for contributing to the data analyses.
Footnotes
Competing interests: None declared.
Contributors: Fiona Kouyoumdjian led the study. All of the authors contributed to the study design and analysis, and drafting the manuscript. All of the authors gave final approval of the version to be published and agreed to act as guarantors of the work.
Funding: This study was funded by a 2013 University of Toronto Postgraduate Research Award to Fiona Kouyoumdjian. It was also supported by the Centre for Research on Inner City Health, which is part of the Li Ka Shing Knowledge Institute of St. Michael's Hospital. Fiona Kouyoumdjian receives salary support from a Canadian Institutes of Health Research Fellowship. The opinions, results and conclusions are those of the authors and are independent from the funding and supporting agencies.
ICES disclaimer: This study was supported by the Institute for Clinical Evaluative Sciences (ICES), which is funded by an annual grant from the Ontario Ministry of Health and Long-Term Care (MOHLTC). The opinions, results and conclusions reported in this article are those of the authors and are independent from the funding sources. No endorsement by ICES or the Ontario MOHLTC is intended or should be inferred.
References
- Copyright 2016, Joule Inc. or its licensors
In this issue

Article tools


Related Articles
Cited By...
- Burden of opioid toxicity death in the fentanyl-dominant era for people who experience incarceration in Ontario, Canada, 2015-2020: a whole population retrospective cohort study
- Rates of opioid agonist treatment prescribing in provincial prisons in Ontario, Canada, 2015-2018: a repeated cross-sectional analysis
- Fatal overdoses after release from prison in British Columbia: a retrospective data linkage study
- Age-specific incidence of injury-related hospital contact after release from prison: a prospective data-linkage study