


Abstract
Background Several restaurant chains have committed to reducing sodium levels in their foods; however, how much sodium levels have changed over the past few years is unknown. The objective was to measure changes in sodium in restaurant foods from 2010 to 2013.
Methods Data for the serving size, calorie and sodium level of 3878 foods were collected from the websites of 61 Canadian restaurant chains in 2010 and 2013. A longitudinal study of changes in sodium levels in foods available from the restaurants in 2010 and 2013 (n = 2198) was conducted. Levels in newly reported and discontinued foods were also investigated.
Results Sodium levels (mg/serving) decreased in 30.1% of foods, increased in 16.3% and were unchanged in 53.6%. The average change in foods with a decrease in sodium was –220 (standard deviation [SD] ± 303) mg/serving (a decline of 19% [SD ± 17%]), whereas the average change in foods with an increase in sodium was 251 (SD ± 349) mg/serving (a 44% [SD ± 104%] increase). The prevalence and magnitude of change varied depending on the restaurant and food category. Overall, there was a small, yet significant, decrease in sodium per serving (–25 [SD ± 268] mg, p < 0.001); however, the percentage of foods exceeding the daily sodium adequate intake (1500 mg) and tolerable upper intake level (2300 mg) remained unchanged.
Interpretation The observed increases and decreases in sodium show that industry efforts to voluntarily decrease sodium levels in Canadian restaurant foods have produced inconsistent results. Although the lower levels in some foods show that sodium reduction is possible, the simultaneous increase in other foods demonstrates the need for targets and timelines for sodium reduction in restaurants.
Excessive sodium consumption is a causal risk factor for hypertension,1 which is the leading preventable risk factor for death worldwide.2 Currently, 85% of men and 63%–83% of women in Canada have sodium intakes that exceed the daily recommended tolerable upper intake level (2300 mg).3 Reducing sodium intakes in Canada to the recommended level could produce an annual health care savings of $2.99 billion by decreasing the rate of hypertension and cardiovascular disease events by 30% and 13%, respectively.4 Research has shown that 77% of dietary sodium is derived from processed and restaurant foods. This may be partly due to the prevalence of eating outside the home,5 as well as the high levels of sodium found in restaurant foods.6,7
Efforts such as the National Salt Reduction Initiative in the United States have been established to promote the reduction of sodium in packaged and restaurant foods.8 In addition, several restaurants and food companies have made voluntary commitments to lower sodium levels.9,10 Although the Sodium Working Group in Canada created a plan to track sodium reductions,11 they were disbanded before a monitoring system could be implemented.12 Research conducted in 2010 showed alarmingly high sodium levels in Canadian restaurant foods;6,7 however, according to the Canadian Restaurant and Foodservice Association, many restaurants have decreased their sodium levels since that time.13 Nevertheless, no systematic studies have been conducted to investigate the accuracy of such assertions by the restaurant industry. Therefore, the objective of this study was to measure changes in sodium levels in Canadian restaurant foods from 2010 to 2013.
Methods
We conducted a longitudinal follow-up study to a previous report investigating the sodium levels in Canadian fast-food and sit-down restaurants.6
Restaurants included in the study
The restaurants included in the study were identified using the Directory of Restaurant and Fast-Food Chains in Canada.14 Of the 172 restaurants that had > 20 locations across Canada (20 was selected because this is the cut-off for mandatory menu labelling according to the Patient Protection and Affordable Care Act in the US15), 95 provided nutrition information online in 2010 (data for 3 restaurants were collected in early 2011). Data were downloaded and compiled into the University of Toronto Restaurant Database, which contains nutrition information for over 9000 à la carte entrées, side dishes, beverages, desserts and condiments. Details concerning the database have been described elsewhere.16
In May 2013, we revisited the websites for all 95 restaurants and, if available, downloaded their nutrition data. Thirty-four restaurants were excluded for the following reasons: they did not provide serving size data (n = 8), they only provided data for beverages or ice cream (n = 9), they only provided data for the US (n = 7), they no longer provided publicly available nutrition information (n = 4), they did not provide sodium data (n = 3), they substantially changed the format of the data they provided (n = 2) or they were a cafeteria supplier (n = 1).
Database construction
Data collected in 2013 were entered into the existing database where all foods were categorized according to the restaurant, type of restaurant (fast-food v. sit-down restaurant), food category (e.g., hamburgers, sandwiches, etc.) and type of food (e.g., entrée, side dish, kids’ item, etc.). All foods were categorized according to their “food status” in 2013 (newly reported, discontinued or available in both 2010 and 2013). All data entries and categorizations were double-checked against the original source and subjected to range and logic checks. Matched pairs in 2010 and 2013 were examined to ensure plausibility. We excluded all beverages and ice cream (these foods typically do not contain a large amount of sodium), appetizers (this category is too heterogeneous to make reliable comparisons), sauces and condiments (they were not reported by the majority of restaurants), meals combining entrées and side dishes (we would be unable to determine what component of the meal decreased in sodium), size duplications (per 100 g comparisons would be redundant), and categories with less than 10 items.
Statistical analysis
Primary a priori analyses were the longitudinal changes in sodium levels (per serving and per 100 g) overall, in each restaurant and in each food category. Secondary analyses included the percentage of foods meeting or exceeding sodium intake recommendations, simultaneous changes in calories and serving size, and the difference among foods that were newly reported or discontinued. For foods available in 2010 and 2013 (n = 2198), descriptive statistics and pairwise t tests were used to compare sodium levels per serving and per 100 g. Medians were reported to prevent extreme values from skewing the average. The data was right-skewed in both 2010 and 2013; therefore, Monte Carlo simulations of the exact p values were used to confirm the parametric findings. Additionally, general linear models and Monte Carlo exact simulations that included “restaurant” as a covariate were created to control for this potential confounder. The proportion of foods that had an increase or decrease in sodium was calculated for each restaurant and food category. The χ2 test was used to compare the percentage of entrées with sodium levels (mg/serving) greater than the recommended adequate intake level (1500 mg) and tolerable intake level (2300 mg)17 in 2010 and 2013. In addition, the percentage of entrées with less than 600 mg (the healthy amount for restaurant meals and main dishes according to the US Food and Drug Administration [FDA])18 was also compared in 2010 and 2013. A general linear model was constructed to investigate the effect of food status (newly reported, discontinued or available in both 2010 and 2013) as a predictor of sodium levels while controlling for restaurant and food category. Statistical analyses were conducted using SAS version 9.3 software (SAS Institute Inc.).
Results
Sixty-one restaurants, representing > 15 500 food outlets,19 were included in this study (Table 1). Excluded restaurants, and the reasons for their exclusion are provided in Appendix 1 (available at www.cmajopen.ca/content/2/4/E343/suppl/DC1). A total of 3878 à la carte entrée items, side dishes and baked goods from both regular and children’s menus were analyzed. There were 2198 foods for which data were reported in 2010 and 2013, 860 discontinued foods, and 820 newly reported foods.
Overall change in sodium levels
Sodium levels (per serving) decreased in 30.1% of foods, increased in 16.3% of foods and remained unchanged in 53.6% of foods (Figure 1). Although the magnitude of the decrease varied, the average change among foods with a decrease in sodium was −220 (SD ± 303) mg/serving, which was, on average, a 19% (SD ± 17%) decline (Table 2). Among foods with an increase in sodium, the average change was 251 (SD ± 349) mg per serving, which was a 44% (SD ± 104%) increase. Overall, there was a small (−25 [SD ± 268] mg), yet significant (p < 0.001), decrease in sodium levels both per serving and per 100 g.
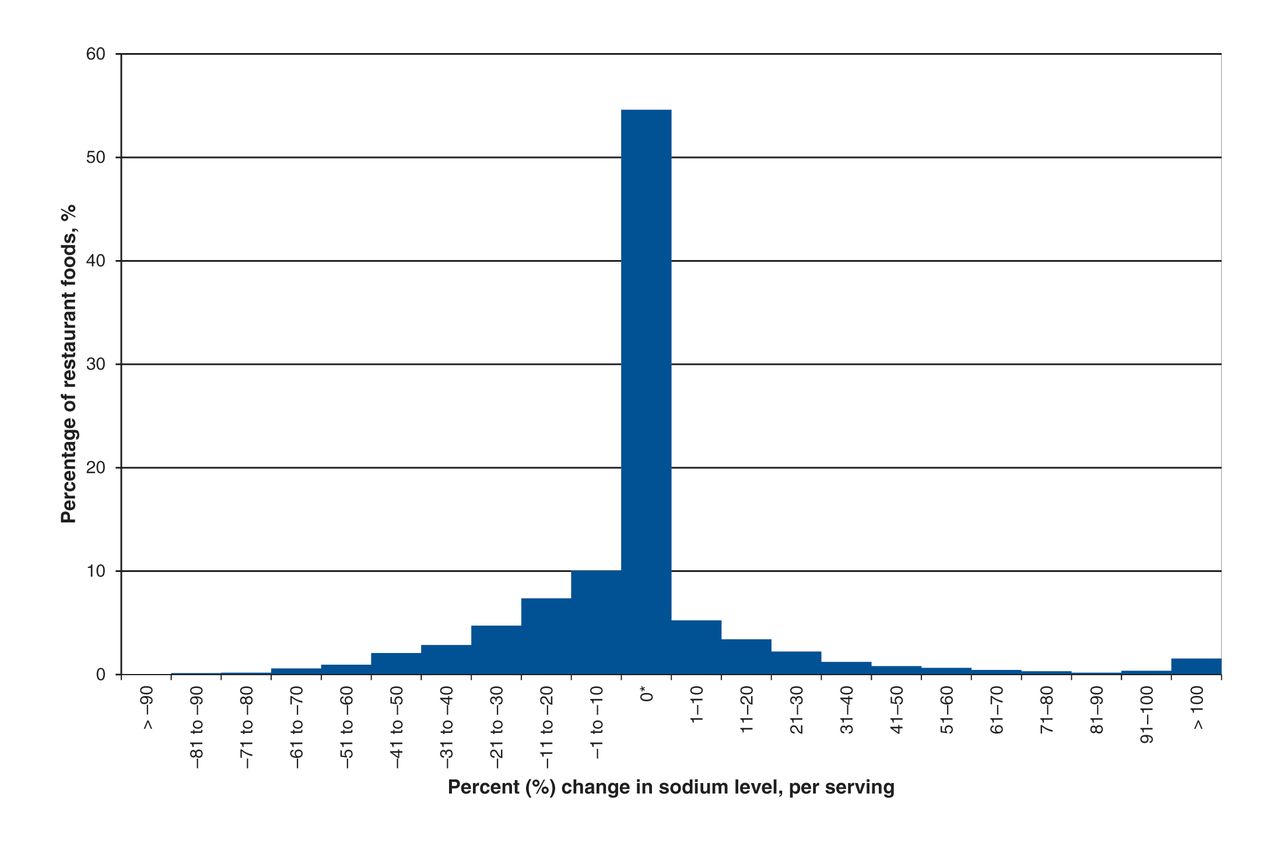
Percent change in sodium levels (per serving) in foods in chain restaurants in Canada (n = 2198) from 2010 to 2013. *Includes foods with no change in sodium from 2010 to 2013 (54%).
Changes in sodium level by food category
Table 3 illustrates that the change in sodium levels varied depending on the food category. Sodium levels (per serving) decreased significantly in some categories (sit-down pizza, sit-down pasta, sit-down entrées for children, fast-food chicken, and fast-food tacos and burritos, p < 0.05), with the average percent decrease ranging from 7% to 26%.
Changes in sodium level by restaurant
The degree to which sodium levels changed varied depending on the restaurant (Table 4). Although sodium levels were completely unchanged in 17 restaurants (28% of the sample), most restaurants had both increases and decreases within their menu. In certain restaurants (such as Subway, Pizza Hut, Taco Bell and Taco Time) sodium levels decreased by at least 20% in more than 70% of foods surveyed. However, in certain restaurants, despite large decreases in some foods, there were equally large increases in others.
Similar results were seen when sodium levels were standardized (mg per 100 g) (Appendix 1, Supplementary Tables 3 and 4, www.cmajopen.ca/content/2/4/E343/suppl/DC1).
Proportion of foods exceeding the recommended daily intake levels for sodium
There was no significant change in the percentage of entrées exceeding the daily sodium adequate intake level (p = 0.7) or tolerable upper intake limit (p = 0.4) (Figure 2). Restaurants decreased sodium levels in 39% of foods that exceeded the adequate intake level in 2010; however, they simultaneously increased the sodium levels in 18% of foods that already exceeded the adequate intake level. Sodium levels were lowered in 51% of foods in which sodium levels exceeded the tolerable upper intake limit in 2010; however, sodium levels were increased in 12% of foods in which sodium levels exceeded the tolerable upper intake level in 2010. Additionally, there was no significant change (p = 0.5) in the percentage of entrées that contained a “healthy” amount of sodium (< 600 mg per meal/main dish, according to the US FDA17) in 2013 versus 2010.
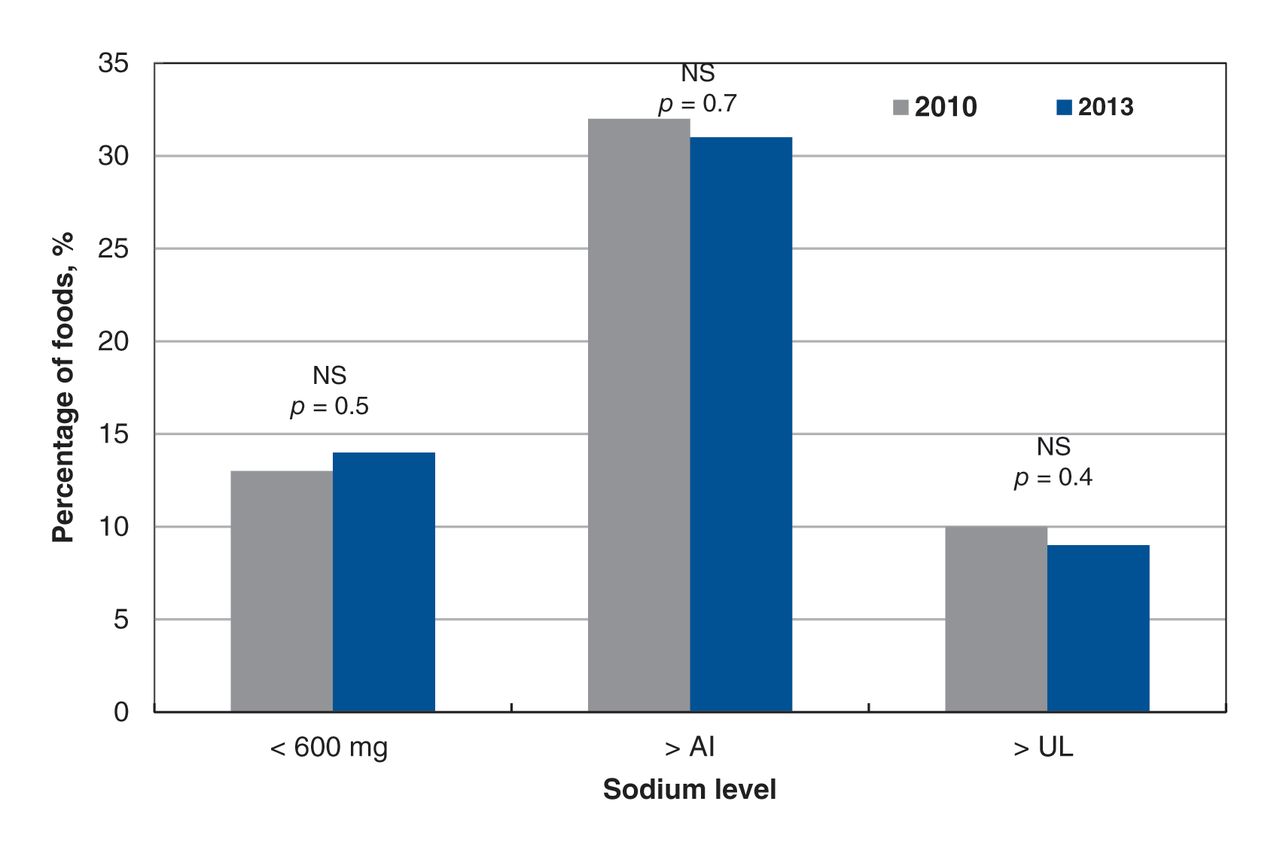
Percentage of restaurant entrees (n = 1004) in three categories: (1) < 600 mg of sodium (the US Food and Drug Administration defines 600 mg of sodium as a “healthy level” for a restaurant meal);18 (2) exceeding the daily recommended adequate intake level (AI, 1500 mg) and (3) exceeding the tolerable upper intake level (UL, 2300 mg) as defined by the Institute of Medicine18 in 2010 and 2013. NS = not significant according to χ2 tests. This graph compares the sodium level in a single entrée (without the accompanying side dishes) to the healthy level for meals and main dishes. The entrées represented include chicken, hamburgers, pastas, ribs, salads, stir-fries and sandwiches or wraps. Therefore, these proportions underestimate the amount of sodium that would typically be consumed at a chain restaurant. Newly reported and discontinued entrées were not included because the different types of entrées were not equally represented in these 2 groups and therefore could bias the outcome. See Appendix 1 (Supplementary Table 5, available at www.cmajopen.ca/content/2/4/E343/suppl/DC1) for data concerning discontinued and newly added foods.
Sodium levels in newly reported, discontinued and persisting foods
When controlling for restaurant and food category, there was no significant difference (p = 0.3) in the sodium level of foods that were newly reported (983 [SD ± 730] mg/serving) in comparison to foods that were discontinued (993 [SD ± 706] mg/serving) or foods that were on the menu in 2010 and 2013 (892 [SD ± 679] mg/serving) (Appendix 1, Supplementary Table 5).
Changes in serving size and calories
Foods with a decrease in sodium (mg/serving) from 2010 to 2013 also had a significant decrease in serving size, sodium per 100 g and calories (p < 0.0001) (Table 1). In addition, foods with an increase in sodium level had a significant increase in serving size, sodium per 100 g and calories (p < 0.05). The number of calories per 100 g did not change in foods in which sodium levels increased or decreased.
Interpretation
Main findings
From 2010 to 2013 sodium levels decreased in 30.1% of foods, increased in 16.3% and remained unchanged in 53.6%. The percentage of foods that increased or decreased and the magnitude of the change varied depending on the restaurant and food category. Changes in sodium levels arose because of both altered serving size and sodium density. The number of menu items with unacceptably high amounts of sodium (exceeding the adequate intake level and tolerable upper intake level) did not change. This study shows that industry efforts to voluntarily decrease sodium levels in restaurant foods in Canada have produced inconsistent results.
Comparison with other studies
Previous studies in the US also have shown that both healthy and unhealthy changes in sodium levels are occurring simultaneously. When comparing identical restaurant foods in 2005, 2008 and 2011, Jacobson and colleagues found a 2.6% increase in sodium levels.9 Meanwhile, Wu and Strum found no change in sodium levels between 2010 and 2011.20
Our data showed that many of the leaders in sodium reduction are restaurants that have made voluntary commitments to reduce the sodium level in their foods (Subway, Pizza Hut, Taco Bell and KFC).9,10 However, all of the restaurants that have made commitments still offer foods that exceed the adequate intake level for sodium, and some even increased sodium levels in certain products. This illustrates how voluntary, industry-designed commitments, such as those that aim to produce an average percentage reduction in sodium across a restaurant’s entire menu, are not ideal because they allow large reductions in certain foods to mask increases in others.
Consuming excessive sodium has been shown to increase a person’s taste preference for foods high in sodium.21–23 However, it is well established that gradually reducing sodium levels is an effective way to retrain the taste buds of consumers to prefer foods that are lower in sodium.24–27 This study shows that the first gradual step toward sodium reduction has been taken by some restaurants; nevertheless, further decreases are still needed to reduce the amount of sodium in restaurant foods to an acceptable level.
Despite the creation of voluntary sodium reduction targets for grocery foods in Canada28 and restaurant targets in the US,9 targets for restaurant foods in Canada are yet to be established. Restaurant foods in Canada have higher sodium levels when compared with foods in countries such as the United Kingdom, which has a government−industry agreement to lower sodium levels.29 Additionally, targets may not be the only way to motivate sodium reduction; research has shown that menu-labelling laws requiring the disclosure of sodium information, such as those implemented in King County, Washington, and also proposed by Toronto Public Health,30–32 may also promote sodium reduction.33
In this study, decreased sodium levels resulted from a combination of both reductions in serving size and sodium density. It is important to note that reduction targets and commitments must aim to lower sodium levels per serving and per 100 g to ensure that sodium reduction is not achieved solely via decreases in serving size. Additionally, given the large number of menu items with sodium levels exceeding the daily adequate intake level (22%) and tolerable upper intake level (10%), reduction target maxima are needed to reduce sodium levels in products that are exceptionally high in sodium. Even though our study showed no change in calorie density, sodium-reduction programs should also ensure that potentially adverse nutrients are not increased to compensate for decreases in sodium.
Limitations
This study included 64% of the top 50 restaurants in Canada (by number of outlets),19 therefore, our sample may not be representative of the entire restaurant food supply because of the number of restaurants that did not disclose nutrition data (Table 1). In addition, this study may not include all menu items from the restaurants represented in the sample. The extent to which the exclusion of restaurants that did not meet the study criteria may have biased the results, in either direction, is unknown. Foods that were “newly reported” in 2013 may not exclusively represent “new menu items” because some restaurants may have reported nutrition information for more menu items in 2013 than in 2010. This may have masked potentially lower sodium levels in new menu items. The accuracy of the findings presented in this study is dependent on the accuracy of the self-reported data provided by the establishments. Furthermore, this study represents the sodium level in foods available in restaurants and does not necessarily reflect consumption. A study in the UK investigating purchase-weighted mean sodium in processed foods showed that mean sodium was 18%–35% higher than unweighted sodium levels.34 More research is needed to understand the effect of market share or purchase weighting on this data. Finally, this study does not shed light on how the sodium levels were reduced (e.g., use of mineral salts [potassium chloride or magnesium sulfate], yeast extracts [hydrolyzed vegetable protein], amino acids, dendritic salt or salt enhancers).27,35
Conclusion
From 2010 to 2013 sodium levels in the majority of restaurant foods in Canada were unchanged. The decreases seen in certain restaurants illustrate that sodium reduction is possible. However, the observed increases in some foods show that industry-wide commitments and a systematic monitoring program are needed. This study highlights the importance of establishing targets for sodium reduction in restaurant foods in Canada, and the need for a government-enforced sodium-reduction strategy with regular monitoring. In conclusion, owing to the slow rate of progress over the past 3 years, alongside high rates of hypertension and cardiovascular disease, addressing the high sodium levels in restaurant foods continues to be a public health priority, and an essential step toward decreasing the burden of diet-related chronic disease.
Supplemental information
For reviewer comments and the original submission of this manuscript, please see www.cmajopen.ca/content/2/4/E343/suppl/DC1
Acknowledgements
Special thanks to Sahar Qassem and Zhila Semnani-Azad for assistance with data entry, as well as Paul Corey for his statistical guidance.
Footnotes
-
Competing interests: None declared.
-
Contributors: Mary Scourboutakos and Mary L’Abbé conceived and designed the study, and analyzed and interpretated the data. Mary Scourboutakos acquired the data and drafted the manuscript. Both authors critically reviewed the manuscript for important intellectual content, approved the final version submitted for publication and agreed to act as guarantors of the work.
-
Funding: Mary Scourboutakos was supported by a Vanier Canada Graduate Scholarship and the Strategic Training Program in Public Health Policy from the Canadian Institutes of Health Research (CIHR) and by a Cancer Care Ontario and CIHR Trining Grant I Poulation Intervetion for Chronic Disease Prevention: A Pan-Canadian Program (Grant No. 538932). Mary L’Abbé was supported by the CIHR and Canadian Stroke Network Operating Grant Competition 201103SOK and received an Earle W. McHenry Chair unrestricted research grant from the University of Toronto.
References
- © 2014 Canadian Medical Association or its licensors
In this issue

Article tools


Related Articles
Cited By...
- No citing articles found.