


Article Figures & Tables
Figures
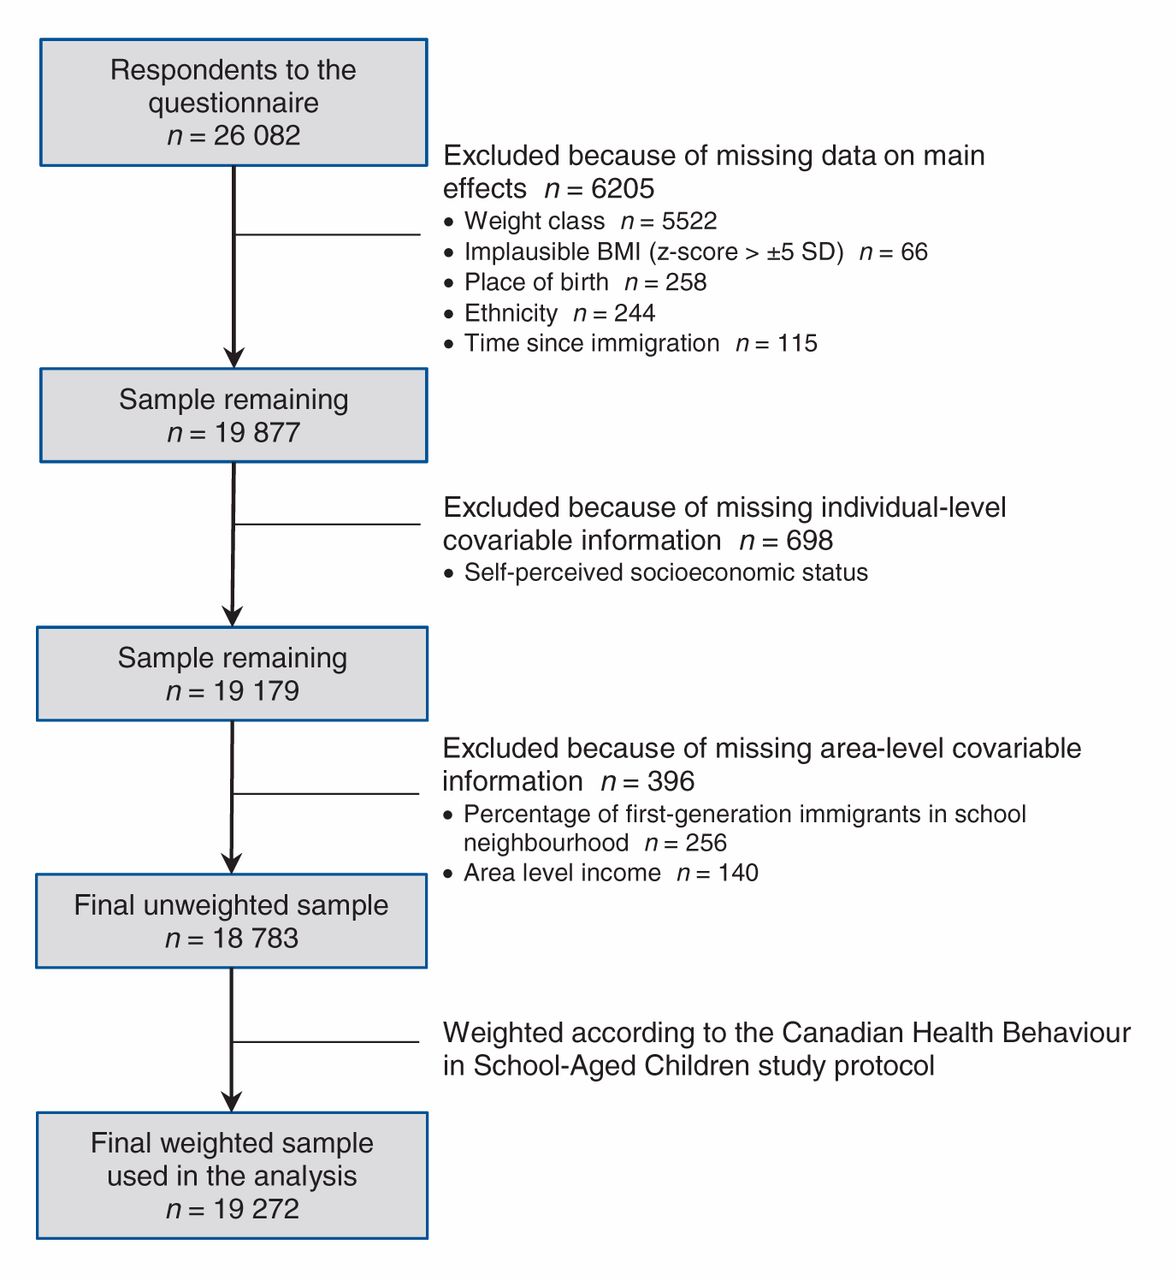
- Figure 1:
Process for selecting study population from respondents to the Canadian Health Behaviour in School-Aged Children, cycle 6 (2010) study.

Tables
- Table 1: Mean BMI percentile of grade 6–10 students by immigration status and additional covariables based on the 2010 Canadian Health Behaviour in School-aged Children study (weighted sample n = 19 272)*
Characteristics of the study population Weighted sample, no. (%) BMI percentile Significance of difference, p† Mean (95% CI) Difference from reference group
(95% CI)Country of birth Canadian born 17 659 (91.6) 58 (57 to 58) Reference Foreign born 1 613 (8.4) 54 (52 to 55) −4 (−6 to −2) < 0.001 Time since immigration, yr Canadian born 17 659 (91.6) 58 (57 to 58) Reference ≥ 6 891 (4.6) 52 (50 to 54) −6 (−8 to −4) < 0.001 3–5 396 (2.1) 56 (53 to 59) −2 (−5 to 1) 0.30 1–2 325 (1.7) 55 (52 to 59) −2 (−6 to 1) 0.23 Ethnicity Canadian host culture 15 071 (78.2) 57 (57 to 58) Reference Arab and West Asian 300 (1.6) 58 (54 to 61) 1 (−3 to 4) 0.78 African 737 (3.8) 60 (58 to 62) 3 (0 to 5) 0.028 East Indian and South Asian 559 (2.9) 52 (49 to 55) −5 (−8 to −3) < 0.001 East and Southeast Asian 1 089 (5.7) 53 (51 to 56) −4 (−6 to −2) < 0.001 Latin American 187 (1.0) 60 (56 to 65) 3 (−2 to 7) 0.24 Other‡ 1 330 (6.9) 59 (57 to 60) 1 (0 to 3) 0.15 Individual-level covariables Sex Male 9 567 (49.6) 61 (60 to 62) Reference Female 9 705 (50.4) 53 (52 to 54) −8 (−9 to −7) < 0.001 Perceived family wealth Well off 11 064 (57.4) 56 (55 to 57) Reference Average 6 436 (33.4) 58 (57 to 59) 2 (1 to 3) < 0.001 Worse off 1 772 (9.2) 61 (59 to 63) 5 (3 to 6) < 0.001 Area-level covariables Median annual household income, $ Quartile 4: > 67 605 4 512 (23.4) 56 (55 to 58) Reference Quartile 3: 53 115–67 605 4 440 (23.0) 56 (54 to 58) 0 (−2 to 2) 0.85 Quartile 2: 43 571–53 114 4 311 (22.4) 56 (55 to 58) 0 (−2 to 2) 0.99 Quartile 1: < 43 571 6 008 (31.2) 59 (58 to 61) 3 (1 to 5) 0.002 Immigrants in the community, % Quartile 4: ≥ 17 6 399 (33.2) 55 (54 to 56) Reference Quartile 3: 9 to < 17 5 095 (26.4) 58 (57 to 60) 3 (1 to 5) < 0.001 Quartile 2: 3 to < 9 4 319 (22.4) 58 (57 to 60) 3 (1 to 5) < 0.001 Quartile 1: < 3 3 459 (18.0) 58 (56 to 60) 3 (1 to 5) 0.008 Statistics Canada population centre category Large urban centre 6 275 (32.6) 56 (54 to 57) Reference Medium centre 3 501 (18.2) 57 (55 to 59) 1 (−1 to 3) 0.24 Small centre 8 898 (46.2) 58 (57 to 59) 2 (0 to 4) 0.015 Rural 597 (3.1) 60 (57 to 64) 5 (1 to 8) 0.019 Note: CI = confidence interval. *n values were weighted according to the Canadian Health Behaviour in School-aged Children study protocol. (22) Totals in a category may vary slightly due to rounding. †We compared the levels of the variables for significant differences while controlling for the clustering effect of school. ‡The “other” ethnic group includes youth who identified with more than 1 of the 6 ethnic groups.
- Table 2: Mean BMI percentiles of Canadian youth predicted by three proposed models by country of birth and ethnicity*
Main effects Base model Adjusted model Adjusted with explanatory variables BMI percentile, mean (95% CI) Difference
from reference,
pBMI percentile, mean (95% CI) Difference
from reference,
pBMI percentile,
mean (95% CI)Difference
from reference,
pCountry of birth Canadian born 58 (57–59) Reference 60 (58–61) Reference 59 (57–60) Reference Foreign born 54 (53–56) < 0.001 56 (54–58) < 0.001 55 (53–57) < 0.001 Ethnicity Canadian host culture 56 (55–57) Reference 57 (56–59) Reference 57 (56–59) Reference Arab and West Asian 57 (54–61) 0.36 59 (56–63) 0.29 59 (55–63) 0.46 African 59 (57–61) 0.01 60 (58–63) 0.007 59 (56–62) 0.12 East Indian and South Asian 51 (49–54) 0.003 54 (51–57) 0.016 53 (50–56) 0.005 East and Southeast Asian 53 (51–55) 0.023 55 (53–58) 0.073 54 (51–56) 0.005 Latin American 60 (55–64) 0.076 62 (57–66) 0.066 61 (56–66) 0.14 Other 57 (55–59) 0.097 59 (57–61) 0.077 57 (55–59) 0.91 Note: CI = confidence interval. *The base model did not control for any covariables. The adjusted model controlled for gender, age, individual-level perceived family wealth, median neighbourhood income, percentage of immigrants in the community and Statistics Canada’s population centre category. The adjusted model with explanatory variables controlled for all variables in the adjusted model, plus television watching, computer use, playing video games, physical activity, snacking while watching television, snacking while on the computer or playing video games and frequency of eating at fast-food restaurants.
- Table 3: Interaction between ethnicity and country of birth among Canadian youth, controlling for level of physical activity and eating behaviours*
Ethnicity Country of birth n BMI percentile,
mean (95% CI)Difference between Canadian- and foreign-born youth Mean (95% CI) p value Canadian host culture Canadian born 14 650 59 (58 to 60) Reference Foreign born 421 53 (49 to 56) −6 (−9 to −3) < 0.001 Arab and West Asian Canadian born 182 65 (60 to 70) Reference Foreign born 118 50 (45 to 56) −14 (−22 to −7) < 0.001 African Canadian born 569 60 (57 to 63) Reference Foreign born 168 60 (54 to 65) −1 (−6 to 5) 0.84 East Indian and South Asian Canadian born 344 56 (53 to 60) Reference Foreign born 214 48 (44 to 53) −8 (−14 to −3) 0.003 East and Southeast Asian Canadian born 615 53 (50 to 56) Reference Foreign born 475 55 (52 to 59) 3 (−1 to 7) 0.16 Latin American Canadian born 102 61 (54 to 68) Reference Foreign born 85 61 (54 to 68) 0 (−9 to 10) 0.96 Other Canadian born 1 206 59 (57 to 61) Reference Foreign born 124 58 (52 to 64) −1 (−7 to 5) 0.72 Note: CI = confidence interval. *The model controlled for gender, age, individual level perceived family wealth, median neighbourhood income, percentage of immigrants in the community and Statistics Canada population centre category, as well as television watching, computer use, playing video games, physical activity, snacking while watching television, snacking while on the computer or playing video games and frequency of eating at fast-food restaurants.
In this issue

Article tools


Related Articles
Cited By...
- No citing articles found.