


Article Figures & Tables
Figures
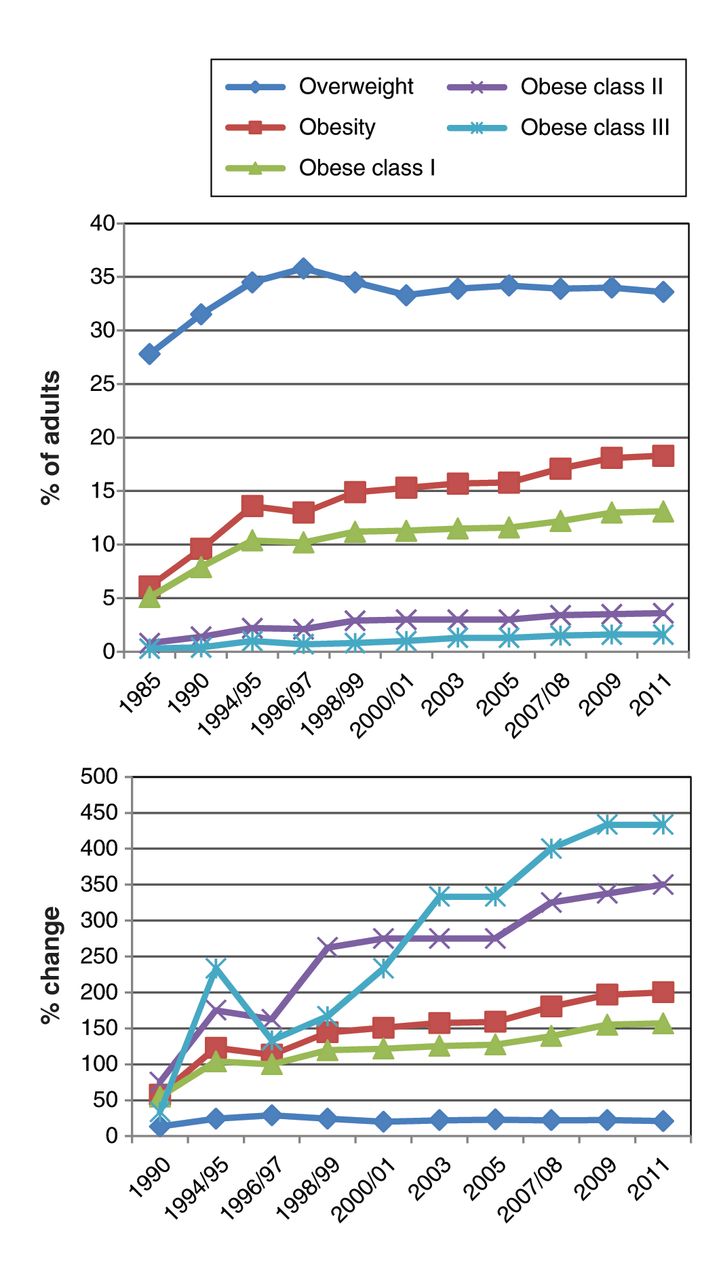
- Figure 1:
(A) Prevalence of adults classified as overweight or obese in Canada from 1985 to 2011, by weight category: overweight (BMI 25.0–29.9), obese (BMI ≥ 30.0), obese class I (BMI 30.0–34.9), obese class II (BMI 35.0–39.9) and obese class III (BMI ≥ 40.0). (B) Percentage change in the prevalence of overweight and obesity in Canada, by weight category, using 1985 data as a baseline. BMI = body mass index.
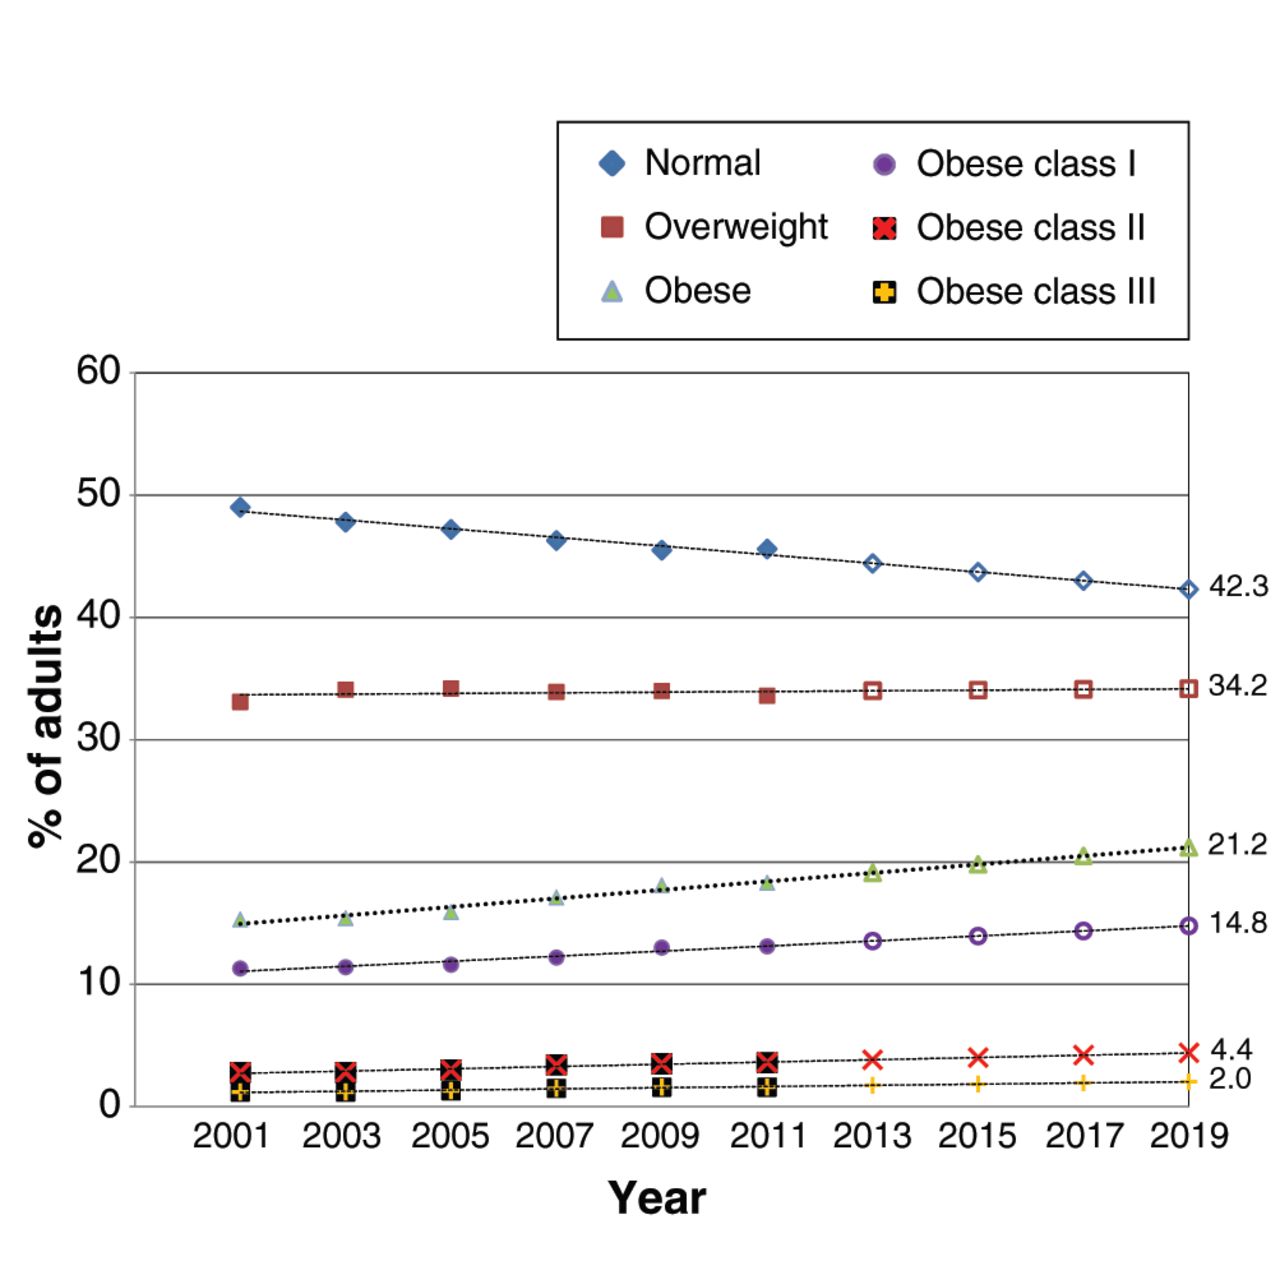
- Figure 2:
Predictions of future prevalence of adult obesity in Canada, from 2013 to 2019, by weight category: normal (BMI 18.5–24.9), overweight (BMI 25.0–29.9), obese (BMI ≥ 30.0), obese class I (BMI 30.0–34.9), obese class II (BMI 35.0–39.9) and obese class III (BMI ≥ 40.0). BMI = body mass index.

Tables
- Table 1: Provincial and national prevalence (%) of body mass index categories in adults (≥ 18 yr) and percentage changes for 2000/01 and 2011
BMI category,* year Provincial National NL PEI NS NB QC ON MB SK AB BC Normal 2000/01 39.0 40.5 42.1 41.9 52.4 47.9 45.5 43.0 47.6 53.8 49.0 2011 29.9 41.8 37.0 38.7 47.1 45.4 40.0 39.0 45.3 51.4 45.6 % change –23.3 3.2 –12.1 –7.6 –10.1 –5.2 –12.1 –9.3 –4.8 –4.5 –6.9 Overweight 2000/01 38.2 38.9 34.9 35.0 31.9 33.6 34.7 35.0 33.9 30.7 33.1 2011 41.8 34.3 37.5 34.3 33.3 33.7 36.5 37.3 33.0 31.3 33.6 % change 9.4 –11.8 7.4 –2.0 4.4 0.3 5.2 6.6 –2.7 2.0 1.5 Obese 2000/01 21.7 19.6 21.4 21.4 12.7 15.6 18.4 20.2 16.4 12.5 15.2 2011 27.7 23.5 23.7 25.1 16.8 18.4 21.6 22.1 19.3 14.5 18.3 % change 27.6 19.9 10.7 17.3 32.3 17.9 17.4 9.4 17.7 16.0 20.4 Obese class I 2000/01 16.1 14.7 14.7 16.0 9.5 11.5 13.0 14.4 12.2 9.3 11.3 2011 20.5 18.0 15.6 16.2 13.1 12.8 15.2 15.9 13.5 10.7 13.1 % change 27.3 22.4 6.1 1.3 37.9 11.3 16.9 10.4 10.7 15.1 15.9 Obese class II 2000/01 4.1 3.3 4.8 3.7 2.4 2.9 3.8 4.3 2.9 2.2 2.8 2011 4.6 3.6 5.8 6.1 2.5 4.0 4.0 4.3 4.3 2.6 3.6 % change 12.2 9.1 20.8 64.9 4.2 37.9 5.3 0.0 48.3 18.2 28.6 Obese class III 2000/01 1.5 1.6 1.9 1.8 0.8 1.2 1.7 1.5 1.2 0.9 1.2 2011 2.6 2.5 2.3 2.8 1.2 1.7 2.4 2.0 1.4 1.2 1.6 % change 73.3 56.3 21.1 55.6 50.0 41.7 41.2 33.3 16.7 33.3 33.3 Note: BMI = body mass index. Data source: Statistics Canada, Canadian Community Health Survey, Share File, 2000/01 (20–64 years), 2003, 2005, 2007–2008, 2009–2010 and 2011 (compiled by the Newfoundland and Labrador Centre for Health Information). *BMI categories: normal (BMI 18.5–24.9), overweight (BMI 25.0–29.9), obese (BMI ≥ 30.0), obese class I (BMI 30.0–34.9), obese class II (BMI 35.0–39.9) and obese class III (BMI ≥ 40.0).
- Table 2: National and provincial prevalence (%) of body mass index categories in adults (≥ 18 yr) and percentage changes for 2000/01 and 2011, by sex
BMI category,* year, sex Provincial National NL PEI NS NB QC ON MB SK AB BC Normal 2000/01 Women 45.1 43.7 49.8 47.1 58.1 54.6 40.6 50.7 55.0 60.1 55.4 Men 33.0 33.7 34.6 36.9 46.9 41.5 50.8 35.8 40.9 47.7 42.9 2011 Women 36.8 52.7 41.9 41.5 53.0 51.4 46.0 45.9 54.5 57.4 51.8 Men 22.9 30.9 31.8 35.9 41.2 39.2 34.0 32.3 36.8 45.4 39.3 % change women –18.4 20.6 –15.9 –11.9 –8.8 –5.9 13.3 –9.5 –0.9 –4.5 –6.5 % change men –30.6 –8.3 –8.1 –2.7 –12.2 –5.5 –33.1 –9.8 –10.0 –4.8 –8.4 Overweight 2000/01 Women 32.1 33.5 28.4 29.0 24.8 26.6 28.6 27.4 26.4 22.8 26.0 Men 44.1 44.0 41.4 40.7 38.7 40.3 40.4 41.9 40.7 38.2 39.9 2011 Women 37.2 25.3 33.5 30.8 26.6 27.6 30.5 30.7 24.8 23.7 27.1 Men 46.4 43.3 41.8 38.0 39.9 39.9 42.4 43.8 40.5 38.9 40.1 % change women 15.9 –24.5 18.0 6.2 7.3 3.8 6.6 12.0 –6.1 3.9 4.2 % change men 5.2 –1.6 1.0 –6.6 3.1 –1.0 5.0 4.5 –0.5 1.8 0.5 Obese 2000/01 Women 21.1 17.1 19.7 21.6 12.1 14.5 18.1 18.7 15.2 11.9 14.4 Men 22.2 21.9 23.1 21.3 13.3 16.8 18.6 21.5 17.4 13.0 16.1 2011 Women 25.3 21.5 21.8 25.0 15.7 17.3 21.2 20.8 16.7 13.9 17.1 Men 30.2 25.7 25.8 25.3 17.9 19.7 22.1 23.4 21.7 15.0 19.5 % change women 19.9 25.7 10.7 15.7 29.8 19.3 17.1 11.2 9.9 16.8 18.8 % change men 36.0 17.4 11.7 18.8 34.6 17.3 18.8 8.8 24.7 15.4 21.1 Obese class I 2000/01 Women 14.2 12.1 12.9 15.6 8.4 10.0 11.6 13.1 10.5 8.2 9.9 Men 17.9 17.2 16.4 16.3 10.5 13.1 14.2 15.6 12.9 10.4 12.6 2011 Women 17.0 16.4 13.8 15.4 11.4 10.9 14.3 12.7 11.0 9.7 11.3 Men 24.2 19.6 17.6 17.0 14.9 14.8 16.2 18.9 15.8 11.7 15.0 % change women 19.7 35.5 7.0 –1.3 35.7 9.0 23.3 –3.1 4.8 18.3 14.1 % change men 35.2 14.0 7.3 4.3 41.9 13.0 14.1 21.2 22.5 12.5 19.0 Obese class II 2000/01 Women 4.7 3.4† 4.4 3.7 2.7 2.9 4.2 3.9 3.0 2.6 3.0 Men 3.5† 3.2† 5.2 3.7 2.1 2.8 3.3† 4.7 2.9 1.8 2.7 2011 Women 5.2† —‡ 5.8 5.8† 2.8 4.2 4.0† 6.2† 3.9 2.5 3.8 Men 4.0† —‡ 5.8† 6.5† 2.1 3.7 4.0† 2.5† 4.5† 2.7† 3.4 % change women 10.6 —‡ 31.8 56.8 3.7 44.8 –4.8 59.0 30.0 –3.9 26.67 % change men 14.3 —‡ 11.5 75.7 0.0 32.1 21.2 –46.8 55.2 50.0 25.9 Obese class III 2000/01 Women 2.2† —‡ 2.3 2.3† 1 1.6 2.3† 1.8 1.8 1.1 1.5 Men —‡ 1.5† 1.4† 1.3† 0.7† 0.9 1.1† 1.3† 0.7† 0.8† 0.9 2011 Women 3† —‡ 2.2† 3.8† 1.4 2.1 2.9† 1.9† 1.8† 1.7† 1.9 Men —‡ —‡ 2.5† —‡ 1.0† 1.2 1.9† 2.0† 1.1† —‡ 1.2 % change women 36.4† —‡ –4.3† 65.2† 40.0 31.3 26.1† 5.6† 0.0† 54.5† 26.7 % change men —‡ —‡ 78.6† —‡ 42.9† 33.3 72.7† 53.8† 57.1† —‡ 33.3 Note: BMI = body mass index. Data source: Statistics Canada, Canadian Community Health Survey, Share File, 2000/01 (20–64 years), 2003, 2005, 2007–2008, 2009–2010, and 2011 for age 18 years and older (compiled by the Newfoundland and Labrador, Centre for Health Information). *BMI categories: normal (BMI 18.5–24.9), overweight (BMI 25.0–29.9), obese (BMI ≥ 30.0), obese class I (BMI 30.0–34.9), obese class II (BMI 35.0–39.9) and obese class III (BMI ≥ 40.0). †Data with a coefficient of variation from 16.6% to 33.3%; these data should be interpreted with caution. ‡Data suppressed because of extreme sampling variation.
- Table 3: National and provincial prevalence (%) of body mass index categories in adults (≥ 18 yr), and percentage changes for 2000/01 and 2011, by age (yr)
BMI category,* year, age Provincial National NL PEI NS NB QC ON MB SK AB BC Normal 2000/2001 18–39 44.3 46.2 49.2 47.8 59.9 54.6 52.4 50.0 53.4 58.5 55.4 40–59 33.7 36.3 37.0 37.6 47.2 42.3 39.9 38.1 42.6 50.2 44.0 ≥ 60 NA NA NA NA NA NA NA NA NA NA NA 2011 18–39 32.3 58.9 46.5 46.9 56.1 53.5 47.0 47.2 52.6 60.5 54.0 40–59 28.1 34.9 31.3 35.8 42.5 41.2 37.1 34.6 39.4 47.4 41.2 ≥ 60 30.0 33.0 34.2 33.1 41.5 38.9 34.2 33.2 40.3 44.0 39.6 % change 18–39 –27.1 27.5 –5.5 –1.9 –6.3 –2.0 –10.3 –5.6 –1.5 3.4 –2.5 % change 40–59 –16.6 –3.9 –15.4 –4.8 –10.0 –2.6 –7.0 –9.2 –7.5 –5.6 –6.4 % change ≥ 60 NA NA NA NA NA NA NA NA NA NA NA Overweight 2000/2001 18–39 33.9 35.5 30.6 32.5 25.7 28.8 30.0 31.7 29.5 26.7 28.3 40–59 42.6 41.1 37.7 36.5 36.2 37.8 38.3 37.3 37.1 33.7 36.8 ≥ 60 NA NA NA NA NA NA NA NA NA NA NA 2011 18–39 34.7 23.8 34.2 27.7 39.5 41.8 48.7 50.9 43.5 35.0 41.8 40–59 45.7 37.3 37.5 34.9 55.6 57.7 62.5 63.9 59.5 50.8 57.5 ≥ 60 44.1 41.7 41.5 41.6 56.5 59.8 65.3 65.6 58.0 54.1 58.9 % change 18–39 2.4 –33.0 11.8 –14.8 53.7 45.1 62.3 60.6 47.5 31.1 47.7 % change 40–59 7.3 –9.2 –0.5 –4.4 53.6 52.6 63.2 71.3 60.4 50.7 56.3 % change ≥ 60 NA NA NA NA NA NA NA NA NA NA NA Obese 2000/2001 18–39 20.1 16.5 17.8 17.6 10.5 12.6 15.9 15.0 13.8 10.1 12.5 40–59 23.0 22.3 24.5 24.6 14.5 18.2 20.9 23.8 19.3 14.3 17.8 ≥ 60 NA NA NA NA NA NA NA NA NA NA NA 2011 18–39 32.1 17.1† 16.2 21.6 13.4 14.1 16.6 17.7 15.3 10.8 14.3 40–59 25.9 27.4 30.8 28.0 19.4 22.1 27.5 25.5 22.9 17.2 21.7 ≥ 60 25.5 25.0 22.5 25.0 17.8 19.6 20.8 23.8 21.1 15.6 19.3 % change 18–39 59.7 3.6%† –9.0 22.7 27.6 11.9 4.4 18.0 10.9 6.9 14.4 % change 40–59 12.6 22.9 25.7 13.8 33.8 21.4 31.6 7.1 18.7 20.3 21.9 % change ≥ 60 NA NA NA NA NA NA NA NA NA NA NA Obese class l 2000/2001 18–39 14.3 11.6 11.8 12.4 7.7 9.3 11.9 10.2 9.9 7.7 9.2 40–59 17.6 17.1 17.4 18.6 11.0 13.4 13.9 17.1 14.9 10.6 13.0 ≥ 60 NA NA NA NA NA NA NA NA NA NA NA 2011 18–39 25.2 12.2 10.8† 11.8 10.4 9.6 11.1 11.1 11.5 7.5 10.1 40–59 16.3 21.3† 19.2 18.2 15.2 14.9 19.9 19.6 15.2 12.7 15.2 ≥ 60 21.3 19.6 16.2 18.3 14.0 14.7 14.6 17.5 14.8 12.3 14.6 % change 18–39 76.22 5.17 –8.47† –4.84 35.06 3.23 –6.72 8.82 16.16 –2.60 9.78 % change 40–59 –7.39 24.56† 10.34 –2.15 38.18 11.19 43.17 14.62 2.01 19.81 16.92 % change ≥ 60 NA NA NA NA NA NA NA NA NA NA NA Obese class ll 2000/2001 18–39 4.5† 3.1† 4.0† 3.6† 2.1 2.3 2.7 3.4 3.0 1.6 2.4 40–59 3.7 3.7† 5.4 3.9 2.6 3.4 4.9 5.2 2.8 2.7 3.2 ≥ 60 NA NA NA NA NA NA NA NA NA NA NA 2011 18–39 4.7† —‡ 3.7† 6.0† 1.9† 3.0 3.4† 4.1† 2.6† 1.7† 2.7 40–59 5.7† —‡ 8.5 7.7† 2.9† 5.2 4.5† 3.8† 6.0† 3.7† 4.7 ≥ 60 —‡ —‡ 4.4† 3.9† 2.5 3.5 4.2† 5.4† 5.1 2.1 3.3 Obese class lll 2000/2001 18–39 1.3† —‡ 2.1† 1.7† —‡ 1.0 1.3† 1.4† 0.9† 0.8† 1.0 40–59 1.8† 1.5† 1.8† 2.0† 0.9† 1.5 2.0† 1.5† 1.6 1.0 1.3 ≥ 60 NA NA NA NA NA NA NA NA NA NA NA 2011 18–39 —‡ —‡ 1.8 3.9† 1.1† 1.5† —‡ 2.5† 1.2† 1.6† 1.5 40–59 —‡ —‡ 3.1† —‡ 1.3† 2.0 3.0† 2.2† 1.8† 0.9† 1.8 ≥ 60 —‡ —‡ —‡ 2.7† 1.2† 1.4† 2.0† —‡ 1.3† —‡ 1.4 Note: BMI = body mass index, NA = not applicable. Data source: Statistics Canada, Canadian Community Health Survey, Share File, 2000/01 (20–64 years), 2003, 2005, 2007–2008, 2009–2010, and 2011 for 18+ years (compiled by the Newfoundland and Labrador, Centre for Health Information). *BMI categories: normal (BMI 18.5–24.9), overweight (BMI 25.0–29.9), obese (BMI ≥ 30.0), obese class I (BMI 30.0–34.9), obese class II (BMI 35.0–39.9) and obese class III (BMI ≥ 40.0). †Data with a coefficient of variation from 16.6%–33.3% should be interpreted with caution. ‡Data suppressed because of extreme sampling variation.
In this issue

Article tools


Related Articles
Cited By...
- Effect of bariatric surgery on cardiac function in obese patients: An echocardiographic assessment
- Factors influencing primary care provider referral for bariatric surgery: Systematic review
- Recent trends in adult body mass index and prevalence of excess weight: Data from the Canadian Primary Care Sentinel Surveillance Network
- Using the Edmonton Obesity Staging System in the real world: a feasibility study based on cross-sectional data
- Lobesite chez ladulte : ligne directrice de pratique clinique
- Obesity in adults: a clinical practice guideline
- Iron deficiency in bariatric surgery patients: a single-centre experience over 5 years
- The usefulness and costs of routine contrast studies after laparoscopic sleeve gastrectomy for detecting staple line leaks
- Laparoscopic sleeve gastrectomy at a new bariatric surgery centre in Canada: 30-day complication rates using the Clavien-Dindo classification
- Cause of death in patients awaiting bariatric surgery