


Abstract
Background: The Veterans RAND 12-Item Health Survey (VR-12) is a generic patient-reported outcome measure derived from the widely used 36- and 12-item Short Form Health Surveys. We aimed to estimate a Canadian preference-based scoring algorithm for the VR-12, enabling the derivation of health utility values for generating quality-adjusted life years (QALYs).
Methods: We conducted a discrete-choice experiment in a sample of the Canadian population in January and February 2019. Participants — recruited from a consumer research panel — completed an online survey, in English or French, that included 11 discrete-choice questions, each comprising 2 health profiles. We defined the health profiles using 8 VR-12 items and a duration attribute. Using conditional logit regressions, where each level of the respective VR-12 items was interacted with duration, we applied the coefficients to estimate health utility values interpretable on a scale of 0 (dead) to 1 (full health). Negative values reflect states considered worse than dead.
Results: A total of 3380 individuals completed the survey. Of these, 1688 (49.9%) were females, and 3101 (91.7%) completed the English version of the survey. Across all models, “feel downhearted and blue all of the time” and “pain interferes with your normal work extremely” were associated with the largest decrements in health utility. Excluding the 685 respondents (20.3%) who provided inconsistent responses had a negligible effect on the results. The recommended model, weighted to match population demographics, had health utility values ranging from −0.589 to 1.000.
Interpretation: Health utility values that reflect the preferences of the Canadian population can now be derived from responses to the VR-12. These values can be used to generate QALYs in future analyses.
Patient-reported outcome measures are used to collect information about aspects of respondents’ health status at a particular point in time. Generic patient-reported outcome measures (as opposed to condition-specific patient-reported outcome measures) can be applied across different populations. They comprise questions about health-related aspects of quality of life, each with defined levels of impact or severity, resulting in the definition of a multitude of health states.1 Preference-based patient-reported outcome measures include scoring algorithms that provide a “value set” — a set of index scores (often referred to as health utility values or preference weights) that provides a value for each unique instrument-defined health state.1 Health utility values are interpreted on a scale anchored at full health = 1 and dead = 0, with negative scores reflecting health states worse than dead.2–4 Health utility values can be used to calculate quality-adjusted life years (QALYs) to inform analyses such as economic evaluations and population health comparisons.
Health utility values can be obtained by eliciting preferences that capture willingness to trade extra years of life for improvements in health (i.e., trading quantity for quality). In several jurisdictions, including Canada, guidelines for the conduct of economic evaluation recommend that health utility values reflect the preferences of a representative sample of the general population.5–7 Currently, Canadian value sets are available for a number of generic, preference-based, patient-reported outcome measures, including the Health Utilities Index (HUI) Mark 2 (HUI2)8 and Mark 3 (HUI3)9 and the 3-level (EQ-5D-3L)10 and 5-level (EQ-5D-5L)11 versions of the EQ-5D. The availability of these value sets has the dual benefit of providing analysts with options when selecting outcome measures and ensuring that the preferences of Canadians are reflected in health care decision-making (e.g., in health technology appraisal processes).
Increasingly, the Veterans RAND 12-Item Health Survey (VR-12) is being used to measure health-related quality of life in routine data collection initiatives.12,13 The VR-12 is a shortened version of the Veterans RAND 36-item Health Survey,14 which was itself an adaptation of the RAND 36-item Health Survey (also known as the RAND SF-36).15 The VR-12 includes 12 questions that cover 8 domains, plus 2 questions that ask about health issues “compared with 1 year ago.”12 The VR-12 was not designed to describe health states for the purposes of deriving health utility values. Scoring of the VR-12 is based on psychometric measurement methods for deriving scales that correspond with the 8 domains, as well as overarching physical and mental component scores.12
Given increasing use of the VR-12 in routine population measurement (in part because it is free for the user, although permission from the developers is required),16 considerable VR-12 data are available to inform real-world analyses such as economic evaluations. To facilitate this utilization, in a manner aligned with national guidelines, a value set that reflects the preferences of Canadians is required. Accordingly, our objective was to develop a scoring algorithm, based on the preferences of the Canadian general public, that estimates health utility values for health states described by the VR-12.
Methods
Study design
We used an online survey to administer a discrete-choice experiment in January and February 2019. The experiment required participants to choose their preferred option when presented with 2 health profiles (called a “choice set”). Each health profile described living in a health state defined using attributes and levels from 8 VR-12 items, for a certain duration. Respondents completed 11 choice sets. With aggregation across the sample, such data can be used to estimate population-level trade-offs between different health states (representing aspects of quality of life) and length of life, resulting in a societal value set — an approach that has been used in previous studies.17–19 We piloted the survey to get feedback on participants’ understanding of the questions.
In the following sections (supplemented by further details in Appendix 1, available at www.cmajopen.ca/content/10/3/E589/suppl/DC1, including the Checklist for Reporting Results of Internet E-Surveys [CHERRIES]20), we describe development of the discrete-choice task and the survey, as well as the methods of analysis.
Participants
For the pilot phase of the project, we sought about 100 Canadians (recruited from the Amazon Mechanical Turk marketplace) to complete a survey hosted on the PrefApp platform located at the Centre for Health Evaluation and Outcome Sciences (British Columbia, Canada). We performed recruitment for the subsequent main survey (aiming for a sample of about 3000 respondents) through a larger study, in which half the participants were randomly assigned to complete the survey described here (again, on the PrefApp platform); the other half completed a different survey on an unrelated research question concerning the VR-12. A market research company (Ipsos) invited members of their national consumer research panel, primarily by email, to take part in “a study about a measure of quality of life.” Participants who clicked on the link were given further information about both surveys, including the type of questions and approximate completion time. Those who continued were given further study information and asked if they wanted to consent to proceed.
After providing consent and answering demographic questions, participants were randomly assigned to 1 of the 2 surveys. Participants who completed the survey were awarded points by the company, which could be used toward financial rewards. We used quota sampling to encourage representation of the Canadian general population in terms of age, biological sex and location (based on provinces). We checked Internet Protocol addresses for duplicates, to reduce the likelihood that individuals completed the survey more than once.
Data sources
We obtained data for the main analysis by asking participants to answer discrete-choice questions based on health states described using the VR-12. Not all items in the VR-12 are relevant for the purposes of defining and valuing a health state (e.g., questions asking “compared with 1 year ago”), and multiple items measure similar constructs; therefore, 3 of the authors (B.J.M., J.E.B., D.R.) used an established process to construct a health state classification system.21,22 The process comprises factor analysis to assess dimensionality, Rasch analysis to understand item performance and tests of differential item function. This resulted in the selection of 8 health attributes, each of which corresponded to a VR-12 item.
We used the following naming conventions for the VR-12-related attributes: physical functioning, role physical, role emotional, bodily pain, mental health — anxiety, mental health — depression, vitality and social functioning. We constructed the levels for each attribute on the basis of response options for the respective VR-12 item, with the exception of items that included “a good bit of the time.” This response option was deemed too similar to “a little of the time” and was removed from the classification system. The final classification system, presented in Appendix 2 (available at www.cmajopen.ca/content/10/3/E589/suppl/DC1), defines 234 375 (3*57) health states.
Following previous studies,17–19 we used a discrete-choice experiment to elicit trade-offs between health states described by the 8 VR-12 items and life duration. To do this, we added a ninth attribute, the duration attribute, termed “life years.” We described this attribute using 4 levels (“1 year,” “4 years,” “7 years” and “10 years”), an approach used in previous studies. 17,23 We chose an upper limit of 10 years for comparability with the time horizon in most national valuation studies.24–26
We developed a pilot version of the survey using feedback from 16 cognitive interviews (conducted by R.M.; details provided in Appendix 1, including Appendix Table 1). Feedback from the pilot survey (n = 103) informed some revisions to the wording and layout of the final survey (Appendix 3, available at www.cmajopen.ca/content/10/3/E589/suppl/DC1). The survey was then forward-and back-translated into French. The demographic characteristics of those who participated in the cognitive interviews and in the survey pilot testing are available in Appendix 1 (Appendix Tables 2 and 3, respectively).
Characteristics of survey respondents, with comparable statistics for the Canadian general population, drawn from Statistics Canada 2016 Census28
Results from the unanchored models
Anchored disutility values for each attribute level of the preferred model (model 6)*
The final survey began with details about the study, followed by a consent form and questions to collect information about the characteristics and health history of participants. Participants were then asked to complete the VR-12 for themselves (with instruction that later questions would be based on this questionnaire), followed by a warm-up discrete-choice exercise and, finally, the discrete-choice questions.
Feedback from the cognitive interviews informed the development of the discrete-choice task in the final survey. Figure 1 provides an example of a choice set that was presented to participants in the final survey. One of the authors (R.N.) used experimental design theory (NGene, modified Federov algorithm) to select 200 choice sets (from the millions of possible choice sets) that would provide the most information for analysis purposes, i.e., a d-efficient design. These 200 choice sets were “blocked” into 20 groups of 10 questions to ensure that each block had representation of attributes and levels. We randomly assigned each participant to 1 of the blocks. To assess the consistency of participants’ responses, we repeated the warm-up discrete-choice question along with the set of 10. The repeated question (i.e., an 11th question) appeared fourth in the sequence, and we did not use the responses to this question in the modelling. We explored engagement with the task by timing how long participants took to answer all 11 discrete-choice questions.

Example of a choice set presented to participants. Details about the use of different intensities of highlighting (i.e., the various shades of yellow) for 5 of the attributes are provided in Appendix 1.
Statistical analysis
Our analysis followed the methods reported in peer-reviewed studies that used discrete-choice experiments to elicit population value sets.17–19,23 We (N.B., B.J.M., R.N., J.E.B., D.R., D.G.T.W.) used conditional logit regression to model the data. This method estimates coefficients for each level of the VR-12-related attributes (dummy-coded, with the best level used as the reference category) interacted with the corresponding number of life years, along with a coefficient for the duration attribute as a main effect. The coefficient for the life years main effect is the value of living in full health for 1 year (expected to be positive). The coefficients for each level of the VR-12-related attributes reflect the disutility of living with the respective impairment for a duration of 1 year (expected to be negative). A random error term captured unobservable factors, as well as potential inconsistencies in decision-making. 27 We tested interactions between dummy-coded levels of duration and, if satisfied that they were sufficiently linear, coded them as continuous, both in the main effect and the set of interaction terms.
The estimated regression coefficients are on a latent scale: they do not have cardinal properties and, therefore, their magnitudes are not directly comparable (“unanchored” coefficients). We estimated coefficients anchored on the full health – dead scale as the marginal willingness to trade an extra year of life for each VR-12-related attribute level, calculated by dividing each interaction coefficient by the duration coefficient. Additive combinations of anchored coefficients provide the health utility values for the health states defined by the classification system.
Previous valuation studies have reported inconsistencies in the directionality of coefficients when valuing large descriptive systems (e.g., when an increase in severity leads to an increase rather than a decrease in utility). We used models involving combinations of attribute levels (merged on the basis of best fit) to overcome any inconsistencies, while also exploring issues of participant engagement and understanding regarding the survey. Because preferences may vary in relation to different sociodemographic characteristics, we weighted the “preferred” final model to ensure a representative population estimate and to account for non-response and noncoverage. We applied a raking approach using data from the 2016 Census28 and the 2015/16 Canadian Community Health Survey (https://www23.statcan.gc.ca/imdb/p2SV.pl?Function=getSurvey&Id=238854) to develop weights, and included these weights in the conditional logit models. We performed the analyses with Stata and SAS software.
Ethics approval
The study was approved by the University of British Columbia Behavioural Research Ethics Board (study no. H18-00969).
Results
A total of 8110 individuals clicked on the initial link to find out further information about the larger study (i.e., the 2 surveys), of whom 6731 (83.0%) provided consent to take part. The discrete-choice survey was randomly assigned to 3445 (51.2% of the 6731) potential participants; 3380 (98.1% of the 3445) completed all survey questions, which yielded 33 800 choice-set responses for analysis.
Table 1 reports the demographic characteristics of the survey respondents. Relative to the Canadian general population, differences included a higher proportion of study participants who identified as white, with lower reported annual income, with higher levels of education and having never legally married. A lower proportion of respondents chose to complete the survey in French, relative to the proportion of Canadians reporting French as their first official language spoken.
Of the 10 379 choice sets where the level of life duration varied between health profiles, the profile with the lower duration was selected on 2433 (23.4%) occasions.
Unanchored values
Results from the conditional logit models are provided in Table 2. Model 1 includes all respondents. Most coefficients (26 of 30) were negative, with the magnitude of the disutility tending to increase with more severe levels of impairment. Based on the coefficients of the worst levels, the most important attributes were mental health — depression (−0.145) and bodily pain (−0.127), whereas the least important were role physical (−0.047) and role emotional (−0.048). As expected, there were some directional inconsistencies; however, vitality level 4 was the only statistically significant inconsistency at the 5% level.
In models 2 to 5, attribute levels were combined to overcome directional inconsistencies (Table 2). Model 2 included all participants; model 3 excluded the 37 respondents (1.1%) who provided the same answer to all 10 discrete-choice questions (i.e., always selected health state A or always selected health state B); model 4 excluded the 685 respondents (20.3%) whose responses failed the consistency check; and model 5 excluded the 315 respondents (9.3%) who completed all questions in less than 2 minutes. Across all 4 consistent models, a similar pattern was observed when attributes were ordered according to the magnitude of the coefficients of the worst levels. Given the similarities across models 1 to 5, model 2 was considered the most defensible because of the directional consistency and inclusivity of participants. Model 2 was then weighted to adjust for the differences between the study sample and the Canadian general population (i.e., model 6 is a weighted version of model 2).
Anchored values
Figure 2 shows the anchored value sets produced by all models; the corresponding coefficients are presented in Appendix 1, Appendix Table 4. The anchored values for each attribute level of model 6 are provided in Table 3. These results provide the means to calculate health utility values for all health states defined by the classification system. The health utility values for model 6 ranged from 1.000 (no impairment on any attribute) to −0.589 (the worst level of impairment on all attributes); 5.9% of the health states had values less than or equal to 0. The distribution of health utility values for model 6 is shown in Figure 3.
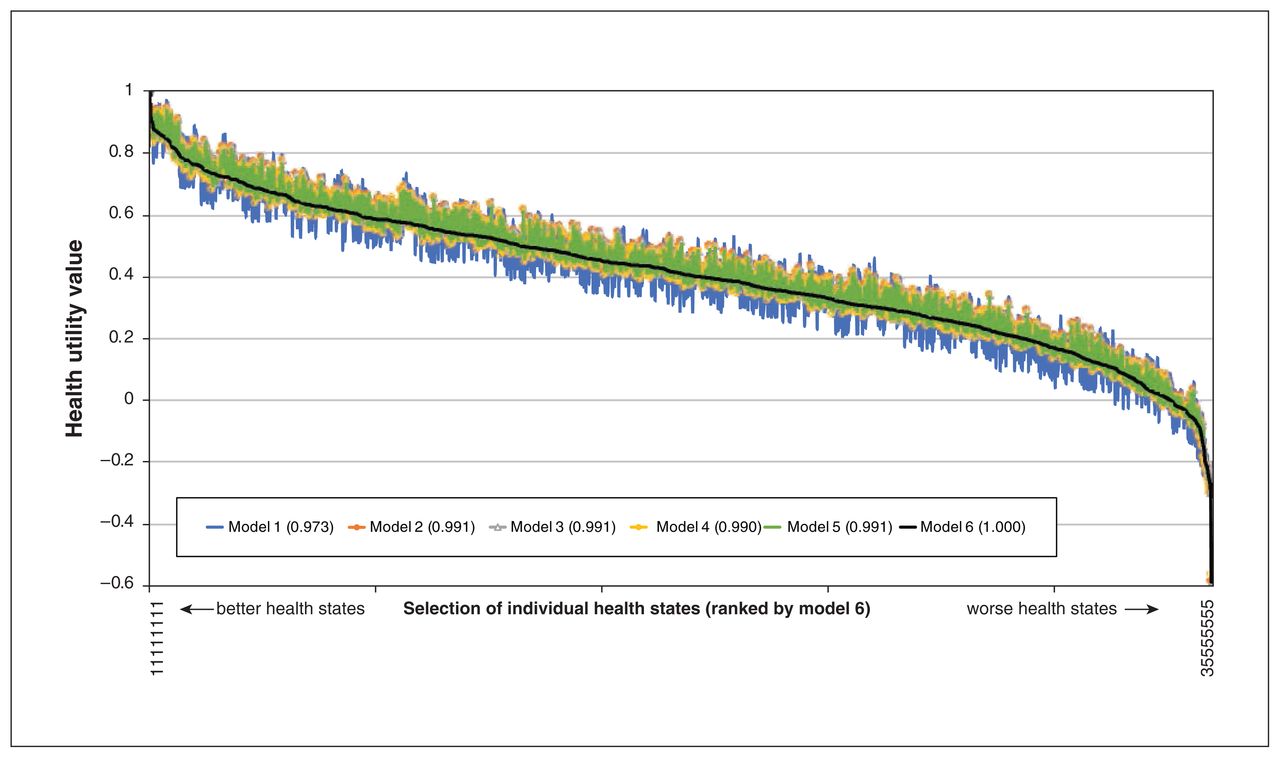
Anchored health utility values from the 6 models, presented as the health utility values for each model for each health state. The “best” health state (i.e., level 1 in all attributes, denoted as health state 11111111) is on the far left, with a health state equal to 1. The “worst” health state (i.e., the lowest level on each attribute, denoted as 35555555) is on the far right. The Pearson correlation with model 6 is shown in parentheses for each of the other models.

Distribution of health utility values for model 6 (the preferred model) across all possible health states.
Interpretation
In this study, we developed a value set for the VR-12 based on the preferences of the Canadian general public. We suggest use of model 6 (Table 3) because it has consistently ordered levels, is based on the preferences of all respondents and is weighted to the demographic characteristics of the Canadian population. Further information and tools to facilitate the scoring of health utility values from VR-12 responses is available on the study website (www.bcpcm.ca/resources/VR-12/).
Many preference-based, patient-reported outcome measures are available for use,1 and 1 previous study has estimated health utility values for the VR-12 (based on a mapping exercise using values from the United Kingdom).29 Although there are myriad reasons why value sets differ across different preference-based instruments, recent studies in Canada and the UK have been consistent in identifying pain and mental health items as being associated with the largest utility decrements. 11,23,25 In the UK value set for the SF-6Dv2, the most severe level of pain had a disutility of 0.620,23 compared with 0.272 in the current study. The difference in magnitude is likely related to the items used in the respective studies, with the SF-6Dv2 using the SF-36v2 pain severity item,21 whereas the single pain item in the VR-12 is framed around interference “with your normal work.”
We recognize that there is no “best” preference-based patient-reported outcome measure, and health utility values across instruments are expected to differ,30,31 something that is reflected in Canadian guidelines for the conduct of economic evaluation.5 Instead, researchers are required to consider the relative merits of the available options for the evaluative purpose being pursued. For example, anxiety and depression, which are combined in a single item in the EQ-5D instruments, have been shown to be valued differently.32 The Canadian value set for the VR-12 separates anxiety from depression, meaning that it may better reflect changes in health outcome attributable to interventions that improve one but not the other. This is a context-specific empirical question and highlights the need for comprehensive comparative psychometric evaluation of the new classification system and value set (i.e., compared with other preference-based, patient-reported outcome measures).
Another empirical question is whether health state values from patient populations would differ from those elicited from the general public,33 and whether the use of societal preferences undervalues the quality of life of people with health conditions and disabilities.34,35 The approach taken in this study — elicitation of societal preferences — reflects the explicit expectations detailed in national guidelines for the economic evaluation of health technologies.5–7
Limitations
Preference elicitation tasks, such as discrete-choice experiments, are cognitively challenging,36,37 which can introduce bias into the sample and the subsequent responses and results. To mitigate the potential of such biases, we used cognitive interviews and pilot testing in designing our discrete-choice experiment, and we employed novel methods to simplify the task (Appendix 1). Such methods have been used successfully in other discrete-choice studies.19,37
Although our results showed some inconsistencies, these were resolved by combining adjacent levels. We do not know if these inconsistencies were a result of the choice sets presented (i.e., a “real” inconsistency), participants’ lack of comprehension of or attention to the task, or merely random. Regardless of the reason, a methodologic priority is to advance the design of preference elicitation tasks to address issues of inclusivity. Such advances must extend beyond recognition of individuals with lower cognitive abilities.36
Our study included the preferences of more Canadians than any other Canadian value set, yet it cannot be said to have explored preferences that reflect the full diversity of the population. For example, we did not include French speakers in the cognitive interview phase, and only 8.3% of the sample chose to complete the French version of the survey.
Our sample, recruited from a consumer research panel to complete an online survey, likely had higher literacy skill levels than the general population.
Conclusion
Health utility values reflecting Canadian preferences can now be generated from VR-12 responses. The new scoring algorithm provides a means to make further use of existing data sets, as well as an alternative to the HUI and EQ-5D instruments for the estimation of QALYs in economic evaluations involving primary data collection.
Acknowledgements
The authors acknowledge Judy Chiu for support in manuscript preparation. They also thank the respondents for taking part in the study and attendees of the 41st Annual North American Meeting of the Society for Medical Decision Making (Portland, Oregon), who provided valuable feedback.
Footnotes
Competing interests: None declared.
This article has been peer reviewed.
Contributors: Nick Bansback, Logan Trenaman, Richard Sawatzky and David Whitehurst conceived and designed the study; Nick Bansback, Logan Trenaman, Rebecca Metcalfe and David Whitehurst acquired the data; and Nick Bansback, Logan Trenaman, Brendan Mulhern, Richard Norman, Richard Sawatzky, John Brazier, Donna Rowen and David Whitehurst analyzed and interpreted the data. Nick Bansback and David Whitehurst drafted the manuscript. All of the authors revised the manuscript critically for important intellectual content, approved the final version for publication and agreed to be accountable for the work.
Funding: This study was funded by the British Columbia Patient-Centred Measurement Steering Committee.
Data sharing: Aggregated data presented in this manuscript are available to other investigators upon request to the corresponding author. Further analysis of individual-level data is also available upon request.
Supplemental information: For reviewer comments and the original submission of this manuscript, please see www.cmajopen.ca/content/10/3/E589/suppl/DC1.
This is an Open Access article distributed in accordance with the terms of the Creative Commons Attribution (CC BY-NC-ND 4.0) licence, which permits use, distribution and reproduction in any medium, provided that the original publication is properly cited, the use is noncommercial (i.e., research or educational use), and no modifications or adaptations are made. See: https://creativecommons.org/licenses/by-nc-nd/4.0/
References
- © 2022 CMA Impact Inc. or its licensors
In this issue

Article tools


Related Articles
Cited By...
- No citing articles found.