


Article Figures & Tables
Figures
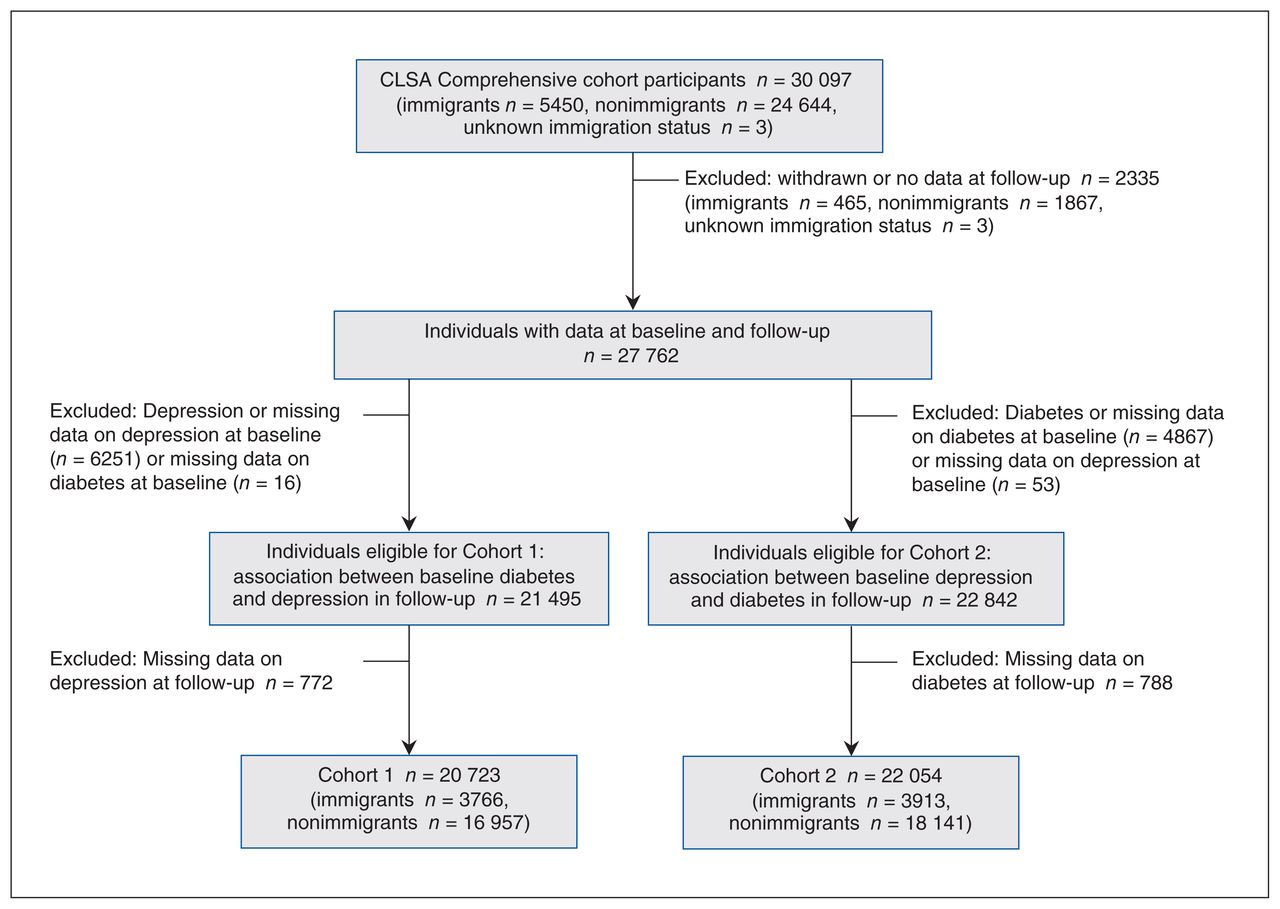
- Figure 1:
Flow chart of study cohorts. Note: CLSA = Canadian Longitudinal Study on Aging.
Tables
- Table 1:
Baseline characteristics of Cohort 1 individuals with and without baseline diabetes by immigration status
Characteristic Immigrant Nonimmigrant No. (%) of participants with diabetes
n = 616No. (%) of participants without diabetes
n = 3150No. (%) of participants with diabetes
n = 2639No. (%) of participants without diabetes
n = 14 318Age, yr 45–60 141 (22.9) 1173 (37.2) 893 (33.8) 7050 (49.2) 61–70 236 (38.3) 1050 (33.3) 969 (36.7) 4224 (29.5) 71–85 239 (38.8) 927 (29.4) 777 (29.4) 3044 (21.3) Sex Male 408 (66.2) 1743 (55.3) 1551 (58.8) 7167 (50.1) Female 208 (33.8) 1407 (44.7) 1088 (41.2) 7151 (49.9) Marital status Single 27 (4.4) 149 (4.7) 234 (8.9) 1176 (8.2) Married 455 (73.9) 2405 (76.3) 1834 (69.5) 10407 (72.7) Widowed, divorced or separated 134 (21.8) 595 (18.9) 571 (21.6) 2731 (19.1) Missing – 1 (0.0) – 4 (0.0) Language most spoken at home French 31 (5.0) 205 (6.5) 541 (20.5) 3171 (22.1) English 492 (79.9) 2597 (82.4) 2092 (79.3) 11114 (77.6) Other 55 (8.9) 254 (8.1) 3 (0.1) 17 (0.2) Missing 38 (6.2) 94 (3.0) 3 (0.1) 16 (0.1) Ethnic or racial background White 464 (75.3) 2640 (83.8) 2596 (98.4) 14166 (98.9) Black 36 (5.8) 89 (2.8) 8 (0.3) 19 (0.1) South Asian 50 (8.1) 122 (3.9) 0 (0.0) 6 (0.0) Chinese 24 (3.9) 107 (3.4) 8 (0.3) 37 (0.3) Other 42 (6.8) 188 (6.0) 25 (0.9) 80 (0.6) Missing – 4 (0.1) 2 (0.1) 10 (0.1) Years since arrival to Canada < 20 42 (6.8) 396 (12.6) – – 20–40 162 (26.3) 781 (24.8) – – > 40 412 (66.9) 1973 (62.6) – – Total household income, $ < 20 000 29 (4.7) 82 (2.6) 140 (5.3) 432 (3.0) 20 000–50 000 141 (22.9) 589 (18.7) 641 (24.3) 2435 (17.0) 50 000–100 000 245 (39.8) 1076 (34.2) 927 (35.1) 4786 (33.4) > 100 000 163 (26.5) 1180 (37.5) 779 (29.5) 5855 (40.9) Missing 38 (6.1) 223 (7.0) 152 (5.8) 810 (5.7) Working status Employed 158 (25.6) 1333 (42.3) 826 (31.3) 6368 (44.5) Unemployed 29 (4.7) 111 (3.5) 72 (2.7) 468 (3.3) Retired 429 (69.6) 1699 (54.0) 1732 (65.6) 7453 (52.1) Missing – 7 (0.2) 9 (0.3) 29 (0.2) Education level Less than secondary school 20 (3.2) 77 (2.4) 188 (7.1) 590 (4.1) Secondary school 51 (8.3) 195 (6.2) 316 (12.0) 1275 (8.9) Postsecondary degree or diploma 541 (87.8) 2870 (91.1) 2134 (80.9) 12436 (86.9) Missing 4 (0.6) 8 (0.3) 1 (0.0) 17 (0.1) Place of residence* Rural 58 (9.4) 310 (9.8) 365 (13.8) 1849 (12.9) Urban 551 (89.4) 2799 (88.9) 2239 (84.8) 12303 (85.9) Missing 7 (1.1) 41 (1.3) 35 (1.4) 166 (1.2) Province Quebec 65 (10.6) 365 (11.6) 536 (20.3) 3199 (22.3) British Columbia 189 (30.7) 996 (31.6) 538 (20.4) 2736 (19.1) Ontario 169 (27.4) 869 (27.6) 551 (20.9) 2920 (20.4) Other† 193 (31.3) 920 (29.2) 1014 (38.4) 5463 (38.2) Medical conditions‡ Living with pain 226 (36.7) 944 (30.0) 1055 (40.0) 4260 (29.8) Bowel disorders 41 (6.7) 227 (7.2) 224 (8.5) 1135 (7.9) Arthritis 16 (2.6) 83 (2.6) 109 (4.1) 355 (2.5) Heart disease 370 (60.1) 1007 (32.0) 1552 (58.8) 4353 (30.4) Kidney disease 36 (5.8) 66 (2.1) 111 (4.2) 292 (2.0) Stroke 11 (1.8) 36 (1.1) 65 (2.5) 157 (1.1) Cancer 95 (15.4) 475 (15.1) 465 (17.6) 2005 (14.0) Hypertension 355 (57.6) 1081 (34.3) 1530 (58.0) 4851 (33.9) Anxiety disorder 17 (2.8) 109 (3.5) 137 (5.2) 606 (4.2) Alcohol consumption Never 92 (14.9) 309 (9.8) 340 (12.9) 1209 (8.4) About once a month 141 (22.9) 514 (16.3) 608 (23.0) 2255 (15.7) 2–4 times a month 115 (18.7) 576 (18.3) 588 (22.3) 3160 (22.1) > 2 times a week 239 (38.8) 1641 (52.1) 1031 (39.1) 7433 (51.9) Missing 29 (4.7) 110 (3.5) 72 (2.7) 261 (1.8) Smoking status Nonsmoker 297 (48.2) 1691 (53.7) 1088 (41.2) 7184 (50.2) Former smoker 275 (44.6) 1291 (41.0) 1348 (51.1) 6029 (42.1) Smoker 44 (7.1) 168 (5.3) 203 (7.7) 1105 (7.7) Sleep quality Satisfied or very satisfied 373 (60.6) 2014 (63.9) 1615 (61.2) 9114 (63.7) Neutral 116 (18.8) 513 (16.3) 388 (14.7) 2158 (15.1) Dissatisfied or very dissatisfied 127 (20.6) 617 (19.6) 635 (24.1) 3038 (21.2) Missing – 6 (0.2) 1 (0.0) 8 (0.1) Nutritional risk status Low risk 394 (64.0) 2256 (71.6) 1577 (59.8) 10 128 (70.7) High risk 201 (32.6) 796 (25.3) 1008 (38.2) 3919 (27.4) Missing 21 (3.4) 98 (3.1) 54 (2.0) 271 (1.9) Weight classification§ Normal weight 112 (18.2) 1193 (37.9) 383 (14.5) 4827 (33.7) Overweight 248 (40.3) 1312 (41.7) 967 (36.6) 6086 (42.5) Obese 253 (41.1) 638 (20.3) 1277 (48.4) 3365 (23.5) Missing 3 (0.5) 7 (0.2) 12 (0.5) 40 (0.3) ↵* The place of residence classification (urban or rural) was derived by CLSA based on Statistics Canada’s Postal Code Conversion File, which defines rural areas as those with a total population of fewer than 10 000 people.
↵† Other provinces are Alberta, Manitoba, Nova Scotia, Prince Edward Island, Newfoundland and Labrador, and Saskatchewan.
↵‡ Missing data on medical conditions: living with pain (n = 262, 1.3%), bowel disorders (n = 49, 0.2%), arthritis (n = 168, 0.8%), heart disease (n = 27, 0.1%), kidney disease (n = 41, 0.2%), stroke (n = 35, 0.2%), cancer (n = 19, 0.1%), hypertension (n = 2472, 11.9%), anxiety disorder (n = 25, 0.1%).
↵§ Based on body mass index international classification for adults aged ≥ 18 years.
- Table 2:
Three-year incidence and risk of depression, stratified by immigration and diabetes status
Variable No. (%) of participants Weighted OR (95% CI)* Depression No depression Total Crude Adjusted Immigrant Diabetes 60 (9.7) 556 (90.3) 616 1.19 (0.86–1.65) No diabetes 265 (8.4) 2885 (91.6) 3150 Nonimmigrant Diabetes 279 (10.6) 2360 (89.4) 2639 1.35 (1.15–1.57) No diabetes 1200 (8.4) 13 035 (91.6) 14 318 Diabetes v. no diabetes 1.18 (1.01–1.37) Interaction effect of immigration status and diabetes at baseline Immigrant with diabetes v. immigrant without diabetes 1.12 (0.80–1.56) Immigrant with diabetes v. nonimmigrant with diabetes 1.01 (0.72–1.41) Immigrant without diabetes v. nonimmigrant without diabetes 1.15 (0.98–1.35) Nonimmigrant with diabetes v. nonimmigrant without diabetes 1.27 (1.08–1.49) Note: CI = confidence interval, OR = odds ratio.
↵* The model included all the variables listed in Appendix 1, Table 1. Immigration status, sex and age were forced in all models. We removed other variables that were not significant (p > 0.5), which did not affect the Bayesian Information Criterion upon inclusion and which did not modify the effect of the main exposure variable by more than 10%. Survey weights were provided by the Canadian Longitudinal Study on Aging. The full model is available in Appendix 1, Table 2.
- Table 3:
Baseline characteristics of Cohort 2 individuals with and without depression by immigration status
Characteristic Immigrant Nonimmigrant No. (%) of participants with depression
n = 762No. (%) of participants without depression
n = 3151No. (%) of participants with depression
n = 3797No. (%) of participants without depression
n = 14 344Age, yr 45–60 325 (42.7) 1173 (37.2) 1941 (51.1) 7053 (49.2) 61–70 235 (30.8) 1048 (33.3) 1087 (28.6) 4228 (29.5) 71–85 202 (26.5) 930 (29.5) 769 (20.3) 3063 (21.4) Sex Male 266 (34.9) 1741 (55.3) 1351 (35.6) 7175 (50.0) Female 496 (65.1) 1410 (44.7) 2446 (64.4) 7169 (50.0) Marital status Single 68 (8.9) 149 (4.7) 485 (12.8) 1178 (8.2) Married 465 (61.0) 2403 (76.3) 2223 (58.5) 10417 (72.6) Widowed, divorced or separated 227 (29.8) 598 (19.0) 1088 (28.7) 2745 (19.1) Missing 2 (0.3) 1 (0.0) 1 (0.0) 4 (0.0) Language most spoken at home French 65 (8.5) 205 (6.5) 925 (24.4) 3174 (22.1) English 597 (78.3) 2598 (82.5) 2861 (75.3) 11137 (77.6) Other 58 (7.6) 254 (8.1) 7 (0.2) 17 (0.1) Missing 42 (5.5) 94 (3.0) 4 (0.1) 16 (0.1) Ethnic or racial background White 629 (82.5) 2641 (83.8) 3758 (99.0) 14191 (98.9) Black 24 (3.1) 89 (2.8) 8 (0.2) 19 (0.1) South Asian 36 (4.7) 122 (3.9) 2 (0.1) 6 (0.0) Chinese 17 (2.2) 107 (3.4) 7 (0.2) 37 (0.3) Other 53 (7.0) 188 (6.0) 20 (0.5) 81 (0.6) Missing 3 (0.4) 4 (0.1) 2 (0.1) 10 (0.1) Years since arrival to Canada < 20 112 (14.7) 395 (12.5) – – 20–40 190 (24.9) 783 (24.8) – – > 40 460 (60.4) 1973 (62.6) – – Total household income, $ < 20 000 57 (7.5) 82 (2.6) 332 (8.7) 436 (3.0) 20 000–50 000 208 (27.3) 591 (18.8) 923 (24.3) 2443 (17.0) 50 000–100 000 246 (32.3) 1075 (34.1) 1217 (32.1) 4794 (33.4) > 100 000 194 (25.5) 1180 (37.4) 1088 (28.7) 5854 (40.8) Missing 57 (7.5) 223 (7.1) 237 (6.2) 817 (5.7) Working status Employed 297 (39.0) 1332 (42.3) 1510 (39.8) 6373 (44.4) Unemployed 71 (9.3) 111 (3.5) 313 (8.2) 468 (3.3) Retired 393 (51.6) 1701 (54.0) 1964 (51.7) 7474 (52.1) Missing 1 (0.1) 7 (0.2) 10 (0.3) 29 (0.2) Education level Less than secondary school 30 (3.9) 76 (2.4) 260 (6.8) 595 (4.1) Secondary school 64 (8.4) 196 (6.2) 367 (9.7) 1278 (8.9) Postsecondary degree or diploma 664 (87.1) 2871 (91.1) 3166 (83.4) 12454 (86.8) Missing 4 (0.5) 8 (0.3) 4 (0.1) 17 (0.1) Place of residence* Rural 75 (9.8) 310 (9.8) 453 (11.9) 1850 (12.9) Urban 674 (88.5) 2800 (88.9) 3293 (86.7) 12328 (85.9) Missing 13 (1.7) 41 (1.3) 51 (1.3) 166 (1.2) Province Quebec 111 (14.6) 365 (11.6) 922 (24.3) 3204 (22.3) British Columbia 227 (29.8) 995 (31.6) 665 (17.5) 2735 (19.1) Ontario 223 (29.3) 872 (27.7) 855 (22.5) 2921 (20.4) Other† 201 (26.4) 919 (29.2) 1355 (35.7) 5484 (38.2) Medical conditions‡ Living with pain 366 (48.0) 945 (30.0) 1904 (50.1) 4267 (29.7) Bowel disorders 105 (13.8) 227 (7.2) 582 (15.3) 1136 (7.9) Arthritis 28 (3.7) 83 (2.6) 160 (4.2) 354 (2.5) Heart disease 280 (36.7) 1009 (32.0) 1442 (38.0) 4364 (30.4) Kidney disease 17 (2.2) 67 (2.1) 109 (2.9) 294 (2.0) Stroke 15 (2.0) 37 (1.2) 67 (1.8) 157 (1.1) Cancer 117 (15.4) 474 (15.0) 573 (15.1) 2012 (14.0) Hypertension 283 (37.1) 1080 (34.3) 1457 (38.4) 4870 (34.0) Anxiety disorder 119 (15.6) 109 (3.5) 919 (24.2) 611 (4.3) Alcohol consumption Never 101 (13.3) 310 (9.8) 528 (13.9) 1218 (8.5) About once a month 171 (22.4) 512 (16.2) 756 (19.9) 2259 (15.7) 2–4 times a month 150 (19.7) 574 (18.2) 827 (21.8) 3166 (22.1) > 2 times a week 310 (40.7) 1645 (52.2) 1625 (42.8) 7436 (51.8) Missing 30 (3.9) 110 (3.5) 61 (1.6) 265 (1.8) Smoking status Nonsmoker 377 (49.5) 1690 (53.6) 1644 (43.3) 7200 (50.2) Former smoker 315 (41.3) 1293 (41.0) 1690 (44.5) 6040 (42.1) Smoker 70 (9.2) 168 (5.3) 463 (12.2) 1104 (7.7) Sleep quality Satisfied or very satisfied 339 (44.5) 2014 (63.9) 1692 (44.6) 9133 (63.7) Neutral 132 (17.3) 513 (16.3) 588 (15.5) 2162 (15.1) Dissatisfied or very dissatisfied 291 (38.2) 618 (19.6) 1512 (39.8) 3041 (21.2) Missing – 6 (0.2) 5 (0.1) 8 (0.1) Nutritional risk status Low risk 381 (50.0) 2256 (71.6) 1772 (46.7) 10147 (70.7) High risk 356 (46.7) 797 (25.3) 1941 (51.1) 3924 (27.4) Missing 25 (3.3) 98 (3.1) 84 (2.2) 273 (1.9) Weight classification§ Normal weight 264 (34.6) 1194 (37.9) 1205 (31.7) 4838 (33.7) Overweight 310 (40.7) 1313 (41.7) 1423 (37.5) 6094 (42.5) Obese 184 (24.1) 637 (20.2) 1144 (30.1) 3372 (23.5) Missing 4 (0.5) 7 (0.2) 25 (0.7) 40 (0.3) ↵* The place of residence classification (urban or rural) was derived by CLSA based on Statistics Canada’s Postal Code Conversion File, which defines rural areas as those with a total population of fewer than 10 000 people.
↵† Other provinces are Alberta, Manitoba, Nova Scotia, Prince Edward Island, Newfoundland and Labrador, and Saskatchewan.
↵‡ Missing data on medical conditions: living with pain (n = 293, 1.3%), bowel disorders (n = 51, 0.2%), arthritis (n = 197, 0.9%), heart disease (n = 33, 0.1%), kidney disease (n = 44, 0.2%), stroke (n = 37, 0.2%), cancer (n = 25, 0.1%), hypertension (n = 2438, 11.0%), anxiety disorder (n = 44, 0.2%).
↵§ Based on body mass index international classification for adults aged ≥ 18 years.
- Table 4:
Three-year incidence and risk of diabetes, stratified by immigration and depression status
Variable No. (%) of participants Weighted OR (95% CI)* Diabetes No diabetes Total Crude Adjusted Immigrant Depression 54 (7.1) 708 (92.9) 762 1.66 (1.16–2.39) No depression 144 (4.6) 2970 (95.4) 3151 Nonimmigrant Depression 257 (6.8) 3540 (93.2) 3797 1.55 (1.31–1.82) No depression 693 (4.8) 13 651 (95.2) 14 344 Depression v. no depression 1.43 (1.21–1.68) Interaction effect of immigrant status and depression at baseline Immigrant with depression v. immigrant without depression 1.60 (1.08–2.37) Immigrant with depression v. nonimmigrant without depression 1.10 (0.76–1.58) Immigrant without depression v. nonimmigrant without depression 0.96 (0.76–1.21) Nonimmigrant with depression v. nonimmigrant without depression 1.39 (1.16–1.68) Note: CI = confidence interval, OR = odds ratio.
↵* The model included all the variables listed in Appendix 1, Table 3. Immigration status, sex and age were forced in all models. We removed other variables that were not significant (p > 0.5), which did not affect the Bayesian Information Criterion upon inclusion and which did not modify the effect of the main exposure variable by more than 10%. Survey weights were provided by the Canadian Longitudinal Study on Aging. The full model is available in Appendix 1, Table 2.
In this issue

Article tools


Related Articles
Cited By...
- No citing articles found.