Article Text

Abstract
The Gini coefficient has been the most popular method for operationalising income inequality in the public health literature. However, a number of alternative methods exist, and they offer researchers the means to develop a more nuanced understanding of the distribution of income. Income inequality measures such as the generalised entropy index and the Atkinson index offer the ability to examine the effects of inequalities in different areas of the income spectrum, enabling more meaningful quantitative assessments of qualitatively different inequalities. This glossary provides a conceptual introduction to these and other income inequality measures.
- Atkinson
- generalised entropy
- Gini
- Lorenz
- income inequality
Statistics from Altmetric.com
A variety of strategies exist for the operationalisation of income inequality. However, health researchers have usually been limited to using one of the most popular measures – the Gini coefficient – at the expense of other, more nuanced measures. Drawing upon the economic and sociological literature on income inequality, this glossary aims to provide public health researchers with additional tools with which to operationalise income inequality.
This is a particularly relevant task, given the rapid development of the literature on the health effects of income inequality.1–5 More than 115 empirical tests of the income inequality hypothesis have been published, yet a consensus has not emerged. Indeed, whilst a number of theoretically plausible pathways through which income inequality may influence patterns of population health have been investigated (including psychosocial mechanisms and the effects of social capital), recent reviews of the income inequality and population health literature have reached mixed conclusions1–3 and the hypothesis is yet to be fully integrated within the broader literature on proximal and distal determinants of health.6–8
One of the central points of contention in this literature is how to measure income inequality itself. The impetus behind the debate is Kawachi and Kennedy’s9 influential US study, which compared the behaviour of six different measures of income inequality: the Gini coefficient, the decile ratio, the proportion of income earned by the poorest 50%, 60% and 70% of households, the Robin Hood index, the Atkinson index and Theil’s entropy measure. Their analysis indicated that the measures behaved very similarly and were highly correlated, with Pearson correlations ranging from 0.86 to 0.99. Furthermore, all of the measures were also highly correlated with state-level mortality indicators. Given these relationships, Kawachi and Kennedy concluded that the choice of income inequality indicator was unlikely to influence results of empirical tests of the health effects of income inequality.
Many subsequent studies in this field cited the Kawachi and Kennedy results to justify their choice of income inequality measure. Yet other studies from the literature on the health effects of income inequality have documented that the choice of inequality indicator does indeed influence the results generated by the analysis. For example, Weich et al.10, in their study of income inequality and self-rated health using the British Household Panel Survey, found important differences between the Gini coefficient and the generalised entropy (GE) index. More specifically, they observed that regional income inequality, operationalised using the Gini coefficient, was significantly associated with poor health among respondents from low-income groups, but that this relationship was not significant for GE indicators sensitive to inequalities at the top or bottom of the income spectrum. Similarly, recent research on Argentina has documented an ecological relationship between provincial income inequality (operationalised with the Gini coefficient) and life expectancy for both males (r = −0.55, p<0.01) and females (r = −0.61, p<0.01).11 However, this relationship was not fully robust to the choice of income inequality summary index; the relationship between income inequality and life expectancy was strongest for the Gini and GE measures sensitive to inequalities in the middle of the income spectrum and not significant at all for GE measures highly sensitive to inequalities at the top or bottom of the distribution.
These examples support the notion that it is important to examine the robustness of the income inequality hypothesis under varying inequality measures. Using a variety of measures enables more meaningful analysis about the pathogenic effects of inequalities in different parts of the income spectrum.12 13 After all, a situation of large income differences within the bottom, middle or top of the income distribution are different kinds of inequality, as Wen et al.14 recently demonstrated in their analysis of the concentrated poverty and concentrated affluence hypotheses. By discussing some of the most promising means by which to operationalise income inequality, this glossary aims to contribute to the development of a more nuanced approach to income inequality measurement in public health research.
Gini coefficient
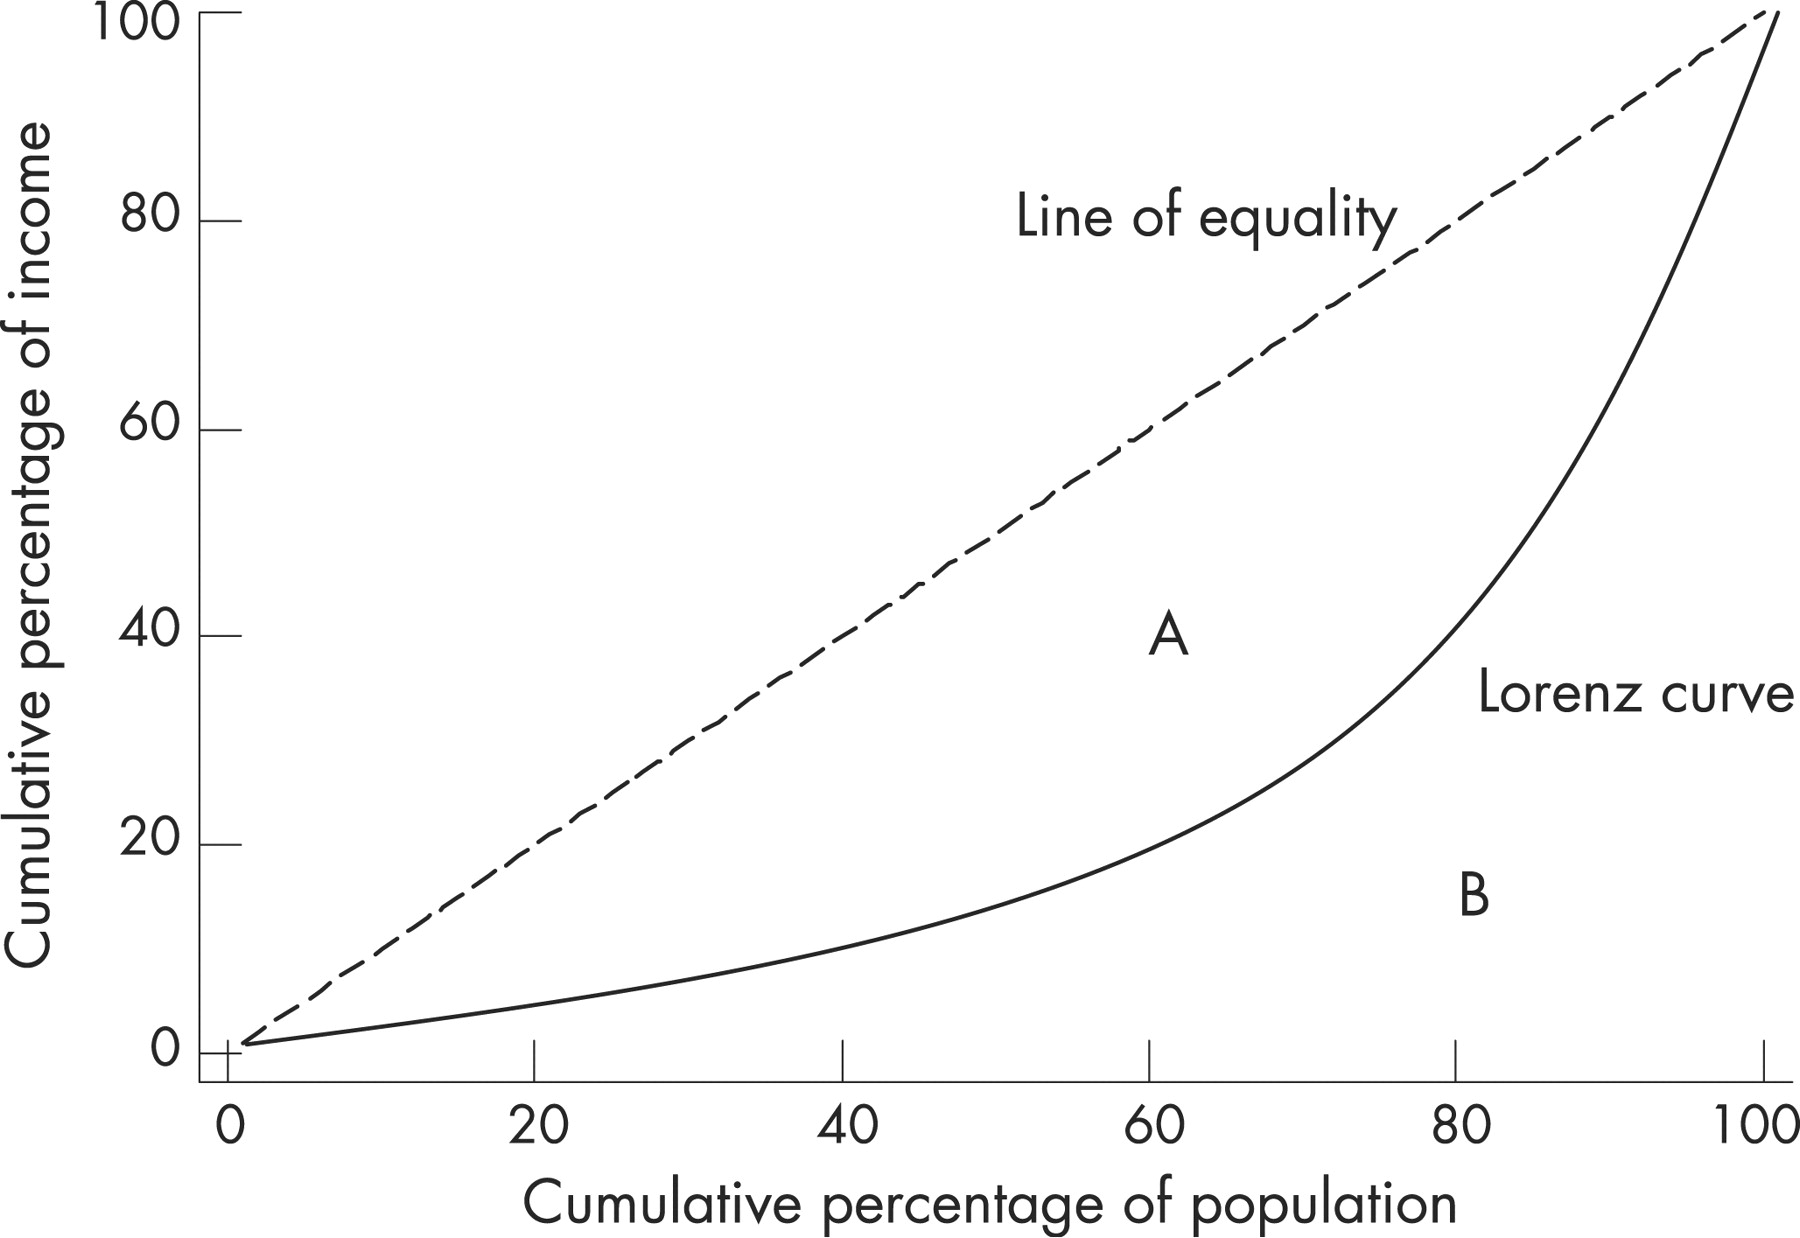
By far the most popular measure of income inequality, the Gini coefficient15–18 is derived from the Lorenz curve framework illustrated in figure 1.
The Lorenz curve shows the percentage of total income earned by cumulative percentage of the population. In a perfectly equal society, the “poorest” 25% of the population would earn 25% of the total income, the “poorest” 50% of the population would earn 50% of the total income and the Lorenz curve would follow the path of the 45° line of equality. As inequality increases, the Lorenz curve deviates from the line of equality; the “poorest” 25% of the population may earn 10% of the total income; the “poorest” 50% of the population may earn 20% of the total income and so on.
One of the appealing properties of this framework is that it can be used to generate a single summary statistic of the income distribution, the Gini coefficient. The Gini coefficient is equivalent to the size of the area between the Lorenz curve and the 45° line of equality divided by the total area under the 45° line of equality. In figure 1, it is depicted as area A divided by area A+B. The Gini coefficient can be presented as a value between 0 and 1 or as a percentage. A coefficient of 0 reflects a perfectly equal society in which all income is equally shared; in this case the Lorenz curve would follow the line of equality. The more the Lorenz curve deviates from the line of equality, the higher will be the resulting value of the Gini coefficient. A coefficient of 1 (or 100%) represents a perfectly unequal society wherein all income is earned by one individual.15–18
The Gini coefficient’s main weakness as a measure of income distribution is that it is incapable of differentiating different kinds of inequalities. Lorenz curves may intersect, reflecting differing patterns of income distribution, but nevertheless resulting in very similar Gini coefficient values.16 19 This troubling property of the Lorenz framework complicates comparisons of Gini coefficient values and may confound tests of the income inequality hypothesis. Along with this limitation, researchers working with the Gini coefficient need to be aware that it is most sensitive to inequalities in the middle part of the income spectrum.20 21 This may be appropriate in many studies, but in some cases researchers will have valid reasons to emphasise inequalities in the top or bottom of the spectrum.14 Despite these limitations, the Gini coefficient has been used extensively in the public health literature,22–25 and it remains the most popular measure of income inequality. Yet because it is highly sensitive to inequalities in the middle of the income spectrum, the Gini coefficient is not “neutral” or value free.26 Because of this property, the Gini coefficient is best seen as simply one of the many strategies available for the operationalisation of income inequality.
Atkinson index
More precisely labelled a family of income inequality measures, the Atkinson index allows for varying sensitivity to inequalities in different parts of the income distribution. This was important to Atkinson, who was concerned with the inability of the Gini framework to give different parts of the income spectrum varying weights.27 In his influential text The Economics of Inequality, Atkinson noted (p. 47) that inequality “cannot, in general, be measured without introducing social judgements. Measures such as the Gini coefficient are not purely ‘statistical’ and they embody implicit judgements about the weight to be attached to inequality at different points on the income scale”.16 Therefore, his index incorporates a sensitivity parameter (ϵ); which can range from 0 (meaning that the researcher is indifferent about the nature of the income distribution), to infinity (where the researcher is concerned only with the income position of the very lowest income group). Atkinson argued that this index was a way to incorporate Rawls’ conception of social justice into the measurement of income inequality. In practice, ϵ values of 0.5, 1, 1.5 or 2 are used; the higher the value, the more sensitive the Atkinson index becomes to inequalities at the bottom of the income distribution. The index can easily be generated with Stata’s ineqdeco command.13
An intuitive interpretation of this index is possible: Atkinson values can be used to calculate the proportion of total income that would be required to achieve an equal level of social welfare as at present if incomes were perfectly distributed. For example, an Atkinson index value of 0.20 suggests that we could achieve the same level of social welfare with only 1–0.20 = 80% of income. The theoretical range of Atkinson values is 0 to 1, with 0 being a state of equal distribution.
The Atkinson index has been used in the literature on income inequality and health with great effect. This measure featured in Laporte’s28 study of income inequality and mortality, an important critique of the reliance on aggregate-level data dominant in the literature on the income inequality hypothesis. Regidor et al.29 used the Atkinson index with sensitivity parameters of 1.0, 1.5 and 2.0 to examine the association between income inequality and life expectancy in Spain.
Coefficient of variation (CV)
This measure of income inequality is calculated by the dividing the standard deviation of the income distribution by its mean.17 18 More equal income distributions will have smaller standard deviations; as such, the CV will be smaller in more equal societies. Despite being one of the simplest measures of inequality, use of the CV has been fairly limited in the public health literature and it has not featured in research on the income inequality hypothesis. This may be attributed to important limitations of the CV measure: (1) it does not have an upper bound, unlike the Gini coefficient,18 making interpretation and comparison somewhat more difficult; and (2) the two components of the CV (the mean and the standard deviation) may be exceedingly influenced by anomalously low or high income values. In other words, the CV would not be an appropriate choice of income inequality measure if a study’s income data did not approach a normal distribution.
Decile ratios
A simple but effective way to examine income inequality is to calculate decile ratios. The calculation is done by taking, for example, the income earned by the top 10% of households and dividing that by the income earned by the poorest 10% of households. Decile ratios were used by Gold et al.30 in their study of income inequality and teen birth rates in the US and by Lobmayer and Wilkinson31 in their study of income inequality and mortality in 14 countries. An important advantage of this measure is that it enables sensitivity analyses; for example, the correlations between population health and the 20:80, 30:70, 40:60 decile ratios may be compared. This allows researchers to examine which sections of the income spectrum may be most important as a social determinant of health.
Generalised entropy (GE) index
The GE index, like the Atkinson index, is more correctly labelled a family of income inequality measures.19 32 It also incorporates a sensitivity parameter (α) that varies in the weight given to inequalities in differing parts of the income spectrum. Typically, four GE measures are used: these are GE(–1), GE(0), GE(1) and GE(2). The more positive α (the sensitivity parameter; −1, 0, 1 or 2) is, the more sensitive GE(α) is to inequalities at the top of the income distribution.13 The theoretical range of GE values is 0 to infinity, with 0 being a state of equal distribution and values greater than 0 representing increasing levels of inequality. Another beneficial property of the GE measure is that it is decomposable;32 that is, it can be broken down to component parts (i.e. population subgroups). This enables analysis of between- and within-area effects.33 The GE index has been used to great effect in the literature on the health effects of income inequality.9 10 33–35 The literature on income inequality measurement also includes two measures which are closely related to the GE index. More specifically, the mean log deviation of income measure is functionally equivalent to the GE(0) index and Theil’s entropy measure is equivalent to the GE(2) index.36 The GE index can easily be generated with Stata’s ineqdeco command.13
Kakwani progressivity index
The Kakwani progressivity index builds from the Gini framework. Originally devised to measure the progressivity of tax systems,37 it is also used to examine health care issues such as equity in health care expenditures. In this case, the Kakwani progressivity index is the difference between the Gini coefficient for incomes and the concentration index for out-of-pocket health care payments.38 The rationale is that if out-of-pocket expenses are a progressive way to finance health services, the concentration curve will lie below the Lorenz curve and the Kakwani progressivity index will have a positive value (being the difference between the Gini coefficient, the summary of the Lorenz curve, and the concentration index, the summary of the concentration curve).39 In theory, Kakwani index values range from −2 (indicating severe regressivity) to +1 (indicating strong progressivity).40 In their study of health care financing in Colombia, Castano et al.38 offer a good example of the use of the Kakwani progressivity index. Similarly, Wagstaff and van Doorslaer40 offer an excellent application of the Kakwani index in the study of health care financing in several countries in the Organisation for Economic Cooperation and Development (OECD).
Proportion of total income earned
The proportion of income received by the poorest nth% of the population is one of the most intuitive measures of income inequality. This measure is very similar to the Lorenz framework. This measure of income inequality can easily be calculated with a spreadsheet or data analysis program, and its intuitive appeal makes it an appropriate choice of income inequality measure for many audiences. However, this measure offers a very limited insight into the income distribution; the proportion of income received by the poorest 50% does not inform us about how equally income is shared by the poorest 50% and also reveals nothing about the nature of the income distribution among the other half of the population. Despite this important limitation, proportion measures have been used to some effect in some public health literature. For example, Ross et al.41 used the proportion of total income earned by the poorest 50% of the population (i.e. the median share) to compare the health effects of income inequality in Australia, Canada, Great Britain, Sweden and the United States. The median share of income has also been used in other studies of the income inequality hypothesis,23 as has the proportion of income received by the poorest 10%,45 20%,46 60%9 and 70%47 of the population.
Robin Hood index
The Robin Hood Index, also known as the Pietra ratio, represents the maximum vertical distance from the Lorenz curve to the 45° line of equality.9 27 It is called the Robin Hood index because it can be interpreted as the proportion of income that has to be transferred from those above the mean to those below the mean in order to achieve an equal distribution.27 48 As such, higher Robin Hood values indicate a more unequal society, wherein a larger share of income needs to be distributed to achieve equality. The Robin Hood index has been used effectively in several studies of the income inequality hypothesis.49–51 Unlike the Atkinson and GE indexes, the Robin Hood framework does not incorporate a sensitivity parameter.
Sen poverty measure
Nobel Prize laureate Amartya Sen has developed an interesting poverty measure that incorporates the Gini coefficient for people living below the poverty line along with the headcount ratio of poverty and the average income of those below the poverty line.52 This measure has not been utilised in the study of the income inequality hypothesis and is not commonly used in public health research; however, given the renewed interested in poverty and inequality effects,14 the Sen poverty measure may yet make a contribution in the public health literature.
DISCUSSION
This glossary has outlined a number of promising measures available for the operationalisation of income inequality. Much like the central concept of health inequality,53 which can be measured using a variety of approaches, the concept of income inequality is complex and multifaceted and requires a thoughtful operationalisation strategy. The income inequality measures introduced in this glossary each provide a qualitatively different perspective on income inequality. Their application in public health research would encourage a development of our understanding of how macro-level social factors influence patterns of ill health. Using a variety of income inequality measures would also help to temper the reductionist tendency of the quantitative paradigm, for the use of the measures outlined in this glossary requires the acknowledgement that income distributions cannot be perfectly summarised in a single number.
Acknowledgments
Christine Allen provided valuable comments in the preparation of this manuscript. I am also grateful for the insightful comments from the three reviewers.
REFERENCES
Footnotes
Funding: This research was supported in part by a President’s Research Grant from Simon Fraser University.
Linked Articles
- In this issue